BACKGROUND INFORMATION - Updated April 2019 - TJX Companies
←
→
Page content transcription
If your browser does not render page correctly, please read the page content below

BACKGROUND
INFORMATION

        Updated April 2019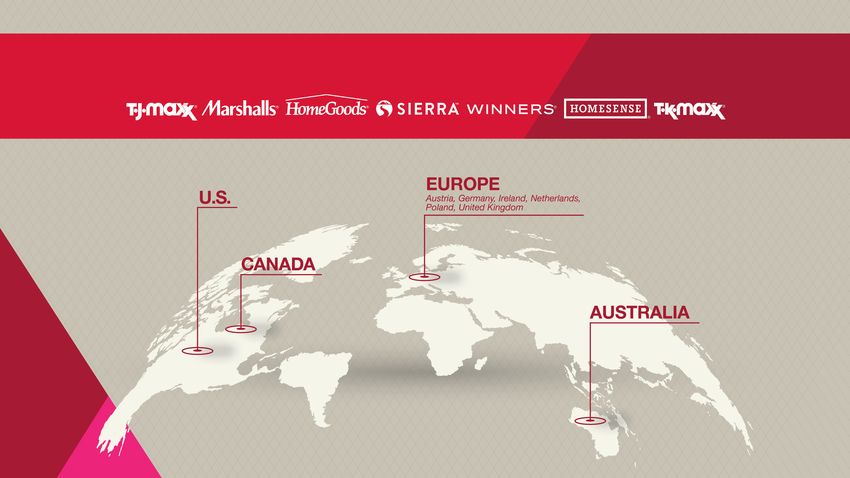
OUR GLOBAL STORE BASE SPANS 9 COUNTRIES ON 3 CONTINENTS

Overview
⁄            Only major international off-price apparel and home
             fashions retailer

⁄            Over 4,300 retail locations across 9 countries on 3 continents

⁄            $39 billion in revenues in 20181

⁄            Generated $4.1 billion of cash from operations in 2018

⁄            Returned $3.4 billion to shareholders through dividends and
             share repurchases

⁄            Ranked No. 85 in the 2018 Fortune 500 listings

    1   References to the year 2018 in this presentation denote TJX’s Fiscal Year 2019, which began February 4, 2018 and ended February 2, 2019
TJX…A Portfolio of Four Major
Off-Price Divisions
                          Store Count                Estimated Store
                           Year End                      Growth      Avg. Store                                        Primary
                             FYE19                      Potential    Size (sq. ft.)                                 Classifications

Marmaxx1 (U.S.)                 2,343                        3,000                    28,000                 Family Apparel, Home
HomeGoods2 (U.S.)                765                         1,400                    24,000                                Home
(Incl. Homesense)

TJX Canada                       484                           600
  Winners                        271                                                  28,000                  Family Apparel, Home
  HomeSense                      125                                                  23,000                          Home
  Marshalls                      88                                                   27,000                  Family Apparel, Home

TJX International                679                          1,100
  T.K. Maxx (Europe)         567                                                      29,000                  Family Apparel, Home
  Homesense (U.K. & Ireland) 68                                                       20,000                          Home
  T.K. Maxx (Australia)      44                                                       22,000                  Family Apparel, Home

TOTAL3                           4,306                       6,100
                      1 T.J. Maxx and Marshalls
                      2 Long  Term potential includes 1,000 HomeGoods and 400 Homesense stores
                      3   FYE19 total includes 35 Sierra stores. Sierra stores are not included in estimated long-term growth potential
T.J. Maxx (U.S.)

Marshalls (U.S.)

HomeGoods (U.S.)

Homesense (U.S.)

Sierra (U.S.)

Winners (Canada)
Marshalls (Canada)
HomeSense (Canada)
T.K. Maxx (UnitedKingdom,Ireland,Germany,Poland,Austria,Netherlands)
Homesense (United Kingdom & Ireland)
T.K. Maxx (Australia)
What Is Off-Price Retailing?
⁄   Brand-name merchandise at great values
⁄   Opportunistic buying
⁄   Substantially lower prices than full-price retailers’
    (including department, specialty, and major online
    retailers) regular prices
⁄   Rapidly changing assortments
⁄   Disciplined inventory and expense management
Differentiated Shopping
Experience
⁄ Great value = Brand
Fashion
Price
Quality
⁄ Ever-changing mix of merchandise
⁄ Treasure hunt experience
⁄ Convenient, easy to access locationsWho Is Our Core Customer?
⁄ Female
⁄ Between 25-54 years old
⁄ Middle to upper-middle income
⁄ Fashion and value conscious
⁄ Shops a range of different retailers, from department &
specialty stores to mass merchants, both online and in-store.Succeeding In Many Types Of Environments
(Consolidated Performance)
42 7,000
Total Segment Profit* ($ Millions)
36 6,000
Net Sales ($ Billions)
30 5,000
24 4,000
18 3,000
12 2,000
6 1,000
0 0
(FYE) 82* 83* 91* 02* 09* 10* 19
* Recessions
Consistent sales and profit growth
*Meaning segment profit (generally pre-tax income before general corporate and net interest expense) for the sum of our reporting segments. See the notes to our filed financial statements for more detail.Consolidated Comp Store Sales
Consolidated Comparable Store Sales %
% +23 +17 +9 +4 +10 +6 +10 +5 +1 +6 +2 +5 +2 0 -2 +7 +6 +5 +5 +2 +3 +3 +1 +3 +1 +3 +2 +1 +6 +4 +4 +7 +3 +2 +5 +5 +2 +6
FY ’82* ’83* ’91* ’02* ’09* ’10* ‘19
* Recessions
23 consecutive years of comparable store sales growth
Comparable store sales for fiscal years commencing in 2005 are on a constant currency basis. Prior years include the impact of foreign exchange to the extent it was applicable.Long Track Record of Returning
Cash to Shareholders $3.4B
$2.4B $2.4B $2.4B
$2.1B
$1.9B
$1.7B
$1.4B $1.6B
FY11 FY12 FY13 FY14 FY15 FY16 FY17 FY18 FY19
BUYBACKS DIVIDENDS
23 consecutive years of dividend increasesMajor Strengths: Why TJX Is So Well Positioned ⁄ World-class buying organization ⁄ Global supply chain and distribution network ⁄ Leveraging our global presence ⁄ One of the most flexible retailers in the world
World-Class Buying Organization
⁄ Approximately 1,100 Associates in our buying organization
Located in 12 countries on 4 continents
⁄ Global sourcing machine
Source from a universe of 21,000+ vendors and 100+ countries
⁄ Expertise developed over many decades
Focus on teaching and training
⁄ Mutually beneficial vendor relationships
⁄ Access to high-quality, branded merchandise for 42 years!Global Supply Chain and
Distribution Network
⁄ Supports our off-price buying and our highly integrated,
global business
⁄ Designed to support efficient processes and allocation
Right product, right stores, right time
⁄ Investments to build capacity and support growth plans
⁄ Decades of off-price knowledge and experienceLeveraging Our Global Presence
⁄ Only major international off-price apparel and home fashions
retailer in the world
⁄ All major divisions have 25 years or more of operating expertise
⁄ Highly integrated, global teams, and international infrastructure
developed over decades
⁄ All divisions leveraging talent, infrastructure, ideas, and expertise
⁄ Capitalizing on first-mover advantagesOne of the Most Flexible
Retailers in the World
⁄ Broad assortment attracts a wide customer demographic
⁄ Four large divisions function as “one TJX”
All leveraging value
⁄ Nimbleness to respond to changing customer preferences
and market trends
⁄ Buy merchandise in many waysDriving Traffic and Comp Sales
⁄ Great opportunities to gain even more market share
⁄ Target wide customer demographic / Attract younger customers
⁄ Leverage integrated marketing approach
TV, digital & social
⁄ Increase customer spend
Loyalty programs to drive member engagement
⁄ Upgrade shopping experience
⁄ Differentiating e-commerce to drive sales and multi-channel
engagementGlobal Store Growth Potential
FYE19 Estimated Long-Term Potential
7,000
6,100
6,000
5,000
4,306
4,000
3,000
3,000
2,343
2,000
1,400 1,100
1,000 765
484 600 679
0
Marmaxx (U.S.) HomeGoods & TJX Canada TJX International Total TJX**
Homesense (U.S.)* (Europe & Australia)
*Long-Term Potential includes 1,000 HomeGoods and 400 Homesense stores
**FYE19 total includes 35 Sierra stores. Sierra stores are not included in estimated long-term growth potentialInvesting in Growth / Gaining Share ⁄ New stores and remodels ⁄ Global supply chain and distribution network ⁄ Technology / systems ⁄ Talent and training
Key Investment Points
⁄   Our commitment to value has never wavered
⁄   Customer traffic increases tell us our merchandise mix is
    resonating with consumers across all our retail banners
⁄   Convinced we are gaining market share across our four
    major divisions
⁄   Leveraging our differentiated business model and
    global presence
⁄   Investing to support our growth plans
⁄   Excellent financial returns
⁄   Far from finished growing TJX around the world!
The TJX Companies, Inc. Safe Harbor Statement SAFE HARBOR STATEMENT UNDER THE PRIVATE SECURITIES LITIGATION REFORM ACT OF 1995: Various statements made in this presentation are forward-looking and involve a number of risks and uncertainties. All statements that address activities, events or developments that we intend, expect or believe may occur in the future are forward-looking statements. The following are some of the factors that could cause actual results to differ materially from the forward-looking statements: execution of buying strategy and inventory management; operational and business expansion and management of large size and scale; customer trends and preferences; various marketing efforts; competition; personnel recruitment, training and retention; labor costs and workforce challenges; data security and maintenance and development of information technology systems; economic conditions and consumer spending; corporate and retail banner reputation; quality, safety and other issues with our merchandise; compliance with laws, regulations and orders and changes in laws, regulations and applicable accounting standards; serious disruptions or catastrophic events and adverse or unseasonable weather; expanding international operations; merchandise sourcing and transport; commodity availability and pricing; fluctuations in currency exchange rates; fluctuations in quarterly operating results and market expectations; mergers, acquisitions, or business investments and divestitures, closings or business consolidations; outcomes of litigation, legal proceedings and other legal or regulatory matters; tax matters; disproportionate impact of disruptions in the second half of the fiscal year; real estate activities; inventory or asset loss; cash flow and other factors that may be described in our filings with the Securities and Exchange Commission. We do not undertake to publicly update or revise our forward-looking statements even if experience or future changes make it clear that any projected results expressed or implied in such statements will not be realized.
You can also read