Behavioral Aspects of Individual and Group Decision Making and Risk Management in Recent Financial Crises
←
→
Page content transcription
If your browser does not render page correctly, please read the page content below

Massachusetts Institute of Technology
                    Sloan School of Management

Behavioral Aspects of Individual and Group
Decision Making and Risk Management in
         Recent Financial Crises
        Douglas T. Breeden* and John W. Payne**
                                   July 12, 2012

  *Fischer Black Visiting Professor of Financial Economics at MIT, and William W.
  Priest Professor of Finance and Former Dean, Duke University, Fuqua School of
        Business. Email: dbreeden@mit.edu. Website: dougbreeden.net.
  **Joseph J. Ruvane Professor of Management, Duke University, Fuqua School of
                       Business. Email: jpayne@duke.edu
    Reference materials for presentation at the Commonfund Institute at Yale
   University. We thank David Belmont and John Griswold of Commonfund and
      John Sprow of Smith Breeden Associates for references and materials.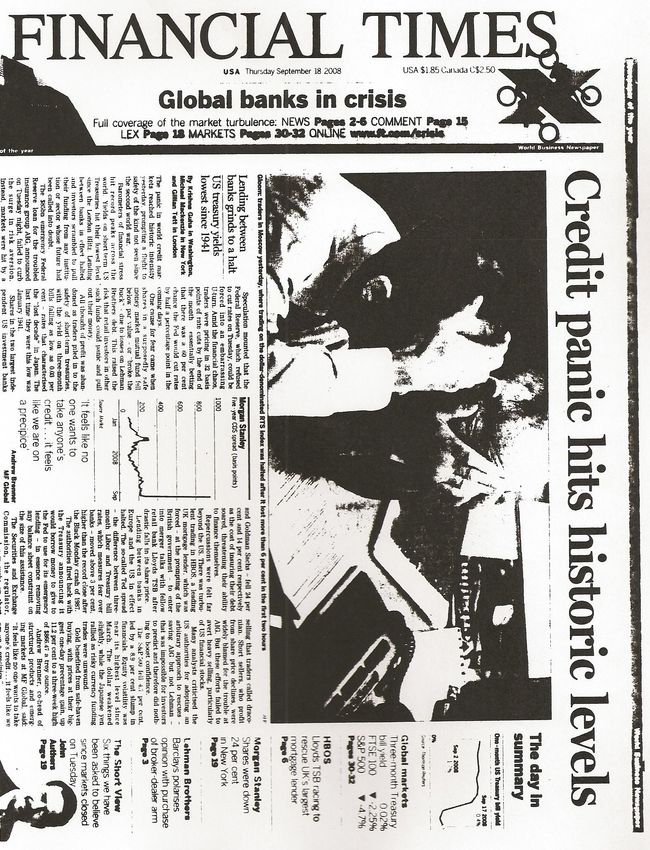
“Investing is a very humbling activity. You
constantly realize how human you are.”

Don Phillips, Managing Director – Morningstar, WSJ 12/5/2005

                                                               2
Examples of Major Losses By The Most
Well-Respected Risk Managers in the World

                 LTCM in 1998

Bear Stearns, Lehman, FNMA, Freddie Mac, AIG,
Citigroup, BofA, Wachovia, Merrill in 2008/2009

            and JPMorgan in 2012

                                                  3
LTCM Growth Per $1 Invested
       March 1994-September 1998

Source: When Genius Failed, Roger Lowenstein, 2000   4
                                                     4
Stock Price Falls of Big 5 Investment Banks
     in the Financial Panic of 2008/2009
                Price      2008        2009          Feb 2010    June 30
                12/31/20   Low Price   Low Price                 2012
                06

Bear Stearns    $162.78     $ 4.81     Sold to JPM
                                         for $10
Goldman         $199.35     $ 78.20      $47.41        $156.70     $95.86
Sachs
Lehman           $ 78.12    $ 0.05      Bankrupt
Brothers
Merrill Lynch    $ 93.10    $ 13.10    Sold to BAC
                                        (For $27?)
Morgan           $ 67.20    $ 9.58       $ 6.71        $ 27.15     $14.59
Stanley
                                                                       5
Stock Price Falls of Commercial Banks
in the Financial Panic of 2008/2009
12/31/ 2008 Low 2009 Low Feb 2010 June 30
2006 2012
Bank of $53.39 $18.52 $ 2.53 $15.94 $8.18
America
Citigroup $55.70 $11.52 $ 0.97 $ 3.35 ($27.41/10)
= $2.74
JP Morgan $48.30 $31.02 $14.96 $39.88 $35.73
National City $36.56 $ 1.36 Sold to PNC
nr 0
Wachovia $56.95 $ 1.84 Sold to
WFC nr 0
Wells Fargo $35.56 $20.51 $ 7.80 $27.29 $33.44
67
Financial Panic of 2008/2009:
                  Bank Stocks Fell 80%, as Much As In the Great Depression
                       End of Month, June 2007- Jan 2010 vs. Aug 1929- Aug1933
110                                                                                                           Fin
100

90

80

70

60

50

40

30

20

10

  0
                               10/31/2007

                                            12/31/2007

                                                                                                         10/31/2008

                                                                                                                      12/31/2008

                                                                                                                                                                                   10/31/2009

                                                                                                                                                                                                12/31/2009
      6/30/2007

                   8/31/2007

                                                         2/29/2008

                                                                     4/30/2008

                                                                                 6/30/2008

                                                                                             8/31/2008

                                                                                                                                   2/28/2009

                                                                                                                                               4/30/2009

                                                                                                                                                           6/30/2009

                                                                                                                                                                       8/31/2009
                    Bank Stocks: Great Depression 8/1929-12/1932                                                                   KBW Bank Stock Index (12/31/06=100) to 2/20/2009

                                                                                                                                                                                                             8
How can major institutions with such smart
people make such disastrous decisions?
9Maybe it was just
“The Storm of the Century”
“Six Sigma” Drop In Real Estate Prices and Loan
Delinquencies Soar:
• Real estate prices have dropped by amounts that
were truly unmeasured previously. Normal
standard deviation of annual real estate price
changes = 3.2%.
• Drop of 10% was 3 sigma, followed by a truly 6-
sigma drop of 20%. Worse in some areas. Almost
nobody saw drops of this magnitude nationally.
10Frequency of Housing Price 4Q % Changes
Case Shiller 1987-2009: 6 Sigma Event.
20
18
16
14
12
10
8
6
4
2
0
11Housing Price Percentage Declines By Dallas
Metro Area to 2009/2010 Lows Charlotte
Denver
from 2006-2007 Peaks Portland
Source: S&P Case Shiller Cleveland
Seattle
Atlanta
New York
Boston
Chicago
Minneapolis
Composite 20 Mkts
Composite 10 Mkts
Washington, D.C.
Tampa
Detroit
Los Angeles
San Francisco
San Diego
Miami
Las Vegas
Phoenix
-60 -50 -40 -30 -20 -10 0
12Banks’ Net Chargeoffs Hit Historic High on Loans on
Single Family Real Estate (Annualized Pct, Quarters 1991-2008 Q3)
2.00
1.75
1.50
1.25
1.00
0.75
0.50
0.25
0.00
91Q1
92Q1
93Q1
94Q1
95Q1
96Q1
97Q1
98Q1
99Q1
00Q1
01Q1
02Q1
03Q1
04Q1
05Q1
06Q1
07Q1
08Q1
09Q1
13… But maybe we contributed to the fall with
all-too-human errors in decision making.
Insights from Research on
Behavioral Decision Making
14JPMorgan’s $2+ Billion Loss
in its London Chief Investment Office:
Headline in USA Today, June 14, 2012:
“Dimon blames complacency for loss.”
CEO Jamie Dimon’s June 13, 2012 Testimony to Congress:
“The bank’s chief investment office ‘had done so
well for so long that it was a little bit of
complacency about what was taking place there
and maybe overconfidence.’ ”
(sounds eerily like LTCM 14 years earlier)
15Neither Bad nor Dumb – Just Human:
Behavioral Aspects of Financial Decision Making
“Because we believe that we are smarter
than the average bear, we begin to believe
that we are not bears.”
John W. Payne
16Review of Key Research Results in Behavoral
Aspects of Decision Making
1. Confirmation bias.
2. Overconfidence in knowledge
3. Overconfidence in range estimates
4. Confidence usually grows more than accuracy with more
information.
5. Planning Fallacy
6. Prospect theory
7. Disposition effect
8. Regret avoidance
9. Loss aversion
10. Framing and mental accounting
11. Memory bias: overweighting recent information.
171. Confirmation Bias
With an example from the Financial
Panic of 2008/2009
18Confirmation Bias:
Perhaps the most common thinking trap
• People tend to search out information that will tend
to confirm previously held beliefs.
• In addition, people tend to misinterpret ambiguous
new information as supporting previously held
beliefs.
• The confirmation bias contributes to other biases like
overconfidence .
• “The human understanding when it has once adopted
an opinion draws all things else to support and agree
with it.” (Francis Bacon).
19Evidence for Confirmation Search
• The search for confirming Information? - Schulz-Hardt et al.,
(2000)
• Results: Mean # Items Supporting Conflicting Confirmation Bias
of Information Information Information
Individual 2.33 1.23 1.07
Group 2.65 1.11 1.54*
*The larger the majority in favor of the initially preferred
option the stronger the effect.
**The more confident a group is in the correctness of their judgment,
the stronger the effect.
7/8/2012 20We see what we expect to see
21In Buying Asset Backed Securities in Late 2007, FICO Scores
Were Stable, Showing No Sign of Credit Deterioration.
Confirmatory for Buyers at “wide spreads” late 2007
800
750
700
650
600
550
500
2001 2002 2003 2004 2005 2006 2007
Prime Alt-A Option ARMs Subprime
Source: Laurie Goodman, Amherst Securities 22Investment Banks and LTCM levered up in 1998 as prices
fell and spreads widened, then did the same in 2007.
“Buy low, sell high!”
Leverage Ratios (Assets/Equity) for Bear Stearns,
40.0 Goldman, Morgan Stanley and Lehman 1996-2007
35.0
30.0
25.0
20.0
15.0
Dec-00
Dec-01
Dec-02
Dec-07
Dec-03
Dec-04
Dec-06
Dec-97
Dec-98
Dec-99
Dec-96
Dec-05
BSC GS MS LEH
23
23But looking further at other statistics, deterioration
in credit quality standards was evident:
Percent Loans with Loan/Value >90% Increased
60
50
40
30
20
10
0
2001 2002 2003 2004 2005 2006 2007
Prime Alt-A Option ARMs Subprime
Source: Laurie Goodman, Amherst Securities
24And the Percent of Full Documentation Loans
Decreased for Nonagency Mortgage Securities.
More potential for lying about income.
80
70
60
50
40
30
20
10
0
2001 2002 2003 2004 2005 2006 2007
Prime Alt-A Option ARMs Subprime
Source: Laurie Goodman, Amherst Securities
25Percent of loans where borrowers paid interest
only (no principal) increased, showing that many
borrowers were stretching to make payments
100
90
80
70
60
50
40
30
20
10
0
2001 2002 2003 2004 2005 2006 2007
Prime Alt-A Option ARMs Subprime
Source: Laurie Goodman, Amherst Securities 26Loan Delinquencies Blasted Off
As Housing Prices Fell in 2007-2009
27Percent of Original AAA Universe
Currently Junk Rated. Stunning Percentages.
% Of The Original AAA Universe Currently Below Investment Grade
Vintage Prime Fixed Prime ARM Alt-A Fixed Alt-A ARM Option ARM Subprime
2004 3% 9% 10% 17% 50% 11%
2005 39% 58% 73% 81% 76% 53%
2006 81% 90% 96% 98% 97% 93%
2007 92% 90% 98% 96% 97% 91%
Source: BlackRock Solutions® as of Feb 8, 2010
28Lesson on Confirmation Bias in 2006-2007
• In 2006-2007, investors were looking for profitable investments, as yield
spreads over LIBOR were tight.
• New mortgage pools formed in 2006/2007 had good FICO scores that gave
confirmatory signals for purchases when spreads widened significantly in
July-December 2007. Many investors and banks levered up then.
• More data was available (LTV ratios, interest only percentages,
documentation percentages) that showed significant credit deterioration in
recent loan pools. This data was apparently not processed well then and was
largely ignored by many investors. It did not confirm what buyers and
vendors wanted to see.
• Delinquencies blasted off on the new loans as housing prices fell and the
credit vulnerabilities were exposed.
292. Overconfidence
And the Prospective Hindsight Approach to
Developing More Extreme Scenarios
30Overconfidence in Knowledge
• Overconfidence is the • “The lesson you always learn is that your
overestimation of the accuracy definition of extreme is not extreme
enough.” David Viniar, Goldman Sachs
and precision of one’s knowledge. CFO, NY Times, August 13, 2007.
• What is (are) the overconfidence • Joe Stiglitz, today at the American
effect (s)? Economic Association Meetings, talking
about financial crises: “Once-in-a-
– Confidence that an answer is hundred-years events occur every 10
correct years.” He’s thinking of the stock market
– Assessment of a confidence crash of 1987, the Long Term Capital
interval Management crisis of 1998, and the
current subprime-plus crisis — all of which
involved changes in asset prices that were
• Overconfidence is related to skill supposed to be vanishingly unlikely. Paul
Krugman, NY Times Blog, January 4, 2008
assessments, e.g., ability to
obtain alpha in investments.
Differs from optimism which is an
overestimation of the likelihood • “Overconfidence is possibly the
of good things happening to great deterrent to rational
oneself. investing.” (Jonathan Clements,
WSJ, 2/27/2001).
31Examples of Overconfidence
Physicians, after completing history and physical examination,
estimated the probability that patients had pneumonia.
1.0
0.9
% Radiographically assigned
0.8
0.7
pneumonia
0.6
0.5
0.4
0.3
0.2
0.1
0.0
0.0 0.1 0.2 0.3 0.4 0.5 0.6 0.7 0.8 0.9 1.0
Subjective Probability of Pneumonia
32Overconfidence in Range Estimates
• “Over the next year, I expect the
average S & P 500 return will be: • Graham and Harvey Study
Results:
– There is a 1-in-10 chance it will be
less than ___ % = Only 39% of CFOs’ 80%
confidence intervals
included the actual return:
– example answer = -1.8%
29.4% below and 31.5%
– Expected return: ___% = above.
– example answer = 6.4%
Soll and Klayman (2003)
– There is a 1-in-10 chance it will be Study Results:
greater than ___%” =
80% intervals were found to
– example answer = 12.2% contain the correct answer only
• Actual S & P return = 2.7% 48% of the time.
• Graham and Harvey CFO study 33The gap between confidence and accuracy grows wider with
more information available (cont.)
Tsai, Klayman, & Hastie study ,2008
Judges may not be
aware of the
cognitive limitations
that keep them
from profiting from
large amounts of
good information.
--John Payne.
Predicted versus actual proportion of correctly
chosen winners of college football games as the
number of cues increased from 6 to 30. Same
34
effect for confidence intervals (90%).We need “out of the box” thinking about risks
• “The lesson you always learn is that your definition of extreme is not extreme
enough.” David Viniar, Goldman Sachs CFO, NY Times, August 13, 2007.
• In a growing state of euphoria, “managers at financial institutions, along with
regulators including but not limited to the Federal Reserve, failed to fully
comprehend the underlying size, length, and potential impact of the so-called
negative tail of the distribution of risk outcomes that was about to be
revealed” (Alan Greenspan, 2007).
• We tend to gauge a “bad scenario” by looking at historical data . We need to
think “out of the box” to worlds and equilibria not seen, but possible. Think
of the condo building on the coasts and sunshine states (like Florida, Arizona,
Nevada) and sensitivities of the demand for those units to falls in consumers’
wealths. Real estate’s illiquidity should have helped us see that large declines
are indeed possible, even if few had been seen in existing data series.
35“Prospective Hindsight” Approach Can Help Give
More Realistic Extreme Scenarios
• Good thought experiment for managers on January 1 is:
Assume that at the end of the coming year it turned out that :
“We lost $1 billion this year. How did it happen?” Brainstorm
it. Come up with a number of scenarios where that could
happen. Goldman Sachs uses this approach (WSJ).
• Breeden did this as an owner/leader and was shocked at how
many scenarios his portfolio managers said could lead to
these extreme events. They had knowledge not realized.
• This approach can help us flesh out the “tail risk” that has led
to financial disasters for many of the firms in the headlines.
• This “Prospective hindsight approach” is described in book
Winning Decisions, by J. Edward Russo and Paul J.H.
Schoemaker, Currency Doubleday 2002, p. 112. 363. The Disposition Effect and
Prospect Theory
When large losses are in progress, many
portfolio managers let risks get large. This
can turn a bad year into a disaster.
37Disposition Effect
Research documents the tendency to sell previously purchased
stocks that have appreciated in price and the reluctance to sell those
that are trading below their purchase price. (Dhar & Zhu, 2006):
38Credit Option for Corporate Bonds and Bank Loans
Nonlinear Risks in Corporate Bonds In 2007-2009:
Betas Increase in Bad Times
Dynamic Hedgers Need to Sell More As Prices Fall
• Junk Bond Return – 10 Year Treasury Return regressed on S&P 500 Stock Return:
1989-2006 Data: -0.05 + 0.20 SP500
t=-0.3 t=4.7 RSQ=0.09
2007-2009 Data: 0.16 + 0.74 SP500
t=0.2 t=5.1 RSQ=0.45
------------------------------------------------------------------------------------------
• Baa Bond Return – 10 Year Treasury Return regressed on S&P 500 Stock Return:
1989-2006 Data: 0.02 + 0.06 SP500
t=0.3 t=3.4 RSQ=0.05
2007-2009 Data: 0.12 + 0.36 SP500
t=0.2 t=3.7 RSQ=0.31
39Prospect Theory: Value Properties:
Marginal Utility per $1 of gain diminishes as gains get larger
Marginal Utility per $1 of loss is very negative for small to moderate
losses, less so for larger losses.
• Outcome
Value • Outcomes are defined with
5
respect to reference point; world
is divided into “gains” or
4
3
2 “successes” and “losses” or
1 “failures”
v (x )
0
-20 -15 -10 -5
-1
0 5 10 15 20
• “Losses loom larger than gains”
-2
(about twice)
-3
-4
• Diminishing sensitivity away from
-5
-6
reference point
-7
-8
• Risk aversion for gains and “risk
-9
seeking” for losses. People hate
-10 to lose, but large losses are not
-11 proportionately distasteful, given
x
the fact of a meaningful loss.
4041
Lesson: Ex Post Excessive Belief In Mean Reversion
    Can Make Dynamic Option Hedges Slow To Be Executed
• As prices fall, many option risks in mortgages and corporate bonds increase and
  need more hedges. However, just at those times, it is often the case that “spreads
  are wider” too. If one assumes mean reversion of spreads, then one is very
  hesitant to put on more (short) hedges.

• Thus, strong belief in mean reversion in spreads, which most traders have, can
  inhibit execution of dynamic hedges. It takes a lot of discipline to sell as prices are
  falling.

• For example, spreads for CMBS dramatically widened from less than 100 bp over
  Treasury to 330 bp in March 2008. Many investors might well have stepped in and
  bought CMBS at that time, betting on mean reversion of the spread.

• However, that spread high was a local high, as spreads widened to 700 bp spreads
  in November 2008. Additionally, high yield bonds and CMBS downgraded to Baa
  and junk levels had spreads of 1500 to 2000 (15% to 20%) over Treasurys.

                                                                                    42
Disastrous Credit Losses & Writedowns vs. Capital Raised
(in $billion) Source: UBS, October 2008
No. Firm Loss Captial No. Firm Loss Captial
1 Wachovia 96.7 11.0 28 Natixis 5.2 7.8
2 Citigroup 68.1 74.0 29 Indymac Bancorp Inc 4.9 0.0
3 Merrill Lynch 58.1 29.9 30 Goldman Sachs Group 4.9 20.6
4 Washington Mutual 45.6 12.1 31 Lloyds TSB 4.8 14.9
5 UBS AG 44.2 32.3 32 LB Baden-Wuerttemberg 4.4 0.0
6 HSBC 27.4 5.1 33 WestLB 4.3 6.7
7 Bank of America 27.4 55.7 34 Dresdner Bank AG 3.7 0.0
8 JPMorgan Chase 20.5 44.7 35 E*Trade 3.6 2.4
9 Wells Fargo 17.7 30.8 36 BNP Paribas 3.6 4.6
10 Morgan Stanley 15.7 24.6 37 Other US Banks 3.5 1.2
11 Lehman 13.8 13.9 38 Nomura Holdings Inc. 3.3 1.7
12 IKB Deutsche 13.8 11.4 39 HSH Nordbank AG 3.3 0.0
13 Royal Bank of Scotland 13.7 57.4 40 Rabobank 3.2 0.0
14 Other European Banks 10.7 2.7 41 Bear Stearns 3.1 0.0
15 Credit Suisse 10.0 3.0 42 Bank of China Ltd 2.5 0.0
16 Deutsche Bank 9.7 5.9 43 DZ Bank 2.4 0.0
17 Fortis 8.8 21.6 44 LB Sachsen AG 2.4 1.9
18 Credit Agricole 8.3 8.0 45 Sovereign Bancorp Inc 2.3 1.6
19 Barclays Plc 7.4 29.0 46 Unicredit SpA 2.1 0.0
20 Mizuho Financial Group 6.6 0.0 47 Commerzbank AG 2.1 0.0
21 HBOS Plc 6.6 27.1 48 ABN Amro 1.9 0.0
22 Bayerische Landesbank 6.5 0.0 49 Royal Bank Of Canada 1.9 2.6
23 Canadian Imperial (CIBC) 6.4 2.5 50 Fifth Third Bancorp 1.7 1.7
24 ING Groep N.V 6.3 4.5 51 Mitsubishi UJF Financial Group 1.6 8.6
25 Societe Generale 6.2 8.8 52 Dexia SA 1.5 2.3
26 National City Corp 5.4 8.9 53 Bank Hapoalim B.M. 1.4 0.0
27 Other Asian Banks 5.4 9.1 54 Marshall & Ilsley Corp. 1.3 0.0
Worldwide 660.9 623.2 Europe 228.5 258.2
Americas 407.8 342.7 Asia 24.7 22.3
* Totals reflects figures before rounding. Some company names have been abbreviated for space.
(a) European banks whose losses are less than $1 billion each are in this group: ING Groep, Allied Irish Banks, Bradford & Bingley, Aareal Bank,
Deutsche Postbank, Lloyds TSB Group, Standard Chartered, Northern Rock, HBOS, Dexia, Commerzbank, NordLB, Rabo (b) Asian banks with 43
writedowns less than $1 billion: Mitsubishi UFJ, Shinsei, Sumitomo, Trust, Aozora Bank, DBS Group, Australia & New Zealand Banking Group, Abu
Dhabi Commercial, Bank Hapoalim, Arab Banking Corp., Fubon Financial, Industrial & Commercia (c) North American banks included in this group:4. “Memory Bias”
Too much weight given to recent history
Kahneman and Tversky (1976)
“This time is different”
Carmen Reinhart and Ken Rogoff book
The Turner report in the UK studied the 2008/2009
Financial Panic and suggested that one problem was that
the history used in the empirical analysis was insufficient,
often just 5-6 years.
44Financial Market Quotes:
• Another global financial crisis is inevitable, according
to former U.S. Federal Reserve Chairman Alan
Greenspan, because of “the unquenchable capability
of human beings when confronted with long periods
of prosperity to presume that that will continue,"
(2009, BBC).
• “Markets can remain irrational longer than you can
remain solvent.” John Maynard Keynes.
45Long Term Capital Management Performance 1994-1997
(Source: Rosenfeld MIT talk 2009)
Year Net Return Gross Dollar Profit Ending
Return ($ Billions) Capital
($Billions)
1994 20% 28% $0.4 Billion $1.6 $Billion
1995 43% 59% $1.3 Billion $3.6 $Billion
1996 41% 57% $2.1Billion $5.2 $Billion
1997 17% 25% $1.4 Billion $7.5 $Billion
46Summary of LTCM’s 1998 Losing Trades
Source: R. Lowenstein, When Genius Failed
• Russia and emerging markets: $ 430 mln
• Directional trades in Japan, dev 371
• Equity pairs (VW and Shell) 286
• Yield curve arbitrage 215
• S&P 500 stock entries 203
• Junk bond arbitrage 100
• Merger arbitrage 0
• Swaps 1,600
• Equity volatility 1,300
Total 4,500
47
47Made Complacent by Recent History at LTCM?
As the next 3 slides show, when LTCM went down in
1998, moves in option volatilities, high yield bond
spreads and swap spreads all appeared to hit extreme
levels relative to the prior 5-7 years.
However, when a longer history is displayed, none of
these moves were to levels not seen in the past 10-15
years. Some LTCM principals admit that they were
probably lulled into complacency by the low volatility
of their returns. Diversification worked better than
they had expected. But they had only operated the
hedge fund for 4 years and times had been great for
these strategies for 7 years ….
4849
50
51
However, the “verticality” of spread
  moves in 1998 was historic…

                                       52
Summary of Research on
Individual Decision Making Challenges
• Behavioral research shows that humans (even very smart
ones with high character) see (1) what they expect to see and
(2) what they want to see. This is the confirmation bias.
• Research also shows that humans are overconfident in their
abilities, and give too tight range estimates. This effect is
worse as they have more information.
• Research shows that individuals display memory bias, giving
too much weight to recent data.
• Research shows great aversion to small and moderate losses
(disposition effect) but less than proportionate aversion to
huge losses. This can lead to risky behavior once significant
losses have been sustained. These preferences are modeled
in research on “prospect theory.”
535. Group Decision Making:
Committees Often Do Not Make Great
Decisions, Though They Think They Do.
54In this financial crisis, it is a safe bet that many billions of dollars
“were lost by smart people trying to do good, honest work on
behalf of others – usually as part of a committee.”
Jason Zweig, WSJ, 2009.
A survey of investment committee members (Vanguard, 2009)
found that 80% of the respondents agreed with the statement,
“My committee seldom makes bad decisions.”
55Do groups help when it really matters in investments?
No, according to a study of 166 Investment Clubs
1991-1997 data examined by Barber and Odean, 2000
18%
16%
14%
12%
10%
8%
6%
4%
2%
0%
S&P 500 Individual Investment
Investor Club
56One Common Group Decision Making Finding:
Groups are more confident and more accurate
in range estimates, but still overconfident.
• What is the relationship between confidence in and accuracy of
judgment with groups? - Plous (1995), Sniezek (1992)
• Ten items – 90% Confidence Intervals.
Individual Group Statistical Estimated Estimated
• Results:
Individual Group
# 3.1 4.2 7.4 5.6 7.5
Correct
10
1. Groups are more confident and more accurate
2. Overconfidence is slightly reduced but still substantial
3. Statistical Pooling of Individuals much better.
4. Illusion of Group Effectiveness
57Research Shows That Groups Underestimate Project
Completion Time Even More Than Individuals Do
“The Planning Fallacy”
• Buehler et al. (2005) Individual Group Actual
Study
• Is there a bias in
estimates of the time One 45.16 42.25 59.31
needed to complete a (days)
project?
Two 1.87 1.07 2.30
• Does group discussion
(days)
affect this bias?
Most committee discussion focused on ways the task could
be accomplished efficiently. When others judged plans,
more attention given to potential impediments.
58Groug Performance =
Group Potential + Process Gains – Process Losses
Sources of Process Gains:
1) More information to be shared.
Group Process Gains 2) Diversity of Thought Strategies or
Tools.
3) Error checking of facts and
reasoning.
4) Incorporation of Different Values.
5) Canceling out of “random” errors
– Wisdom of Crowds.
Sources of Process Losses:
1) Poor and/or biased information
sharing.
2) Herding or Cascades of Opinions.
Group Process Losses 3) Reinforcement (Polarization) of
attitudes.
4) Conflict from value differences.
5) Social Loafing and Conformity.
59Suggestions on Group Composition -- 1:
The major source of group potential
• Group formation tends to be guided by the principle of similarity among
potential group members.
• It takes approximately a group membership of size 16 with an inter-judge
correlation of r =.3 to equal the accuracy of a 4 person group with an inter-
judge correlation of r = 0.
• The implication is clear, resources would be better spent on identifying
independent (less correlated) judges than our increasing the number of
judges.
• What is the “ideal” group size?
– Goals: Accuracy, commitment, value diversity, etc.
– Three, five, or more?
– Diversity of opinions– bracketing of opinions
– With diversity, truth supported wins?
60Problem 1: Getting everyone to contribute
“Lions and Mice”: Total amount of talking as a function of
speaker rank - a universal law of social behavior
Rank of the Speaker from 1 (most talkative) down … (to 8 - least talkative)
61Problem 2: Social Loafing
Example: Marketing Committee when Duke Dean
Data on Social Loafing
• Blue Ribbon committee of Sound Pressure Per Person
16 appointed produces very 5
weak, biased report. Why? 4
3
• Evidence suggests that
individuals working in 2
groups may not work as 1
hard as individuals working
alone.* 0
0 1 2 3 4 5 6 7
• Reasons for this? Group Size
– Link between effort and
*There may be cultural differences,
outcome is weak. e.g., individualistic vs. collective cultures.
– Diffused responsibility
62Problem 3: Social Conformity
The classic Asch
experiments
Test A B C
Line
Is the test line equal in length to A, B, or C?
63Results of Conformity Research
• When asked to judge • When 6 say "B" but 1 says
individually - 1% wrong "C", 6% wrong (no fear of
• When one person says "B" isolation)*
before, 3% wrong • Pre-commitment
• When two people say "B" – paper 8% wrong
before, 13 % wrong – magic pad 14% wrong
• When three people say "B",
33% wrong.
*Truth supported wins. Implications for managing
diversity in group membership?
64Suggestions for Improvement-1
Leadership Matters
• Leaders should avoid giving their opinions first.
– I have heard your views. They do not harmonize with mine. The
decision is taken unanimously. Charles de Gaulle
– If we are all in agreement on the decision - then I propose we
postpone further discussion of this matter until our next
meeting to give ourselves time to develop disagreement and
perhaps gain some understanding of what the decision is all
about. Alfred P. Sloan
• Leaders should make the value of all the members of the group
clear and balance participation.
• Leaders should monitor and manage the quality of group
processing as it unfolds over time.
65GroupThink
• Groupthink refers to a mode of thinking that persons engage
in when concurrence-seeking becomes so dominant in a
cohesive in-group that it tends to override realistic appraisal
of alternative courses of action.
• Conditions
– "The more amiability and esprit de corps there is among
the members of a policy-making in-group, the greater the
danger that independent critical thinking will be replaced
by groupthink." I. Janis
– A powerful opinionated leader
– Stress
– Lack of an explicit decision-making procedure.
66Other Failures of Deliberating Groups
• Group members ignore their private knowledge and rely instead on the
publicly stated judgments of others. Sunstein and Hastie (2008) refer to
this as a “cascade”.
– Informational cascades involve the use by one judge of another’s final
judgment without disclosure by the other of what they may know, i.e.,
the facts and reasoning underlying the judgment. This results in
poorer information sharing.
– Reputational or maintaining the good opinion of others. People want
to be perceived favorably by other group members. This is increasing
true with greater identification with the group.
• Like minded people, having deliberated with one another, become more
sure that they are right and thus more extreme in their judgments.
Corroborated views are held with greater confidence.
• Both the above “bias” and reputational cascades are likely to increase over
time as group members interact more and more together.
67Suggestions for Group Improvements - 2
• Manage information sharing as an active process, e.g.,
identify people with unique information.
• Diverse information should be surfaced relatively early in the
process.
• A thorough group process ensures that all diverse—and
conflicting—evidence that has been presented is weighed
before the decision
• Actively work against the confirmation bias.
• Encourage conflict of ideas, not conflict among people. This is
a balancing act when preferences are likely to be diverse.
68Suggestions for Improvement - 3
• Train individuals to avoid judgmental biases, do not count on
committees to correct for systematic bias in judgment.
– Herzog and Hertwig (2009), for example, suggest training people to
access different knowledge by asking them to assume their first
estimate is wrong, and then ask why. What they call “dialectical
bootstrapping.”
• Groups should agree upon and monitor “good” decision
processes, e.g., ignoring sunk costs or incorporating base-rate
information. “Error checking” on processes.
• Time spent on getting agreement on process is seldom
wasted. Group accountability for the process not just
outcomes.
69Conclusions
1. Research shows that humans make errors in decision
making, reflecting overconfidence, overweighting of recent
events, and biased searches for confirmatory data.
2. Groups have potential for improved decision making, but
often are not better, and can actually do worse than
combining information from individuals without group
interaction.
3. Risk management in financial institutions is done
ultimately by humans and groups of them. Errors likely reflect
documented biases and errors in individuals and group
decision making. These risks can be reduced with training of
individuals and groups in decision making, as well as by
careful group formation, leadership and operation.
70References
• Bailey, Jeffrey V., Jesse L. Phillips, Thomas M. Richards, “A Primer for Investment
Trustees, Commonfund Institute monograph, 2011.
• Belmont, David, “Holistic Risk Management for Endowments and Foundations,”
Commonfund, June 2012.
• Berkeleaar, Arjan B., “Risk Management for Institutional Funds,” CFA Institute,
December 2011.
• Breeden, Douglas T., “The Use and Misuse of Models in Investment Management,”
CFA Institute, December 2009.
• Breeden, Douglas T., “Complexities in Hedging Mortgages,” Journal of Fixed Income,
1994.
• Breeden, Douglas T., “Convexity and Empirical Option Costs,” Journal of Fixed
Income, 1997.
• Griswold, John S., Commonfund Institute, “New World, New Reality: Rethinking the
Governance Model for Nonprofit Investment Management, January 2011.
• Griswold, John and John Walda, “Board Fiduciary Responsibility for Endowment
Management, Commonfund presentation for NACUBO, April 23, 2012. 71References (cont.)
• Ingram, Richard T., “Ten Basic Responsibilities of Nonprofit Boards,”
BoardSource.
• Jarvis, William F., “Governance: Still At the Top of the Investment Agenda,”
Healthcare Financial Management, May 2012.
• Keeny, Ralph, John Hammond and Howard Raiffa, Smart Choices.
• MSCI Research Insight, “Turbulent Times Ahead,: Does Risk-Based Strategy
Diversification Work?” February 2012,
• Payne, John W., Investment Committee Decisions: Benefits, Pitfalls, and
Improvements,” Duke University monograph, June 2012.
• Russo, J. Edward and Paul J.H. Schoemaker, Winning Decisions,
Currency Doubleday 2002, p. 112.
• Sprow, John B., Smith Breeden Associates, “Smith Breeden Risk
Management” presentation, June 2012.
72Douglas T. Breeden Douglas T. Breeden is the William W. Priest Professor of Finance and former Dean of Duke University’s Fuqua School of Business. He is also the Fischer Black Visiting Professor of Financial Economics at the Sloan School of Management at the Massachusetts Institute of Technology for 2011- 2013 . He has served on faculties at the University of Chicago, Stanford, and North Carolina, where he was the Dalton McMichael Professor of Finance. Breeden has published well-cited research on the consumption capital asset pricing model (CCAPM), as well as on mortgage securities and hedging. His 1979 article on intertemporal portfolio theory and the CCAPM was one of the Top 10 most-cited articles in the Journal of Financial Economics in two decades. He was the Distinguished Speaker at the Western Finance Association Annual Meeting in 2005. His current research is on “Consumption as A Leading Indicator.” He was the Founding Editor and Editor for 10 years of The Journal of Fixed Income, and served as Associate Editor of The Journal of Finance, The Review of Financial Studies, The Journal of Financial and Quantitative Analysis, The Journal of Financial Economics and The Journal of Money, Credit and Banking. In 1988, he was elected to the Board of Directors of the American Finance Association and in 2010 was elected a lifetime Fellow. As Dean (2001-2007) at Duke’s Fuqua School of Business, Breeden led a large growth in faculty, distinguished professors, and the Ph.D. program, as well as construction of a new library and classroom building, now named Breeden Hall. As a teacher, Breeden won an “Outstanding Teacher” award at MIT Sloan in 2012, and was a runner- up at Duke in 2011. Breeden holds a Ph.D. in Finance from Stanford and an S.B. from M.I.T. He served on the President’s Council for MIT and on the MIT Corporation’s Visiting Committee for the Sloan School of Management. He was a member of the Stanford Business School Advisory Council. He served on the Board of Goethe Business School in Frankfurt, Germany and was an Honorary Professor at the Chinese Academy of Sciences in Beijing. Breeden is Co-founder, was Chairman from 1982-2005, and now is Senior Research Consultant of Smith Breeden Associates, a money management firm. He is Chairman of Community First Financial Group, the holding company for Harrington Bank of North Carolina. He is on the Board of Trustees of Commonfund and of the Financial Management Association. He is active in philanthropic endeavours and community development in his birthplace in Southern Indiana.
John W. Payne

John W. Payne is the Joseph J. Ruvane Professor of Business Administration at Duke
University’s Fuqua School of Business. He is also a Professor of Psychology and
Neuroscience, Professor of Law, and a Research Professor in the Institute of Statistics and
Decision Sciences at Duke University. He was Deputy Dean for Duke’s Fuqua School of
Business for six years.

Payne has a B.A. in Mathematical and Computer Models in the Social Sciences, and an M.A.
and Ph.D. in Psychology, all from the University of California, Irvine. His research deals with
how people make decisions, and how decision making might be improved. Among the
topics he has studied are risky choice behavior, task complexity and information processing
in decisions, context effects on choice, emotions and decision making, jury decision making
dealing with punitive damages, valuation of environmental resources, and consumer
financial decision making.

Payne has authored or edited four books and over 90 journal articles and book chapters.
Research awards include the Leo Melamed Prize for business research from the University of
Chicago (2000) and the first (2002) Journal of Consumer Research award for long-term
contribution to consumer research.

Payne is a Fellow of both the American Psychological Association and the American
Psychological Society and past President of the Judgment and Decision Making Society.

                                                                                                  74
You can also read