Blackstone Real Estate Income Trust - BREIT
←
→
Page content transcription
If your browser does not render page correctly, please read the page content below

PROPERT Y PROFILES
A S O F S E P T E M B E R 3 0, 2 02 1

Blackstone Real
Estate Income Trust
BREIT

Above: Shield Industrial Portfolio, San Diego, CA

This is neither an offer to sell nor a solicitation of an offer to buy the securities described herein, and must be read in conjunction with the
prospectus in order to understand fully all of the implications and risks of the offering to which this sales and advertising literature relates. A
copy of the prospectus must be made available to you in connection with this offering, and is available at www.breit.com. The selected image
of the BREIT investment above is provided for illustrative purposes only, is not representative of all BREIT investments of a given property type
and is not representative of BREIT’s entire portfolio.

F I G U R E S A S O F S E P T E M B E R 3 0, 2 0 2 1 U N L E S S O T H E R W I S E N O T E D
S U M M A R Y O F R I S K FA C T O R S A N D O T H E R I N F O R M AT I O N of the novel coronavirus, or COVID-19, has caused severe disruptions
BREIT is a non-listed REIT that invests primarily in stabilized income- in the U.S. and global economy and has had an adverse impact on our
generating commercial real estate investments across asset classes in the performance and results of operations” in BREIT’s prospectus.
United States and, to a lesser extent, real estate debt investments, with The properties referenced herein do not represent all BREIT investments.
a focus on current income. We may invest to a lesser extent in Canada The selected images featured herein are provided for illustrative purposes
and Europe and potentially elsewhere. This investment involves a high only, are not representative of all BREIT investments of a given property
degree of risk. You should purchase these securities only if you can afford type and are not representative of BREIT’s entire portfolio. It should not
the complete loss of your investment. You should read the prospectus be assumed that BREIT’s investment in the properties identified and
carefully for a description of the risks associated with an investment in discussed herein were or will be profitable. Please refer to pages 26-31 for
BREIT. These risks include, but are not limited to, the following: a complete list of investments.
There is no public trading market for our common stock and repurchase Neither the Securities and Exchange Commission (“SEC”), the Attorney
of shares by us will likely be the only way to dispose of your shares. We General of the State of New York nor any other state securities regulator
are not obligated to repurchase any shares under our share repurchase has approved or disapproved of these securities or determined if the
plan and may choose to repurchase only some, or even none, of the prospectus is truthful or complete. Any representation to the contrary is
shares that have been requested to be repurchased. In addition, a criminal offense.
repurchases will be subject to available liquidity and other significant This material makes reference to third-party data. URLs to public data
restrictions. Further, our board of directors may make exceptions to, have been provided where available. If no URL is provided, please contact
modify or suspend our share repurchase plan. As a result, our shares BREIT for a copy of such source material or a summary thereto, to the
should be considered as having only limited liquidity and at times may extent such information may be shared by BREIT. For access to the public
be illiquid. data referenced herein, please refer to the public data sources below.
We cannot guarantee that we will make distributions, and if we do we This sales material must be read in conjunction with BREIT’s prospectus in
may fund such distributions from sources other than cash flow from order to fully understand all the implications and risks of an investment in
operations, including, without limitation, the sale of or repayments BREIT. Please refer to the prospectus for more information regarding state
under our assets, borrowings or offering proceeds, and we have no suitability standards and consult a financial professional for share class
limits on the amounts we may pay from such sources. availability and appropriateness. This sales material is neither an offer to
The purchase and repurchase price for shares of our common stock are sell nor a solicitation of an offer to buy securities. An offering is made only
generally based on our prior month’s net asset value (“NAV”) and are by the prospectus, which must be made available to you in connection
not based on any public trading market. While there will be independent with this offering and is available at www.breit.com/prospectus, and a
annual appraisals of our properties, the appraisal of properties is prospectus filed with the Department of Law of the State of New York.
inherently subjective, and our NAV may not accurately reflect the Prior to making an investment, investors should read the prospectus in
actual price at which our properties could be liquidated on any given its entirety, including the “Risk Factors” section therein, which contain
day. The NAV per share, if calculated as of the date on which you make the risks and uncertainties that we believe are material to our business,
your subscription request or repurchase request, may be significantly operating results, prospects and financial condition.
different than the transaction price you pay or the repurchase price Financial information is approximate and as of September 30, 2021. The
you receive. Certain of our investments or liabilities are subject to words “we”, “us”, and “our” refer to BREIT, together with its consolidated
high levels of volatility from time to time and could change in value subsidiaries, including BREIT Operating Partnership L.P., unless the
significantly between the end of the prior month as of which our NAV context requires otherwise.
is determined and the date that you acquire or repurchase our shares,
however the prior month’s NAV per share will generally continue to be F O R WA R D - L O O K I N G S TAT E M E N T D I S C L O S U R E
used as the offering price per share and repurchase price per share. Certain information contained in this communication constitutes
We are dependent on BX REIT Advisors L.L.C. (the “Adviser”) to conduct “forward-looking statements” within the meaning of the federal securities
our operations. The Adviser will face conflicts of interest as a result of, laws and the Private Securities Litigation Reform Act of 1995. These
among other things, the allocation of investment opportunities among forward-looking statements can be identified by the use of forward-
us and Other Blackstone Accounts (as defined in BREIT’s prospectus), looking terminology, such as “outlook,” “indicator,” “believes,” “expects,”
the allocation of time of its investment professionals and the substantial “potential,” “continues,” “identified,” “may,” “will,” “should,” “seeks,”
fees that we will pay to the Adviser. “approximately,” “predicts,” “intends,” “plans,” “estimates,” “anticipates”,
On acquiring shares, you will experience immediate dilution in the net “confident,” “conviction” or the negative versions of these words or other
tangible book value of your investment. comparable words thereof. These may include our financial projections
and estimates and their underlying assumptions, statements about plans,
There are limits on the ownership and transferability of our shares. objectives and expectations with respect to future operations, statements
If we fail to qualify as a REIT and no relief provisions apply, our with respect to acquisitions, statements regarding future performance
NAV and cash available for distribution to our stockholders could and statements regarding identified but not yet closed acquisitions. Such
materially decrease. forward-looking statements are inherently uncertain and there are or
We do not own the Blackstone name, but we are permitted to use it as may be important factors that could cause actual outcomes or results to
part of our corporate name pursuant to a trademark license agreement differ materially from those indicated in such statements. BREIT believes
with an affiliate of Blackstone Inc. (together with its affiliates, these factors also include but are not limited to those described under
“Blackstone”). Use of the name by other parties or the termination of the section entitled “Risk Factors” in its prospectus and annual report for
our trademark license agreement may harm our business. the most recent fiscal year, and any such updated factors included in its
Blackstone is a leading global investment manager. The real estate periodic filings with the Securities and Exchange Commission (the “SEC”),
group of Blackstone, Blackstone Real Estate, is our sponsor and which are accessible on the SEC’s website at www.sec.gov. These factors
an affiliate of our advisor. Information regarding Blackstone and should not be construed as exhaustive and should be read in conjunction
Blackstone Real Estate is included to provide information regarding the with the other cautionary statements that are included in this document
experience of our sponsor and its affiliates. An investment in BREIT is (or BREIT’s prospectus and other filings). Except as otherwise required
not an investment in our sponsor or Blackstone as BREIT is a separate by federal securities laws, we undertake no obligation to publicly update
and distinct legal entity. or revise any forward-looking statements, whether as a result of new
information, future developments or otherwise.
Certain countries have been susceptible to epidemics which may be
designated as pandemics by world health authorities, most recently PUBLIC DATA SOURCES
COVID-19. The outbreak of such epidemics, together with any resulting Cushman & Wakefield (https://www.cushmanwakefield.com/en/
restrictions on travel or quarantines imposed, has had and will continue united-states/insights/us-articles/2020-06-amer-self-storage-mid-year-
to have a negative impact on the economy and business activity globally national-report)
(including in the countries in which BREIT invests), and thereby is expected
to adversely affect the performance of BREIT’s investments. Furthermore, IDC (https://www.idc.com/getdoc.jsp?containerId=prUS46286020)
the rapid development of epidemics could preclude prediction as to their JLL (https://www.us.jll.com/en/trends-and-insights/research/data-
ultimate adverse impact on economic and market conditions, and, as a center-outlook)
result, presents material uncertainty and risk with respect to BREIT and U.S. Census Bureau (https://www.census.gov/programs-surveys/
the performance of its investments. For further information on the impact metro-micro/data/tables.html, https://www.census.gov/retail/index.
of COVID-19 on BREIT, please refer to “Risk Factors – The current outbreak html#ecommerce)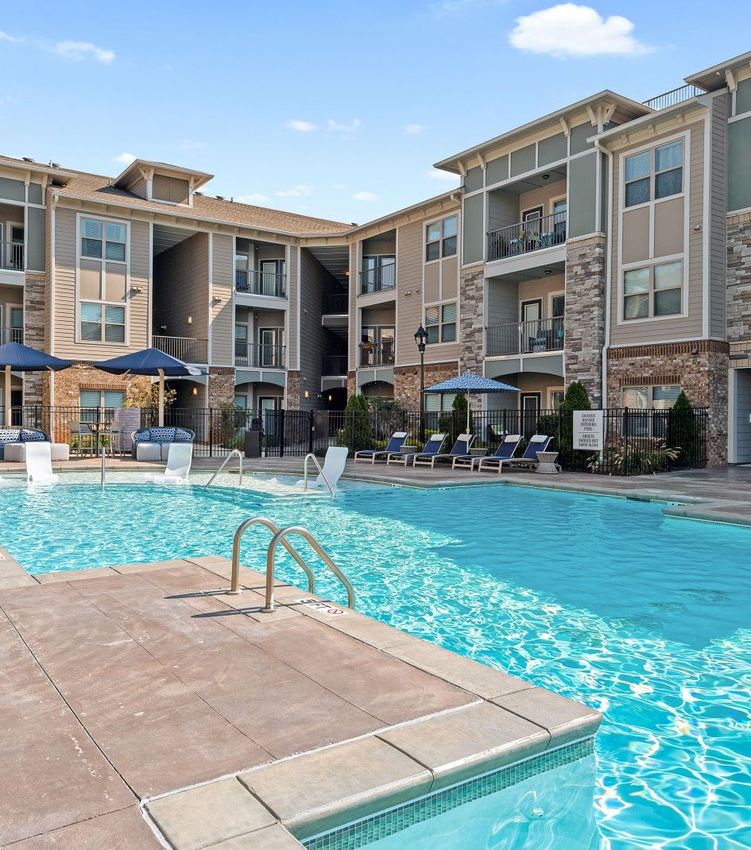
BREIT Brings Institutional
Quality Real Estate to
Income-Focused Investors
Sponsored by Blackstone Real Estate, one of the largest
real estate investment managers in the world1

$230B
Blackstone Real Estate
investor capital under management 2

702
Blackstone Real Estate
professionals globally

1.   Blackstone is a leading global investment manager. The real estate group of Blackstone, Blackstone Real Estate, is our sponsor and an affiliate of our advisor.
     Information regarding Blackstone and Blackstone Real Estate is included to provide information regarding the experience of our sponsor and its affiliates. An
     investment in BREIT is not an investment in our sponsor or Blackstone as BREIT is a separate and distinct legal entity.

2.   Investor capital includes co-investments and Blackstone’s GP and side-by-side commitments, as applicable.

The selected images of certain BREIT investments herein are provided for illustrative purposes only, are not representative of all BREIT investments of a given property
type and are not representative of BREIT’s entire portfolio.

Above: Canyon Industrial, Lehigh/Central, PA

                                                                                                                                INTRODUCTION | BREIT                 01
BREIT PORTFOLIO OVERVIEW

High conviction, thematic portfolio
concentrated in growth markets1
Portfolio Snapshot

$66B                                                              1,599                                                      95%
total asset value 2                                               properties 3                                               occupancy3

Property Type4
Residential 5                                                                                                                                           50%
Industrial                                                                                       28%
Net Lease                                             9%
Hospitality                          4%
Data Centers                        3%
Self Storage                        3%
Office                             2%
Retail                            1%

All figures as of September 30, 2021 unless otherwise noted. Additional information              vacant units) for the three months ended on the date indicated. For our single
regarding our operations is available in our annual and interim financial statements             family rental investments, the occupancy rate includes occupied homes for the
filed with the Securities and Exchange Commission. Investors should review this                  three months ended on the date indicated. For our self storage, manufactured
information in its entirety prior to making an investment decision.                              housing and senior living investments, the occupancy rate includes occupied
1.     Growth market means a market with high population growth relative to the                  square footage, occupied sites and occupied units, respectively, as of the date
       U.S. average. While BREIT generally seeks to acquire real estate properties               indicated. The average occupancy rate for our hospitality investments was
       located in growth markets, certain properties may not be located in such                  56% for the 12 months ended September 30, 2021. Hospitality investments
       markets. Although a market may be a growth market as of the date of the                   owned less than 12 months are excluded from the average occupancy
       publication of this material, demographics and trends may change and                      rate calculation.
       investors are cautioned on relying upon the data presented as there is no            4.   “Property Type” weighting is measured as the asset value of real estate
       guarantee that historical trends will continue or that BREIT could benefit from           investments for each sector category (Residential, Industrial, Net Lease,
       such trends. U.S. Census Bureau, as of July 2020, released in May 2021.                   Hospitality, Data Centers, Self Storage, Office, Retail) against the total asset
2.     Total asset value is measured as (i) the asset value of real estate investments           value of all real estate investments, excluding the value of any third party
       (based on fair value), excluding any third party interests in such real estate            interests in such real estate investments. “Real estate investments” includes
       investments, plus (ii) the equity in our real estate debt investments measured            our direct property investments, unconsolidated investments, and equity in
       at fair value (defined as the asset value of our real estate debt investments less        public and private real estate-related companies.
       the financing on such investments), but excluding any other assets (such as          5.   Residential includes multifamily and other types of rental housing such as
       cash or any other cash equivalents). The total asset value would be higher if             manufactured, student and single family rental housing, as well as senior living.
       such amounts were included and the value of our real estate debt investments         6.   BREIT invests primarily in U.S. commercial real estate, but may invest to a
       was not decreased by the financing on such investments.                                   lesser extent in countries outside of the U.S., including Canada and Europe.
3.     Reflects real estate investments only, including unconsolidated properties,               The select markets that are named represent all metropolitan statistical
       and does not include real estate debt investments. Occupancy is an important              areas (“MSAs”) in the U.S. in which BREIT has at least a 2.0% weighting.
       real estate metric because it measures the utilization of properties in the               BREIT is invested in additional MSAs which are not named above. Shading
       portfolio. Occupancy is weighted by the total value of all consolidated real              reflects the concentration of all real estate properties and unconsolidated
       estate properties, excluding our hospitality and net lease investments, and               investments in each state. “Other Markets” includes 2% of non-U.S. assets,
       any third party interests in such properties. For our industrial, data center,            including investments in Europe and Canada. Weighting is measured as the
       retail and office investments, occupancy includes all leased square footage as            asset value of real estate properties and unconsolidated investments for each
       of the date indicated. For our multifamily and student housing investments,               market against the total asset value of all (i) real estate properties, excluding
       occupancy is defined as the percentage of actual rent divided by gross                    the value of any third party interests in such real estate properties, and (ii)
       potential rent (defined as actual rent for occupied units and market rent for             unconsolidated investments.

02       BREIT | PORTFOLIO OVERVIEW
BREIT’s Top Markets6

                                                           DENVER                                  CHICAGO

                                                           3%                                      4%

                                                                                                                                               WA S H I N G TO N D.C .

                                                                                                                                               2%
L A S V EG A S

14%                                                                                                                                            C H A R LO T T E

                                                                                                                                               2%
SAN BERNARDINO

3%                                                                                                                                             AT L A N TA

                                                                                                                                               10%
PHOENIX

5%                                                                                                                                             ORLANDO

                         OT H E R
                                                                                                                                               5%
                        MARKETS
                                                                                      DA L L A S         TA M PA                               MIAMI
                        40%                                                           7%                 3%                                    2%

S TAT E C O N C E N T R AT I O N

       MORE THAN 10%                      6—10%                   2—5%               LESS THAN 2%

Please refer to page 2 for footnotes.

The selected images of certain BREIT investments herein are provided for illustrative purposes only, are not representative of all BREIT investments of a given property
type and are not representative of BREIT’s entire portfolio.

From above left: Jupiter 12 Industrial Portfolio, Dallas/Fort Worth, TX; Roman Multifamily Portfolio, Orlando, FL

                                                                                                                        PORTFOLIO OVERVIEW | BREIT                   03
Residential
High-quality residential portfolio
concentrated in the Western and
Southern U.S.

                                                                                       50%
                                                                                       share of BREIT’s
                                                                                                                                         133k
                                                                                                                                         units
                                                                                       real estate asset value

NOTE: Each map in this section represents all MSAs in the U.S. in which BREIT is invested at the sector or portfolio level, as applicable. All Snapshot metrics herein are as
      of acquisition, unless otherwise noted. Residential includes multifamily and other types of rental housing such as manufactured, student and single family rental
      housing, as well as senior living. The selected images of certain BREIT investments herein are provided for illustrative purposes only, are not representative of
      all BREIT investments of a given property type and are not representative of BREIT’s entire portfolio. For a complete list of properties please see pages 26-31.

04      BREIT | RESIDENTIAL                                                                                          Above: Gilbert Heritage Multifamily, Phoenix, AZ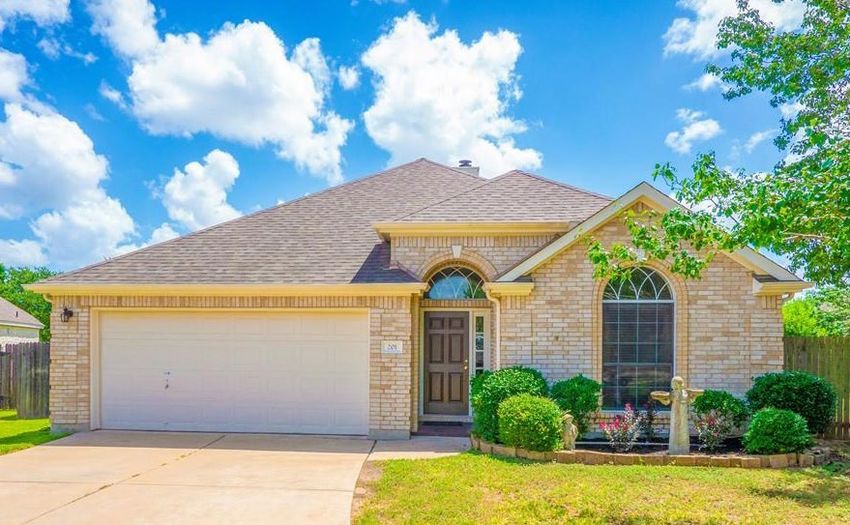
Home Partners of America

Investment Highlights                                                    Snapshot

Home Partners of America (“HPA”) is a leading private                    July 2021    acquisition date
owner / operator of single family rental (“SFR”)
homes in the U.S. with a strong management team and                      $5.9B   purchase price 2

robust operations                                                        18,809   homes

High-quality portfolio of SFR homes located across the U.S.
and concentrated in growth markets1

HPA represents BREIT’s first direct investment in the
SFR sector

1.   U.S. Census Bureau, as of July 2020, released in May 2021. Growth
     market means a market with high population growth relative to the
     U.S. average.
2.   BREIT ownership at acquisition comprised of three entities with
     ownership interests of 100%, 28% and 12%.
Clockwise from above left: Atlanta, GA; Austin, TX; Houston, TX

                                                                                                    BREIT | RESIDENTIAL   05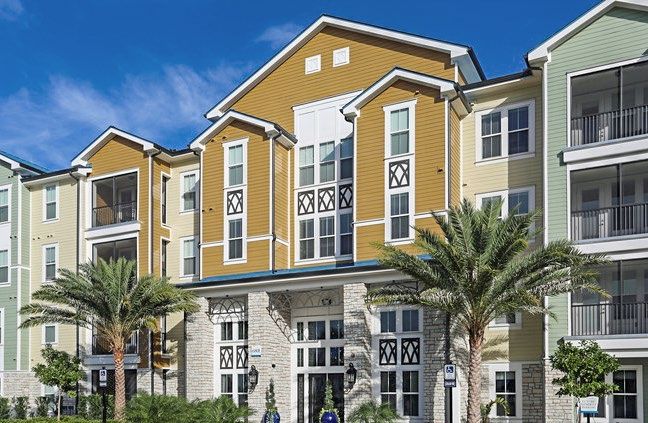
Acorn 2.0 Multifamily Portfolio

Investment Highlights                                                             Snapshot1

Off-market acquisition of a portfolio of high-quality                             May 2021           acquisition date 2
apartment communities concentrated in Atlanta, Austin,
Charlotte, Phoenix and Tampa                                                      $1.7B     purchase price at share 3

                                                                                  17   assets across U.S.

Well-located properties in submarkets near employment                             6,689      units
centers and in close proximity to major highways
and interstates

Recently renovated properties with high-quality interior
finishes that are highly amenitized with resort-style pools,
fitness centers, clubhouses and pet parks

1.   As of September 30, 2021, BREIT acquired 17 of the 18 properties in the
     portfolio. The final asset was acquired in October 2021. Snapshot reflects
     closed assets as of quarter end.
2.   BREIT acquired the properties between May and October 2021.
3.   BREIT ownership interest at acquisition: 98%.
Clockwise from above left: Charlotte, NC; Austin, TX; Phoenix, AZ

06     RESIDENTIAL | BREIT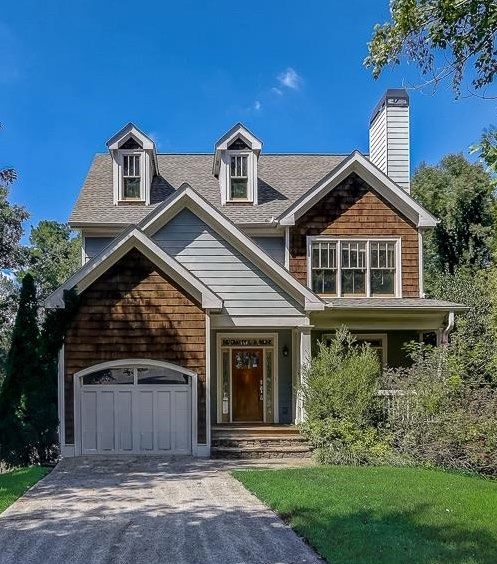
Acorn Multifamily Portfolio

Investment Highlights                                               Snapshot

Off-market acquisition of a portfolio of high-quality               February 2020              acquisition date1
apartment communities concentrated in Atlanta, Columbus,
Dallas, Orlando, Raleigh and Tampa                                  $1.5B     purchase price at share 2

                                                                    21   assets across U.S.

Well-located properties in submarkets near employment               8,309      units
centers and in close proximity to major highways and
interstates

Recently renovated properties with high-quality interior
finishes that are highly amenitized with resort-style pools,
fitness centers, clubhouses and pet parks

1.   BREIT acquired the properties between February and May 2020.
2.   BREIT ownership interest at acquisition: 98%.
Clockwise from above left: Mooresville, NC; St. Petersburg, FL;
Carrollton, TX

                                                                                                 RESIDENTIAL | BREIT   07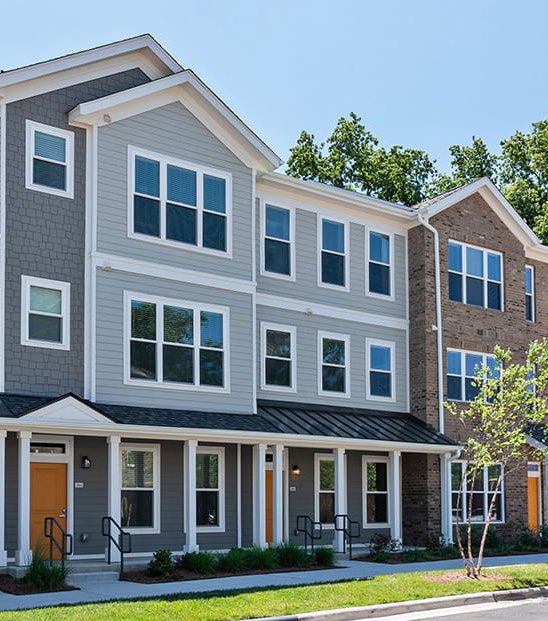
Industrial
Strong e-commerce tailwinds propelling
industrial demand1

                                                                                    28%
                                                                                    share of BREIT’s
                                                                                                                                    162M
                                                                                                                                    s q uare fe e t
                                                                                    real estate asset value

NOTE: Each map in this section represents all MSAs in the U.S. in which BREIT is invested at the sector or portfolio level, as applicable. All Snapshot metrics herein
      are as of acquisition, unless otherwise noted. The selected images of certain BREIT investments herein are provided for illustrative purposes only, are not
      representative of all BREIT investments of a given property type and are not representative of BREIT’s entire portfolio. For a complete list of properties please
      see pages 26-31.

1.   U.S. Census Bureau, as of September 30, 2021.

08      BREIT | INDUSTRIAL                                                                              Above: Jupiter 12 Industrial Portfolio, San Bernardino, CA
Jupiter 12 Industrial Portfolio
Investment Highlights Snapshot
BREIT’s strategic acquisition of high-quality U.S. industrial
assets in one of Blackstone Real Estate’s highest conviction
September 2019 acquisition date
investment themes $5.3B purchase price
Portfolio of predominately Class A distribution buildings and infill 315 assets across U.S.
small-bay warehouses
64M square feet
Part of Blackstone Real Estate’s $18.7 billion investment, the
largest private real estate transaction in history
Primarily concentrated in infill locations in major distribution
markets including Atlanta, Chicago, Cincinnati, Dallas, Harrisburg
and Orlando
Top five tenants include Amazon, Lowe’s, Starbucks, the U.S.
Government and Whirlpool, which represent 22% of the total
square feet. Portfolio has a four-year weighted average lease length
(“WALL”) with no more than 19% of square footage expiring in a
single year1
1. The portfolio is occupied by over 800 tenants. Tenants listed herein
have a seven-year WALL.
Clockwise from above left: Desoto, TX; Orlando, FL; Joliet, IL
INDUSTRIAL | BREIT 09Canyon Industrial Portfolio
Investment Highlights Snapshot
Portfolio of predominately Class A distribution buildings March 2018 acquisition date
and infill small-bay warehouses
$1.8B purchase price
Concentrated in Chicago, Dallas, Indianapolis, Los Angeles 146 assets across U.S.
and New York and located near densely populated areas 21M square feet
and airports
Top tenants include Amazon, DHL, FedEx and Lowe’s.
Portfolio has a four-year WALL with no more than 18% of
square footage expiring in a single year1
1. The portfolio is occupied by over 300 tenants. Tenants listed herein
represent 14% of the property’s total square feet, have a three-year
WALL and are among the top 10 largest tenants across the portfolio.
Above: Chicago, IL
10 BREIT | INDUSTRIALMeridian Industrial Portfolio
Investment Highlights Snapshot
Portfolio of predominately Class A distribution buildings November 2018 acquisition date
and infill small-bay warehouses
$943M purchase price at share 2
Concentrated in markets across the Southeast, including 106 assets across U.S.
Atlanta, Jacksonville, Memphis, Miami and Orlando 14M square feet
Top tenants include Electrolux Home Products, Home
Depot, Quanta Computer and Walt Disney. Portfolio has a
three-year WALL1
1. The portfolio is occupied by over 250 tenants. Tenants listed herein
represent 11% of the property’s total square feet, have a four-year
WALL and are among the top 20 largest tenants across the portfolio.
2. BREIT ownership interest at acquisition: 99%.
Clockwise from above left: Orlando, FL; Winston Salem, NC; Nashville, TN
INDUSTRIAL | BREIT 11Net Lease
Stable long-term income
with built-in annual rent growth
9%
share of BREIT’s
3
properties
real estate asset value
NOTE: Each map in this section represents all MSAs in the U.S. in which BREIT is invested at the sector or portfolio level, as applicable. All Snapshot metrics herein
are as of acquisition, unless otherwise noted. The selected images of certain BREIT investments herein are provided for illustrative purposes only, are not
representative of all BREIT investments of a given property type and are not representative of BREIT’s entire portfolio. For a complete list of properties please
see pages 26-31.
12 BREIT | NET LEASE Above: Bellagio, Las Vegas, NVBellagio Net Lease
Investment Highlights Snapshot
The Bellagio is a high-quality resort located on 77 acres at the November 2019 acquisition date
center of the Las Vegas Strip. The property is well-amenitized
with 155k square feet of gaming space, 85k square feet of retail $4.0B purchase price at share1
and 29 food & beverage outlets Las Vegas, NV location
9M square feet
BREIT acquired the property from MGM Resorts International
(“MGM”) in a 95%/5% joint venture with MGM
MGM leased back the property for 30 years with two 10-year
extension options with built-in contractual annual rent growth
MGM provided a full corporate guaranty for all rent payments
and continues to manage, operate and be responsible for all
aspects of the property on a day-to-day basis
1. BREIT ownership interest at acquisition: 95%
Above: Las Vegas, NV
NET LEASE | BREIT 13MGM Grand and Mandalay Bay Net Lease Investment Highlights Snapshot The MGM Grand and Mandalay Bay are high-quality February 2020 acquisition date resorts located on the Las Vegas Strip. The properties are well-amenitized with 300k square feet of gaming space and $2.3B purchase price at share1 3M square feet of meeting space across 226 acres Las Vegas, NV location BREIT acquired the MGM Grand and the Mandalay Bay in 16M square feet a 49.9%/50.1% joint venture with MGM Growth Properties MGM leased back the properties for 30 years with two 10-year extension options with built-in contractual annual rent growth MGM provided a full corporate guaranty for all rent payments and continues to manage, operate and be responsible for all aspects of the properties on a day‑to‑day basis 1. BREIT ownership interest at acquisition: 49.9%. Above: Las Vegas, NV 14 BREIT | NET LEASE
Hospitality
High-quality hotels
with strong brands

                                                                                    4%
                                                                                    share of BREIT’s
                                                                                                                                       10k
                                                                                                                                       keys
                                                                                    real estate asset value

NOTE: Each map in this section represents all MSAs in the U.S. in which BREIT is invested at the sector or portfolio level, as applicable. All Snapshot metrics herein
      are as of acquisition, unless otherwise noted. The selected images of certain BREIT investments herein are provided for illustrative purposes only, are not
      representative of all BREIT investments of a given property type and are not representative of BREIT’s entire portfolio. For a complete list of properties please
      see pages 26-31.

15      B R E I T | H O S P I TA L I T Y                                                                        Above: Raven Select Service Portfolio, Austin, TX
JW Marriott San Antonio
Hill Country Resort & Spa
Investment Highlights Snapshot
High-quality resort on 622 acres in San Antonio’s August 2018 acquisition date
Hill Country
$616M purchase price
Well-located destination within driving distance of San Antonio, TX location
San Antonio and Austin 1,002 keys
Recently built in 2010, renovated in 2018 and
well-amenitized with over 200k square feet of meeting
space, two PGA golf courses, water park, spa and eight
food & beverage outlets
Above: San Antonio, TX
H O S P I TA L I T Y | B R E I T 16Hyatt Regency Atlanta
Investment Highlights Snapshot
High-quality, group-oriented hotel located in the heart of September 2019 acquisition date
downtown Atlanta within walking distance of the city’s
football stadium, convention center and top attractions $355M purchase price
Atlanta, GA location
Well-amenitized with 180k square feet of meeting space, 1,260 keys
a seasonal outdoor pool, four food & beverage outlets and
indoor access to the train station and convention center
Atlanta ranks 10th among the largest metropolitan
economies in the U.S.1
1. U.S. Census Bureau, as of July 2020, released in May 2021.
Above: Atlanta, GA
17 B R E I T | H O S P I TA L I T YData Centers
Surging growth in data
driving demand for data centers1
3%
share of BREIT’s
10M
square feet
real estate asset value
NOTE: Each map in this section represents all MSAs in the U.S. in which BREIT is invested at the sector or portfolio level, as applicable. All Snapshot metrics herein
are as of acquisition, unless otherwise noted. The selected images of certain BREIT investments herein are provided for illustrative purposes only, are not
representative of all BREIT investments of a given property type and are not representative of BREIT’s entire portfolio. For a complete list of properties please
see pages 26-31.
1. JLL, H1 2021 Data Center Outlook and IDC, Global DataSphere Forecast.
18 B R E I T | D ATA C E N T E R S Above: QTS Data Centers, Sterling, VAQTS Data Centers
Investment Highlights Snapshot
Acquisition of one of the largest U.S. portfolios of mission August 2021 acquisition date
critical data centers located in top tier data center markets
$3.2B purchase price at share1
Concentrated in Atlanta, Dallas and Northern Virginia 48 assets across U.S. and Europe 2
8M square feet
Tenants are primarily investment grade global technology,
media and financial services companies
QTS is a high-quality platform with a talented and
experienced management team
1. BREIT and other Blackstone co-investment and supplemental
vehicles participated in this transaction. BREIT ownership interest at
acquisition: 33%.
2. Includes 27 data centers in the U.S., two data centers in Europe and
19 land and development sites in the U.S.
Clockwise from above left: Atlanta, GA; Suwanee, GA; Piscataway, NJ
D ATA C E N T E R S | B R E I T 19Self Storage
Historically resilient sector with
limited capital expenditures
3%
share of BREIT’s
11M
square feet
real estate asset value
NOTE: Each map in this section represents all MSAs in the U.S. in which BREIT is invested at the sector or portfolio level, as applicable. All Snapshot metrics herein
are as of acquisition, unless otherwise noted. The selected images of certain BREIT investments herein are provided for illustrative purposes only, are not
representative of all BREIT investments of a given property type and are not representative of BREIT’s entire portfolio. For a complete list of properties please
see pages 26-31.
20 BREIT | SELF STOR AGE Above: Simply Self Storage, Orange, CASimply Self Storage
Investment Highlights Snapshot
High-quality self storage portfolio located across the U.S. December 2020 acquisition date
and concentrated in Chicago, Detroit, Memphis, New York,
Oklahoma City, Orlando, Seattle and Tampa $1.2B purchase price
102 assets across U.S.
Fully integrated self storage platform with significant 8M square feet
potential for growth through future acquisitions in a highly
fragmented sector
Following this acquisition, BREIT became the third largest
non-listed owner of storage in the U.S.1
1. At acquisition, December 2020. Includes private owners and
non‑listed REITs.
Clockwise from above left: Woodbury, MN; Seattle, WA; Cypress, CA
SELF STOR AGE | BREIT 21Office
High-quality office properties
in innovation-focused markets
2%
share of BREIT’s
1M
square feet
real estate asset value
NOTE: Each map in this section represents all MSAs in the U.S. in which BREIT is invested at the sector or portfolio level, as applicable. All Snapshot metrics herein
are as of acquisition, unless otherwise noted. The selected images of certain BREIT investments herein are provided for illustrative purposes only, are not
representative of all BREIT investments of a given property type and are not representative of BREIT’s entire portfolio. For a complete list of properties please
see pages 26-31.
22 BREIT | OFFICE Above: Coleman Highline Office, San Jose, CAColeman Highline Office
Investment Highlights Snapshot
Class A office campus located in San Jose, CA which is October 2020 acquisition date
100% leased to Roku with a 10-year lease term as part of its
global headquarters. Roku is one of the leading streaming $275M purchase price
media platforms in the U.S.1 San Jose, CA location
357,000 square feet
Constructed in 2017 to the highest physical standards
containing unique features including elevated outdoor
terraces, floor-to-ceiling glass windows and large 32k
square foot floorplates
Well-located campus within the transit-oriented Silicon
Valley market with the Santa Clara CalTrain station within
walking distance
1. As of May 2020. Roku. Based on hours streamed. 10-year lease term at
acquisition, October 2020.
Above: San Jose, CA
OFFICE | BREIT 23Retail
Primarily grocery-anchored shopping centers
in high-density locations with strong demographics
and limited new supply
1%
share of BREIT’s
2M
square feet
real estate asset value
NOTE: Each map in this section represents all MSAs in the U.S. in which BREIT is invested at the sector or portfolio level, as applicable. All Snapshot metrics herein
are as of acquisition, unless otherwise noted. The selected images of certain BREIT investments herein are provided for illustrative purposes only, are not
representative of all BREIT investments of a given property type and are not representative of BREIT’s entire portfolio. For a complete list of properties please
see pages 26-31.
24 B R E I T | R E TA I L Above: SoCal Grocery Portfolio, Mission Viejo, CASoCal Grocery Portfolio
Investment Highlights Snapshot
Six grocery-anchored shopping centers located in January 2020 acquisition date
densely populated and affluent submarkets across
Orange County, CA $292M purchase price
Orange County, CA location
Properties are anchored by high-performing supermarkets 689,000 square feet
and feature a variety of other necessity-based tenants1
Portfolio has a five-year WALL and five of the six assets
were renovated in 2019
1. The portfolio is occupied by 171 tenants. The anchor tenants
referenced above represent 41% of the portfolio’s total square feet and
have a seven-year WALL.
Clockwise from above left: Lake Forest, CA; Huntington Beach, CA;
Mission Viejo, CA
R E TA I L | B R E I T 25BREIT Real Estate Property Holdings
NUMBER OF OWNERSHIP OCCUPANCY
SEGMENT AND INVESTMENT PROPERTIES1 LOCATION ACQUISITION DATE INTEREST2 UNITS1 RATE3
RESIDENTIAL
TA Multifamily Portfolio 6 Various Apr 2017 100% 2,514 units 93%
Emory Point 1 Atlanta, GA May 2017 100% 750 units 96%
Nevada West Multifamily 3 Las Vegas, NV May 2017 100% 972 units 95%
Mountain Gate & Trails Multifamily 2 Las Vegas, NV Jun 2017 100% 539 units 95%
Elysian West Multifamily 1 Las Vegas, NV Jul 2017 100% 466 units 96%
Gilbert Multifamily 2 Gilbert, AZ Sep 2017 90% 748 units 96%
Domain & GreenVue Multifamily 2 Dallas, TX Sep 2017 100% 803 units 97%
ACG II Multifamily 4 Various Sep 2017 94% 932 units 95%
Olympus Multifamily 3 Jacksonville, FL Nov 2017 95% 1,032 units 94%
Amberglen West Multifamily 1 Hillsboro, OR Nov 2017 100% 396 units 95%
Aston Multifamily Portfolio 18 Various Various 100% 3,991 units 95%
Talavera and Flamingo Multifamily 2 Las Vegas, NV Dec 2017 100% 674 units 96%
Walden Pond & Montair Multifamily Portfolio 2 Everett, WA & Thornton, CO Dec 2017 95% 636 units 97%
Signature at Kendall Multifamily 1 Miami, FL Dec 2017 100% 546 units 95%
The Boulevard 1 Phoenix, AZ Apr 2018 100% 294 units 95%
Blue Hills Multifamily 1 Boston, MA May 2018 100% 472 units 93%
Wave Multifamily Portfolio 6 Various May 2018 100% 2,199 units 97%
ACG III Multifamily 2 Gresham, OR & Turlock, CA May 2018 95% 475 units 97%
Carroll Florida Multifamily 2 Jacksonville & Orlando, FL May 2018 100% 716 units 94%
Solis at Flamingo 1 Las Vegas, NV Jun 2018 95% 524 units 98%
Velaire at Aspera 1 Phoenix, AZ Jul 2018 100% 286 units 95%
Coyote Multifamily Portfolio 6 Phoenix, AZ Aug 2018 100% 1,752 units 96%
Avanti Apartments 1 Las Vegas, NV Dec 2018 100% 414 units 95%
Gilbert Heritage Apartments 1 Phoenix, AZ Feb 2019 90% 256 units 97%
Roman Multifamily Portfolio 14 Various Feb 2019 100% 3,743 units 96%
Elevation Plaza Del Rio 1 Phoenix, AZ Apr 2019 90% 333 units 97%
Courtney at Universal Multifamily 1 Orlando, FL Apr 2019 100% 355 units 93%
Citymark Multifamily 2-Pack 2 Las Vegas, NV & Lithia Springs, GA Apr 2019 95% 608 units 95%
Tri-Cities Multifamily 2-Pack 2 Richland & Kennewick, WA Apr 2019 95% 428 units 97%
Raider Multifamily Portfolio 4 Las Vegas, NV Various 100% 1,514 units 96%
Bridge II Multifamily Portfolio 6 Various Various 100% 2,363 units 94%
Miami Doral 2-Pack 2 Miami, FL May 2019 100% 720 units 94%
Davis Multifamily 2-Pack 2 Raleigh, NC & Jacksonville, FL May 2019 100% 454 units 95%
Slate Savannah 1 Savannah, GA May 2019 90% 272 units 96%
Amara at MetroWest 1 Orlando, FL May 2019 95% 411 units 94%
Colorado 3-Pack 3 Denver & Fort Collins, CO May 2019 100% 855 units 93%
NOTE: As of September 30, 2021. Past performance does not guarantee future results. Actual results may vary. Diversification does not assure a
profit or protect against a loss in a declining market. Please refer to the endnotes on page 32.
26 B R E I T | R E A L E S TAT E P R O P E R T Y H O L D I N G SBREIT Real Estate Property Holdings (Cont’d)
NUMBER OF OWNERSHIP OCCUPANCY
SEGMENT AND INVESTMENT PROPERTIES1 LOCATION ACQUISITION DATE INTEREST2 UNITS1 RATE3
RESIDENTIAL (CONT’D)
Edge Las Vegas 1 Las Vegas, NV Jun 2019 95% 296 units 96%
ACG IV Multifamily 2 Woodland, CA & Puyallup, WA Jun 2019 95% 606 units 96%
Perimeter Multifamily 3-Pack 3 Atlanta, GA Jun 2019 100% 691 units 95%
Anson at the Lakes 1 Charlotte, NC Jun 2019 100% 694 units 95%
San Valiente Multifamily 1 Phoenix, AZ Jul 2019 95% 604 units 97%
Edgewater at the Cove 1 Oregon City, OR Aug 2019 100% 244 units 93%
Haven 124 Multifamily 1 Denver, CO Sep 2019 100% 562 units 92%
Villages at McCullers Walk Multifamily 1 Raleigh, NC Oct 2019 100% 412 units 95%
Canopy at Citrus Park Multifamily 1 Largo, FL Oct 2019 90% 318 units 94%
Ridge Multifamily Portfolio 4 Las Vegas, NV Oct 2019 90% 1,220 units 94%
Charleston on 66th Multifamily 1 Tampa, FL Nov 2019 95% 258 units 94%
Evolve at Timber Creek Multifamily 1 Garner, NC Nov 2019 100% 304 units 97%
Solis at Towne Center Multifamily 1 Glendale, AZ Nov 2019 100% 240 units 97%
Arches at Hidden Creek Multifamily 1 Chandler, AZ Nov 2019 98% 432 units 93%
Terra Multifamily 1 Austin, TX Dec 2019 100% 372 units 95%
Arium Multifamily Portfolio 5 Various Dec 2019 100% 1,684 units 93%
Easton Gardens Multifamily 1 Columbus, OH Feb 2020 95% 1,064 units 94%
Acorn Multifamily Portfolio 21 Various Feb & May 2020 98% 8,309 units 95%
Indigo West Multifamily 1 Orlando, FL Mar 2020 100% 456 units 92%
The Sixes Multifamily 1 Holly Springs, GA Sep 2020 100% 340 units 98%
Park & Market Multifamily 1 Raleigh, NC Oct 2020 100% 409 units 95%
Cortland Lex Multifamily 1 Alpharetta, GA Oct 2020 100% 360 units 98%
The Palmer Multifamily 1 Charlotte, NC Oct 2020 90% 318 units 95%
Grizzly Multifamily Portfolio 2 Atlanta, GA & Nashville, TN Oct & Nov 2020 100% 767 units 93%
Jaguar Multifamily Portfolio 11 Various Nov & Dec 2020 100% 3,788 units 94%
Kansas City Multifamily Portfolio 2 Overland Park & Olathe, KS Dec 2020 100% 620 units 93%
The View at Woodstock Multifamily 1 Woodstock, GA Jan 2021 100% 320 units 97%
Southeast Multifamily Portfolio 2 Lebanon, TN & Sanford, FL Feb 2021 98% 330 units 93%
Cortona South Tampa Multifamily 1 Tampa, FL Apr 2021 100% 300 units 95%
Crest at Park Central Multifamily 1 Dallas, TX Apr 2021 100% 387 units 97%
Archer & Rosery Multifamily Portfolio 2 Acworth, GA & Largo, FL Apr & May 2021 100% 539 units 91%
Encore Tessera Multifamily 1 Phoenix, Arizona May 2021 80% 240 units 94%
Acorn 2.0 Multifamily Portfolio 17 Various Various 98% 6,689 units 84%
Vue at Centennial Multifamily 1 Las Vegas, NV Jun 2021 100% 372 units 96%
Charlotte Multifamily Portfolio 3 Various Jun & Aug 2021 100% 876 units 84%
Haven by Watermark Multifamily 1 Denver, CO Jun 2021 100% 206 units 98%
NOTE: As of September 30, 2021. Past performance does not guarantee future results. Actual results may vary. Diversification does not assure a
profit or protect against a loss in a declining market. Please refer to the endnotes on page 32.
R E A L E S TAT E P R O P E R T Y H O L D I N G S | B R E I T 27BREIT Real Estate Property Holdings (Cont’d)
NUMBER OF OWNERSHIP OCCUPANCY
SEGMENT AND INVESTMENT PROPERTIES1 LOCATION ACQUISITION DATE INTEREST2 UNITS1 RATE3
RESIDENTIAL (CONT’D)
Home Partners of America4 N/A1 Various Jul 2021 Various4 20,940 units 98%
Quebec Independent Living Portfolio 10 Quebec, Canada Aug 2021 95% 2,877 units 80%
Legacy North Multifamily 1 Plano, TX Aug 2021 100% 1,675 units 97%
The Brooke Multifamily 1 Atlanta, GA Aug 2021 100% 537 units 93%
One Boynton Multifamily 1 Boynton Beach, FL Aug 2021 100% 494 units 96%
Falcon Landing Multifamily 1 Katy, TX Aug 2021 90% 386 units 92%
Town Lantana Multifamily 1 Lantana, FL Sep 2021 90% 360 units 96%
Ring Multifamily Portfolio 12 Various Sep 2021 100% 3,030 units 95%
Highroads MH 3 Phoenix, AZ Apr 2018 99% 265 units 96%
Evergreen Minari MH 2 Phoenix, AZ Jun 2018 99% 115 units 96%
Southwest MH 12 Various Jun 2018 99% 2,568 units 89%
Hidden Springs MH 1 Desert Hot Springs, CA Jul 2018 99% 317 units 98%
SVPAC MH 2 Phoenix, AZ Jul 2018 99% 233 units 98%
Riverest MH 1 Tavares, FL Dec 2018 99% 130 units 93%
Angler MH Portfolio 4 Phoenix, AZ Apr 2019 99% 770 units 92%
Florida MH 4-Pack 4 Various Apr & Jul 2019 99% 799 units 90%
Impala MH 3 Phoenix & Chandler, AZ Jul 2019 99% 333 units 98%
Clearwater MHC 2-Pack 2 Clearwater, FL Mar & Aug 2020 99% 207 units 98%
Legacy MH Portfolio 7 Various Apr 2020 99% 1,896 units 92%
May Manor MH 1 Lakeland, FL Jun 2020 99% 297 units 82%
Royal Oaks MH 1 Petaluma, CA Nov 2020 99% 94 units 99%
Southeast MH Portfolio 37 Various Dec 2020 99% 7,814 units 86%
Redwood Village MH 1 Santa Rose, CA Jul 2021 99% 67 units 100%
EdR Student Housing Portfolio 20 Various Sep 2018 95% 10,610 units 94%
Mercury 3100 Student Housing 1 Orlando, FL Feb 2021 100% 228 units 98%
Signal Student Housing Portfolio 8 Various Aug 2021 96% 5,416 units 92%
TOTAL RESIDENTIAL 344 132,528 units
NOTE: As of September 30, 2021. Past performance does not guarantee future results. Actual results may vary. Diversification does not assure a
profit or protect against a loss in a declining market. Please refer to the endnotes on page 32.
28 B R E I T | R E A L E S TAT E P R O P E R T Y H O L D I N G SBREIT Real Estate Property Holdings (Cont’d)
NUMBER OF OWNERSHIP SQ. FT. OCCUPANCY
SEGMENT AND INVESTMENT PROPERTIES LOCATION ACQUISITION DATE INTEREST2 (IN THOUSANDS) RATE3
INDUSTRIAL
Stockton Industrial Park 1 Stockton, CA Feb 2017 100% 878 sq. ft. 100%
HS Industrial Portfolio 36 Various Apr 2017 100% 5,838 sq. ft. 100%
Fairfield Industrial Portfolio 11 Fairfield, NJ Sep 2017 100% 578 sq. ft. 99%
Southeast Industrial Portfolio 5 Various Nov 2017 100% 1,927 sq. ft. 100%
Kraft Chicago Industrial Portfolio 3 Aurora, IL Jan 2018 100% 1,693 sq. ft. 100%
Canyon Industrial Portfolio 145 Various Mar 2018 100% 20,954 sq. ft. 97%
HP Cold Storage Industrial Portfolio 6 Various May 2018 100% 2,259 sq. ft. 100%
Meridian Industrial Portfolio 106 Various Nov 2018 99% 14,014 sq. ft. 96%
Stockton Distribution Center 1 Stockton, CA Dec 2018 100% 987 sq. ft. 100%
Summit Industrial Portfolio 8 Atlanta, GA Dec 2018 100% 631 sq. ft. 93%
4500 Westport Drive 1 Harrisburg, PA Jan 2019 100% 179 sq. ft. 100%
Morgan Savannah 1 Savannah, GA Apr 2019 100% 357 sq. ft. 100%
Minneapolis Industrial Portfolio 34 Minneapolis, MN Apr 2019 100% 2,459 sq. ft. 98%
Atlanta Industrial Portfolio 61 Atlanta, GA May 2019 100% 3,779 sq. ft. 91%
Patriot Park Industrial Portfolio 2 Durham, NC Sep 2019 100% 323 sq. ft. 100%
Denali Industrial Portfolio 18 Various Sep 2019 100% 4,098 sq. ft. 97%
Jupiter 12 Industrial Portfolio 315 Various Sep 2019 100% 63,979 sq. ft. 96%
2201 Main Street 1 San Diego, CA Oct 2019 100% 260 sq. ft. N/A
Triangle Industrial Portfolio 37 Greensboro, NC Jan 2020 100% 2,783 sq. ft. 95%
Midwest Industrial Portfolio 27 Various Feb 2020 100% 5,940 sq. ft. 97%
Pancal Industrial Portfolio 12 Various Feb & Apr 2020 100% 2,109 sq. ft. 99%
Grainger Distribution Center 1 Jacksonville, FL Mar 2020 100% 297 sq. ft. 100%
Diamond Industrial 1 Rico Rivera, CA Aug 2020 100% 243 sq. ft. 100%
Inland Empire Industrial Portfolio 2 Etiwanda & Fontana, CA Sep 2020 100% 404 sq. ft. 100%
Shield Industrial Portfolio 13 Various Dec 2020 100% 2,079 sq. ft. 100%
7520 Georgetown Industrial 1 Indianapolis, IN Dec 2020 100% 425 sq. ft. 100%
WC Infill Industrial Portfolio5 19 Various Jan & Aug 2021 85% 2,926 sq. ft. 99%
Vault Industrial Portfolio5 35 Various Jan 2021 41% 6,586 sq. ft. 99%
Chicago Infill Industrial Portfolio 7 Various Feb 2021 100% 1,058 sq. ft. 100%
Greensboro Industrial Portfolio 19 Various Apr 2021 100% 2,068 sq. ft. 96%
NW Corporate Center 3 El Paso, TX Jul 2021 100% 692 sq. ft. 100%
I-85 Southeast Industrial Portfolio 4 Various Jul & Aug 2021 100% 739 sq. ft. 100%
Alaska Industrial Portfolio 5
26 Various UK Jul 2021 26.7% 8,057 sq. ft. 100%
Stephanie Industrial Portfolio 2 Henderson, NV Sep 2021 100% 338 sq. ft. 23%
Capstone Industrial Portfolio 2 Brooklyn Park, MN Sep 2021 100% 219 sq. ft. 86%
TOTAL INDUSTRIAL 966 162,156 sq. ft.
NOTE: As of September 30, 2021. Past performance does not guarantee future results. Actual results may vary. Diversification does not assure a
profit or protect against a loss in a declining market. Please refer to the endnotes on page 32.
R E A L E S TAT E P R O P E R T Y H O L D I N G S | B R E I T 29BREIT Real Estate Property Holdings (Cont’d)
NUMBER OF OWNERSHIP SQ. FT. OCCUPANCY
SEGMENT AND INVESTMENT PROPERTIES LOCATION ACQUISITION DATE INTEREST2 (IN THOUSANDS) RATE3
NET LEASE
Bellagio Net Lease 1 Las Vegas, NV Nov 2019 95% 8,507 sq. ft. N/A
MGM Grand Net Lease 5
1 Las Vegas, NV Feb 2020 50% 6,917 sq. ft. N/A
Mandalay Bay Net Lease 5
1 Las Vegas, NV Feb 2020 50% 9,324 sq. ft. N/A
TOTAL NET LEASE 3 24,748 sq. ft.
NUMBER OF OWNERSHIP SQ. FT. OCCUPANCY
SEGMENT AND INVESTMENT PROPERTIES LOCATION ACQUISITION DATE INTEREST2 (IN THOUSANDS) RATE3
DATA CENTERS
D.C. Powered Shell Warehouse Portfolio 9 Ashburn & Manassas, VA Jun & Dec 2019 90% 1,471 sq. ft. 100%
Highpoint Powered Shell Portfolio 2 Sterling, VA Jun 2021 100% 430 sq. ft. 100%
QTS Data Centers5 48 Various Aug 2021 50.1% 8,303 sq. ft. 92%
TOTAL DATA CENTERS 59 10,204 sq. ft.
NUMBER OF OWNERSHIP OCCUPANCY
SEGMENT AND INVESTMENT PROPERTIES LOCATION ACQUISITION DATE INTEREST2 KEYS RATE3
HOSPITALITY
Hyatt Place UC Davis 1 Davis, CA Jan 2017 100% 127 keys 52%
Hyatt Place San Jose Downtown 1 San Jose, CA Jun 2017 100% 240 keys 36%
Florida Select-Service 4-Pack 4 Tampa & Orlando, FL Jul 2017 100% 476 keys 67%
Hyatt House Downtown Atlanta 1 Atlanta, GA Aug 2017 100% 150 keys 58%
Boston/Worcester Select-Service 3-Pack 3 Boston & Worcester, MA Oct 2017 100% 374 keys 58%
Henderson Select-Service 2-Pack 2 Henderson, NV May 2018 100% 228 keys 75%
Orlando Select-Service 2-Pack 2 Orlando, FL May 2018 100% 254 keys 72%
Corporex Select Service Portfolio 5 Various Aug 2018 100% 601 keys 65%
JW Marriott San Antonio Hill Country Resort 1 San Antonio, TX Aug 2018 100% 1,002 keys 41%
Hampton Inn & Suites Federal Way 1 Seattle, WA Oct 2018 100% 142 keys 54%
Staybridge Suites Reno 1 Reno, NV Nov 2018 100% 94 keys 81%
Salt Lake City Select Service 3 Pack 3 Salt Lake City, UT Nov 2018 60% 454 keys 69%
Courtyard Kona 1 Kailua-Kona, HI Mar 2019 100% 455 keys 53%
Raven Select Service Portfolio 21 Various Jun 2019 100% 2,555 keys 61%
Urban 2-Pack 1 Chicago, IL Jul 2019 100% 337 keys 29%
Hyatt Regency Atlanta 1 Atlanta, GA Sep 2019 100% 1,260 keys 40%
RHW Select Service Portfolio 9 Various Nov 2019 100% 923 keys 69%
TOTAL HOSPITALITY 58 9,672 keys
NOTE: As of September 30, 2021. Past performance does not guarantee future results. Actual results may vary. Diversification does not assure a
profit or protect against a loss in a declining market. Please refer to the endnotes on page 32.
30 B R E I T | R E A L E S TAT E P R O P E R T Y H O L D I N G SBREIT Real Estate Property Holdings (Cont’d)
NUMBER OF OWNERSHIP SQ. FT. OCCUPANCY
SEGMENT AND INVESTMENT PROPERTIES LOCATION ACQUISITION DATE INTEREST2 (IN THOUSANDS) RATE3
SELF STORAGE
East Coast Storage Portfolio 21 Various Aug 2019 98% 1,451 sq. ft. 94%
Phoenix Storage 2-Pack 2 Phoenix, AZ Mar 2020 98% 111 sq. ft. 96%
Cactus Storage Portfolio 18 Various Sep & Oct 2020 98% 1,114 sq. ft. 92%
Caltex Storage Portfolio 4 Various Nov & Dec 2020 98% 241 sq. ft. 95%
Simply Self Storage 102 Various Dec 2020 100% 7,843 sq. ft. 93%
Florida Self Storage Portfolio 2 Cocoa & Rockledge, FL Dec 2020 98% 159 sq. ft. 97%
Pace Storage Portfolio 1 Pace, FL Dec 2020 98% 72 sq. ft. 94%
American Harbor 1 Dallas, TX Aug 2021 100% 66 sq. ft. 96%
Flamingo Self Storage Portfolio 1 Corpus Christi, TX Sep 2021 98% 65 sq. ft. 93%
TOTAL SELF STORAGE 152 11,122 sq. ft.
NUMBER OF OWNERSHIP SQ. FT. OCCUPANCY
SEGMENT AND INVESTMENT PROPERTIES LOCATION ACQUISITION DATE INTEREST2 (IN THOUSANDS) RATE3
RETAIL
Bakers Centre 1 Philadelphia, PA Mar 2017 100% 236 sq. ft. 100%
Plaza Del Sol Retail 1 Burbank, CA Oct 2017 100% 166 sq. ft. 99%
Vista Center 1 Miami, FL Aug 2018 100% 89 sq. ft. 95%
El Paseo Simi Valley 1 Simi Valley, CA Jun 2019 100% 197 sq. ft. 90%
Towne Center East 1 Signal Hill, CA Sep 2019 100% 163 sq. ft. 99%
Plaza Pacoima 1 Pacoima, CA Oct 2019 100% 204 sq. ft. 100%
Canarsie Plaza 1 Brooklyn, NY Dec 2019 100% 274 sq. ft. 99%
SoCal Grocery Portfolio 6 Various Jan 2020 100% 689 sq. ft. 94%
Northeast Tower Center 1 Philadelphia, PA Aug 2021 100% 296 sq. ft. 100%
TOTAL RETAIL 14 2,314 sq. ft.
NUMBER OF OWNERSHIP SQ. FT. OCCUPANCY
SEGMENT AND INVESTMENT PROPERTIES LOCATION ACQUISITION DATE INTEREST2 (IN THOUSANDS) RATE3
OFFICE
EmeryTech Office 1 Emeryville, CA Oct 2019 100% 228 sq. ft. 95%
Coleman Highline Office 1 San Jose, CA Oct 2020 100% 357 sq. ft. 100%
Atlanta Tech Center Office 1 Atlanta, GA May 2021 98% 361 sq. ft. 100%
TOTAL OFFICE 3 946 sq. ft.
TOTAL INVESTMENTS
1,599
IN REAL ESTATE PROPERTIES
NOTE: As of September 30, 2021. Past performance does not guarantee future results. Actual results may vary. Diversification does not assure a
profit or protect against a loss in a declining market. Please refer to the endnotes on page 32.
R E A L E S TAT E P R O P E R T Y H O L D I N G S | B R E I T 31ENDNOTES
1. Residential includes multifamily and other types of rental housing the percentage of actual rent divided by gross potential rent (defined
such as manufactured housing, student housing, and single family as actual rent for occupied units and market rent for vacant units) for
rental housing, as well as senior living. Residential units include the three months ended September 30, 2021. For our single family
multifamily units, manufactured housing sites, student housing beds, rental investments, the occupancy rate includes occupied homes for
single family rental homes and senior living units. Single family rental the three months ended September 30, 2021. For our self storage,
homes are accounted for in residential units and are not reflected in manufactured housing and senior living investments, the occupancy
the number of properties. rate includes occupied square footage, occupied sites and occupied
units, respectively, as of September 30, 2021. The occupancy rate for
2. Certain of our joint venture agreements provide the seller or the our hospitality investments includes paid occupied rooms for the 12
other partner a profits interest based on achieving certain internal months ended September 30, 2021. Hospitality investments owned
rate of return hurdles. Such investments are consolidated by us and less than 12 months are excluded.
any profits interest due to the other partners is reported within non-
controlling interests. The table above also includes properties owned 4. Includes a 100% interest in 11,414 consolidated single family rental
by unconsolidated entities. properties, a 27.8% interest in 9,078 unconsolidated single family
rental properties, and a 12.2% interest in 448 unconsolidated single
3. For our industrial, data center, retail and office investments, occupancy family rental properties.
includes all leased square footage as of September 30, 2021. For our
multifamily and student housing investments, occupancy is defined as 5. Investment is unconsolidated.
32 BREIT | ENDNOTESA D D I T I O N A L I M P O R TA N T D I S C L O S U R E S
This material was not created by any third party registered broker-dealers The logos presented herein were not selected based on performance of the
or investment advisers who are distributing shares of BREIT (each, a applicable company or sponsor to which they pertain. Logos were selected
“Dealer”). The Dealers have made no independent verification of the to illustrate managers, portfolio companies and/or investments that are
information provided and do not guarantee the accuracy or completeness indicative representations of the thesis, theme or trend discussed on the
of such information. slide(s) where they appear. In Blackstone’s opinion, the logos selected
were generally the most applicable examples of the given thesis, theme or
This material is not to be reproduced or distributed to any other persons trend discussed on the relevant slide(s). All rights to the trademarks and/or
(other than professional advisors of the investors or prospective investors, logos presented herein belong to their respective owners and Blackstone’s
as applicable, receiving this material) and is intended solely for the use of use hereof does not imply an affiliation with, or endorsement by, the
the persons to whom it has been delivered. owners of these logos.
The sole purpose of this material is to inform, and it in no way is intended Past performance does not guarantee future results. Actual results may
to attract any funds or deposits. Investments mentioned may not be vary. Diversification does not assure a profit or protect against loss in a
appropriate for all investors. Any product discussed herein may be declining market.
purchased only after an investor has carefully reviewed the prospectus and
executed the subscription documents. The Dealers have not considered Clarity of text in this document may be affected by the size of the screen
the actual or desired investment objectives, goals, strategies, guidelines, on which it is displayed.
or factual circumstances of any investor in any fund(s).
Alternative investments involve complex tax structures, tax inefficient
Alternative investments often are speculative, typically have higher fees investing, and delays in distributing important tax information. Individual
than traditional investments, often include a high degree of risk and are funds have specific risks related to their investment programs that will
appropriate only for eligible, long-term investors who are willing to forgo vary from fund to fund. Investors should consult their own tax and legal
liquidity and put capital at risk for an indefinite period of time. They may be advisors as Dealers generally do not provide tax or legal advice. REITs are
highly illiquid and can engage in leverage and other speculative practices generally not taxed at the corporate level to the extent they distribute all of
that may increase volatility and risk of loss. their taxable income in the form of dividends. Ordinary income dividends
are taxed at individual tax rates and distributions may be subject to state
Opinions expressed reflect the current opinions of BREIT as of the date tax. Each investor’s tax considerations are different and consulting a tax
appearing in the materials only and are based on BREIT’s opinions of the advisor is recommended. Any of the data provided herein should not be
current market environment, which is subject to change. Stockholders, construed as investment, tax, accounting or legal advice.
financial professionals and prospective investors should not rely solely
upon the information presented when making an investment decision and Interests in alternative investment products are distributed by the
should review the most recent prospectus, as supplemented, available at applicable Dealer and (1) are not FDIC-insured, (2) are not deposits or other
www.breit.com. Certain information contained in the materials discusses obligations of such Dealer or any of its affiliates, and (3) are not guaranteed
general market activity, industry or sector trends, or other broad-based by such Dealer and its affiliates. Each Dealer is a registered broker-dealer,
economic, market or political conditions and should not be construed as not a bank.
research or investment advice.
Further, opinions expressed herein may differ from the opinions expressed
by a Dealer and/or other businesses / affiliates of a Dealer. This is not a
“research report” as defined by FINRA Rule 2241 or a “debt research
report” as defined by FINRA Rule 2242 and was not prepared by the
Research Departments of a Dealer or its affiliates.
A D D I T I O N A L I M P O R TA N T D I S C L O S U R E S | B R E I T 33You can also read