ARS Investment Partners, LLC - Q1
←
→
Page content transcription
If your browser does not render page correctly, please read the page content below
Q1 | 2021

ARS Investment Partners, LLC
PRESENTATION OUTLINE

                             Differentiated
     Firm Overview
                             Investment Strategy

     Investment Philosophy   Appendix

     Investment Outlook

                                                   2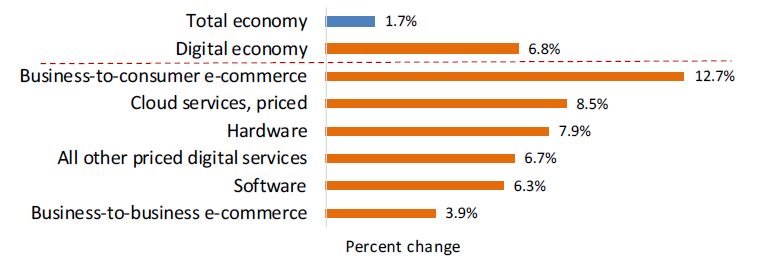
Overview               Philosophy            Outlook         Strategy            Appendix

FIRM OVERVIEW

 Originally founded                      16 professionals,               Single investment
 in 1971, ~$1.55 billion                 with the Investment             philosophy and process
 in assets under                         Committee averaging             drives all strategies
 management                              37+ years experience

 A broad spectrum of                     Principals share the            Demonstrated thought
 strategies to meet a                    same values and invest          leadership throughout
 range of client profiles                alongside our clients           our history

                                                                                                  3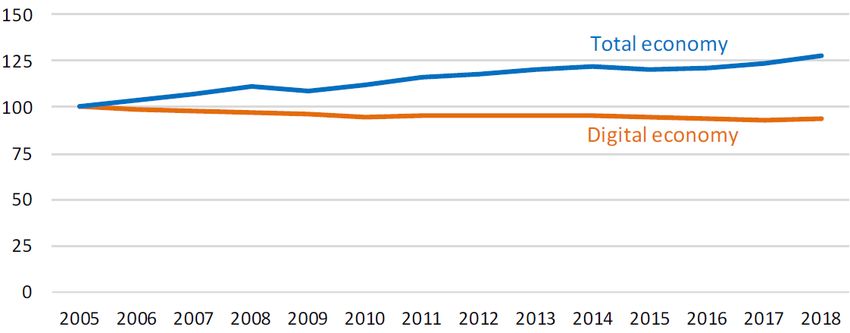
Overview             Philosophy         Outlook                Strategy             Appendix

KEY DIFFERENTIATORS

“It is worth noting that few institutional money managers invest their own money along
 with their clients’ funds. The failure to do so frees these managers to single-mindedly
 pursue their firms’, rather than their clients’, best interests.”
                                                                                    SETH KLARMAN

 High-conviction, forward-looking point of             Differentiated portfolios with high active
 view expressed through our Outlook                    share and low correlation to peers
                                                       and benchmark

 Highly experienced team with demonstrated             Partnership model aligns interests
 thought leadership                                    of clients and team

                                                                                                    4
Overview Philosophy Outlook Strategy Appendix
SEASONED MANAGEMENT AND INVESTMENT TEAMS
Operating Committee
Stephen Burke Sean Lawless Kristen Niebuhr
Managing Partner Partner COO & CCO
37 yrs. 37 yrs. 37 yrs. 37 yrs. 37 yrs. 37 yrs.
INDUSTRY INDUSTRY INDUSTRY INDUSTRY INDUSTRY INDUSTRY
Michael Schaenen Andrew Schmeidler Arnold Schmeidler
Senior Partner Partner Senior Partner
Investment Policy Committee
Brian Barry Stephen Burke Sean Lawless Nitin Sacheti
Portfolio Manager Managing Partner Partner Portfolio Manager
37 yrs.
18 yrs. 8 yrs. 37 yrs. 4037 yrs.
yrs. 1437 yrs.
yrs. 37yrs.
34 yrs. 37yrs.
15 yrs. 37
16 yrs.
yrs. 37 yrs.
1 yr.
INDUSTRY
INDUSTRY INDUSTRY
AT FIRM INDUSTRY
INDUSTRY ATINDUSTRY
FIRM INDUSTRY
INDUSTRY INDUSTRY
AT FIRM INDUSTRY
INDUSTRY INDUSTRY
AT FIRM
Michael Schaenen Andrew Schmeidler Arnold Schmeidler Ross Taylor
Senior Partner Partner Senior Partner Partner
61 yrs. 22 yrs. 29 yrs. 25 yrs. 62 yrs. 50 yrs.
37 yrs. 12 yrs.
INDUSTRY AT FIRM INDUSTRY AT FIRM INDUSTRY AT FIRM
INDUSTRY AT FIRM
5Overview Philosophy Outlook Strategy Appendix
CORE PHILOSOPHY
“Our philosophy is to buy the most assets, cash flow and earnings for the fewest dollars,
among leading companies that stand to be the beneficiaries of global capital flows.”
ARNOLD SCHMEIDLER, SENIOR PARTNER
Securities trade in an Opportunities to invest The best investments
auction market with in good businesses are often initially
inherent inefficiencies exist regardless of accompanied by higher
resulting in mispricing market direction levels of discomfort
of securities
There is often an inverse Undervalued companies Investment risk is
relationship between the with identifiable earnings- viewed as overpaying
popularity of a security growth catalysts offer for a business or
and its value attractive absolute returns incorrectly projecting
without excessive risk its future earnings
6Overview Philosophy Outlook Strategy Appendix
A DIFFERENTIATED INVESTMENT PHILOSOPHY AND APPROACH
Define global
environments and Evaluate and Construct and
who will be the select individual implement
beneficiary of securities portfolios
capital flows
RISK ASSESSMENT AND MANAGEMENT
Ongoing Industry Business
Scenario Analysis Selection Valuation Support
7Overview Philosophy Outlook Strategy Appendix
STRICT ADHERENCE TO SELL DISCIPLINE
Investment thesis is no Price target is realized Earnings impairment
longer supported
Portfolio guideline Better relative opportunity Risk management
compliance and control
8Overview Philosophy Outlook Strategy Appendix
A BROAD RANGE OF STRATEGIES TO MATCH CLIENT NEEDS
Small Cap Equity
AUM: ~$15M
Asset Classes
All Cap Equity 6
AUM: ~$700M • ARS Focused
Small Cap
Strategy
Core Equity 5 • ARS Focused
POTENTIAL RETURN
AUM: ~$350M ETF Strategy
• ARS Focused
Asset Allocation 4 • ARS Core All Cap Strategy
AUM: ~$190M Equity Strategy
Alternatives 3 • ARS Tactical Sector
AUM: ~$90M Allocation ETF Strategies
• ARS Tactical
2 Asset Allocation
Fixed Income • ARS Multi-Strategy Balanced Strategy
AUM: ~$20M
• Papyrus Capital
Fund, L.P. Strategies
1
• ARS Core Fixed
Income Strategy POTENTIAL RISK
Non-discretionary assets and customized portfolios ~$185M.
This graph is shown for illustrative purposes only. While directionally accurate, our strategies do not necessarily exhibit a linear and geometric progression in the relationship
between risk and return. Assets under management figures are as of March 31, 2021.
9Overview Philosophy Outlook Strategy Appendix
Outlook
Investment Outlook The Outlook
10Overview Philosophy Outlook Strategy Appendix
THE SIX CRITICAL TRANSFORMATIONS
“The global COVID-19 pandemic shows few signs of relenting – in fact, in addition to its
dual burden on lives and livelihoods, it is triggering civil unrest, new concerns about
economic inequality, geopolitical tensions, and many other effects. The pandemic is
more than an epidemiological event; it is a complex of profound disruptions.”
McKinsey Global Institute
The Monetary and Fiscal The Geopolitical and The Digital
Transformation Political Transformation Transformation
The Social and Societal The Climate The Educational
Transformation Transformation Transformation
11Overview Philosophy Outlook Strategy Appendix
OUR OUTLOOK
Macro Considerations
• Six critical transformations are occurring • Pent-up demand from consumers,
simultaneously and changing how we live, learn, corporations, and government is driving
work and govern economic activity in 2021 and beyond
• Technological advances continue to • Potential for “economic scarring” or long-term
reshape society and accelerate the rate of negative impact for large segments of global
change of new tech, while creating new population is elevated
businesses with large total addressable markets
• Markets will be driven by earnings growth
• Massive monetary and fiscal policy response rather than multiple expansion
working through global economy stoking inflation
• Potential tax and regulatory changes pose
fears which should be transitory
headwinds for earnings
• Policy initiatives continue to favor equities.
• Global system adjusting to changes in
Government bonds are offering the most
monetary policies, politics, terms of trade,
unattractive risk/reward returns in memory
and COVID-19
• Global recovery is uneven due to the various
• Adjustments in global supply chains
pre-COVID and post-COVID health and
including on-shoring, re-shoring, and
economic policy responses
improving resiliency and adaptability
• Increasing impact of climate change on society
12Overview Philosophy Outlook Strategy Appendix
THE RESTART: PENT-UP DEMAND
Personal Savings Rate
Percent, Quarterly, Seasonally Adjusted
20.0%
18.0%
16.0%
14.0%
12.0%
10.0%
8.0%
6.0%
4.0%
2.0%
0.0%
59
62
65
68
71
74
77
80
83
86
89
92
95
98
01
04
07
10
13
16
19
n-
n-
n-
n-
n-
n-
n-
n-
n-
n-
n-
n-
n-
n-
n-
n-
n-
n-
n-
n-
n-
Ja
Ja
Ja
Ja
Ja
Ja
Ja
Ja
Ja
Ja
Ja
Ja
Ja
Ja
Ja
Ja
Ja
Ja
Ja
Ja
Ja
Source: St. Louis Federal Reserve. December 2020
13$1,000,000
$2,000,000
$3,000,000
$4,000,000
$5,000,000
$6,000,000
$7,000,000
$0
Oct-51
Jan-53
Apr-54
Overview
Jul-55
Oct-56
Jan-58
Apr-59
Jul-60
Oct-61
Jan-63
Apr-64
Jul-65
Source: St. Louis Federal Reserve. December 2020
Oct-66
Jan-68
Apr-69
Philosophy
Jul-70
Oct-71
Jan-73
THE RESTART: PENT-UP DEMAND
Apr-74
Jul-75
Oct-76
Jan-78
Apr-79
Jul-80
Oct-81
Jan-83
Apr-84
Outlook
Jul-85
Oct-86
Jan-88
Apr-89
Jul-90
Oct-91
Jan-93
Apr-94
Jul-95
Total Capital Expenditures
Oct-96
Jan-98
Apr-99
Strategy
Jul-00
Oct-01
Percent, Quarterly, Seasonally Adjusted, Millions of Dollars
Jan-03
Apr-04
Jul-05
Oct-06
Jan-08
Apr-09
Jul-10
Oct-11
Jan-13
Apr-14
Jul-15
Appendix
Oct-16
Jan-18
Apr-19
Jul-20
14Overview Philosophy Outlook Strategy Appendix
THE GROWTH OF THE DIGITAL ECONOMY
Digital Economy Current-Dollar Value Added and Share of Total GDP
Source: U.S. Bureau of Economic Analysis, New Digital Economy Estimates
15Overview Philosophy Outlook Strategy Appendix
THE GROWTH OF THE DIGITAL ECONOMY
Real Gross Output Index
Real Gross Price Index
Source: U.S. Bureau of Economic Analysis, New Digital Economy Estimates
16Overview Philosophy Outlook Strategy Appendix
THE GROWTH OF THE DIGITAL ECONOMY
Components of the Digital Economy: Real Value-Added Average Annual Growth, 2006-2018
Source: U.S. Bureau of Economic Analysis, New Digital Economy Estimates
17Overview Philosophy Outlook Strategy Appendix
OUR OUTLOOK
Areas of Focus
Technology Companies Healthcare Companies
• Benefiting from unprecedented innovation ― • Technology-enabled breakthroughs
particularly those that are integral to the • Strong product pipelines
introduction of 5G
• Growing dividends
• ARS is focused on the beneficiaries including:
‒ Telecommunications • Better insulated from potential
‒ Cloud price interference
‒ Semiconductor and equipment Dividend Growers
‒ Mobile communications
• Strong balance sheets that will continue to
‒ Network infrastructure
attract capital in a low-interest environment
‒ Software services
‒ Cybersecurity Special Situation Investments
‒ Connectivity solutions
• Business models distinctly positioned to
‒ Autonomous driving and display
benefit from major economic trends
Industrial and Materials Investments Emerging Themes
• Well-defined end-market demand, including
• Technology that drives changes in education
defense and infrastructure supported by
and healthcare
state and local governments
18Overview Philosophy Outlook Strategy Appendix
OUR OUTLOOK
Company Characteristics
• Those corporations with “embedded advantages”
• Top-line growth in a low-growth environment
• Market share gainers
• Increasing free cash flows
• Improving margins
• Ability to increase pricing power
• Growing dividends
19Overview Philosophy Outlook Strategy Appendix
OUR OUTLOOK
Potential Risks in the System
• Policy response overheats global economy • Inequality being exacerbated by policy
causing inflation and a tightening of monetary response
conditions at a vulnerable time for economy
• Rising deficits and debt servicing costs for
• Global supply chain disruptions due to the United States
COVID-19 pandemic
• Central bank policy missteps in normalizing
• Geopolitical — China’s aggressions in the South monetary policy
China Sea, shifting global alliances and tensions
• Demographic challenges in many nations
in other parts of world including the Middle East
• Political dysfunction in developed nations
• Global debt increasing and straining
government balance sheets • Another pandemic in the next few years
• Rate and magnitude of change in interest rates, • Struggle to vaccinate large segments of the
inflation rates and currencies is too sudden for global population creates wider divergences
markets to absorb in rates of recovery
20Overview Philosophy Outlook Strategy Appendix
THE OUTLOOK ―HIGHLIGHTS FROM FEBRUARY 2021
Pent-up demand will support economic activity
in the second half of 2021.
Globally, governments have provided stimulus
equal to more than 33% of global GDP and
this figure continues to rise. The liquidity
injected into the system has allowed the global
economy to absorb the shock of the pandemic
and rebound from the brink of a severe
recession, if not, a depression.
There are investable ideas present in virtually
all market environments, and investors should
be able to achieve attractive absolute and
relative returns over time by owning the
businesses that are the beneficiaries of the
secular trends.
ARS communicates its key investment themes
to clients through The Outlook ― in continuous
publication for more than 40 years.
CLICK HERE FOR MORE INSIGHTS:
arsinvestmentpartners.com/outlook-insights/
21Overview Philosophy Outlook Strategy Appendix
Differentiated Investment Strategy
ARS Focused
All Cap Strategy
22Overview Philosophy Outlook Strategy Appendix
A DIFFERENTIATED INVESTMENT PHILOSOPHY AND APPROACH
Focused All Cap — Portfolio Construction and Security Selection
High-conviction, Strong active share Leverages proprietary
absolute-return approach leading to low correlation macro and fundamental
research process
Opportunistic Unconstrained by sector Best ideas represented
investment approach weightings and market in 25 – 30 holdings
capitalization
23Overview Philosophy Outlook Strategy Appendix
EVALUATE AND SELECT INDIVIDUAL SECURITIES
INVESTMENT PROCESS Identify those undervalued companies that
Focused All Cap will be the beneficiaries of capital flows
Screens Characteristics
VALUE • Price/Earnings • Value metrics must be supportive of what we would be
• Price/Free Cash Flow willing to pay if we were to acquire the entire corporation
• Price/Sales
• Market Value versus Asset Value
• Return on Invested Capital
GROWTH • Earnings Growth Rate • Historic EPS growth rates are significantly higher than
• Asset Value Growth benchmark average
• Dividend Growth Rate • Expected catalysts
• Product Cycle
SOFT • Institutional Ownership Composition • High barriers to entry
• Relative Value to Peers • Target managements whose interests are aligned
• Insider Ownership with shareholders
• Relative Value to Indices • Favor dividend programs
• Analyst Coverage • Buy shares with light institutional and analyst following
• Relative Historic Valuation • Hidden assets
• Dividend Yield • Good management teams
• Use of Free Cash Flow
All screens are tailored to specific industries.
24Overview Philosophy Outlook Strategy Appendix
REPRESENTATIVE ARS FOCUSED ALL CAP HOLDINGS*
COMMUNICATION SERVICES FINANCIALS HEALTH CARE
ALPHABET INC. (GOOGL) 4.80% JPMORGAN & CHASE CO. (JPM) 3.47% ASCENDIS PHARMACEUTICAL (ASND) 2.35%
CHARTER COMMUNICATIONS (CHTR) 3.44% BIOHAVEN PHARMACEUTICAL (BHVN) 3.98%
INFORMATION TECHNOLOGY
DISH NETWORK CORP. (DISH) 2.22%
APPLE INC. (AAPL) 4.60% MATERIALS
LIBERTY LATIN AMERICA LTD. (LILAK) 3.10% CLEVELAND CLIFFS INC. (CLF) 3.78%
INTRUSION INC. (INTZ) 3.95%
CONSUMER DISCRETIONARY LAM RESEARCH CORP. (LRCX) 4.00% MARTIN MARIETTA MATERIALS (MLM) 2.56%
AMAZON.COM INC. (AMZN) 4.34% MICRON TECHNOLOGY INC. (MU) 4.63% MP MATERIALS CORP (MP) 3.19%
GENERAL MOTORS CO. (GM) 3.91% MICROSOFT CORP. (MSFT) 5.07% CASH
NVIDIA CORP. (NVDA) 2.50% USD 3.73%
INDUSTRIALS
FEDEX CORP. (FDX) 2.17% NXP SEMICONDUCTORS NV (NXPI) 3.67%
L3HARRIS TECHNOLOGIES INC. (LHX) 3.04% PAYPAL HOLDINGS INC. (PYPL) 2.64%
PARKER HANNIFIN CORP. (PH) 3.70% QUALCOMM INC. (QCOM) 2.98%
RAYTHEON TECHNOLOGIES (RTX) 3.02% TUFIN SOFTWARE TECH. LTD. (TUFN) 2.00%
VICOR CORP. (VICR) 1.82% VISA INC. CLASS A (V) 2.30%
XPO LOGISTICS INC. (XPO) 3.06%
Sector weights (%)
ARS Russell 3000 38.32%
25.63%
16.81%
13.56% 12.26% 13.50%
9.94% 9.81% 11.68%
8.25% 9.53%
6.33%
3.47% 2.93% 3.73%
Communication Consumer Industrials Financials Information Healthcare Materials Cash
Services Discretionary Technology
March 31, 2021
*These holdings are supplemental information to the GIPS-verified presentation. Holdings are subject to change. Indices are unmanaged, do not incur expenses and are not available
for direct investment. See Disclosure Notes.
25Overview Philosophy Outlook Strategy Appendix
ABSOLUTE RETURNS AND COMPOUNDING OF CAPITAL
Focused All Cap Market Capture and Total Risk/Reward, Informa Investment Solutions
(period ending March 31, 2021)
Upside capture Risk/return characteristics
(since inception, January 1993) (since inception, January 1993)
ARS Russell 3000 13
40.00
29.76% 28.58%
30.00 12 ARS
20.00
Annualized Returns
11
10.00
Downside Market Capture
89.53%
0.00 10
Upside Market Capture
104.12%
-10.00 Russell 3000
9
-20.00
-30.00 -26.17% 8
-29.08% 15 17 19 21 23
-40.00 Standard Deviation
Market Capture and Risk/Return statistics are calculated by Informa on a gross-of-fees basis. See Disclosure Notes.
26Overview Philosophy Outlook Strategy Appendix
HIGH-CONVICTION INVESTING
Focused All Cap Quartile Ranking Bar, Informa Investment Solutions (PSN) All Cap Core
(period ending March 31, 2021; inception January 21, 1993)
Year-to-Date 1 Year 3 Years* 5 Years* 10 Years* Since Inception*
RETURN RANK RETURN RANK RETURN RANK RETURN RANK RETURN RANK RETURN RANK
ARS Focused All Cap
4.19% 86 72.44% 17 17.13% 26 18.74% 5 10.84% 92 12.29% 20
(gross of fees)
(net of fees) 3.92% — 70.63% — 15.90% — 17.55% — 9.89% — 11.37% —
Russell 3000 6.35% 65 62.53% 47 17.12% 29 16.64% 33 13.79% 25 10.38% 60
90
80
70
60
50
40
30
20
10
0
-10
Year-to-Date 1 Year 3 Years 5 Years 10 Years Since Inception
Performance rankings from Informa PSN are shown on a gross-of-fees basis.
*Performance numbers are annualized for all time periods over 1 year. See Disclosure Notes.
27Overview Philosophy Outlook Strategy Appendix
Appendix
Strategy Composite Strategy
Performance Definitions
Professional
Biographies
28Overview Philosophy Outlook Strategy Appendix
ARS FOCUSED ALL CAP COMPOSITE PERFORMANCE
Composite
Asset-Weighted Return
Period Composite Benchmark Composite Firm
Ending Number of Composite 3-Year 3-Year Assets Assets
12/31 Gross Net Russell 3000 Portfolios Dispersion Ex-Post St. Dev. Ex-Post St. Dev. ($ in Millions) ($ in Millions)
1993* 12.43% 11.39% 10.41% 1 — N/A N/A 5.62 144.76
1994 3.64% 2.80% 0.19% 1 — N/A N/A 21.11 163.23
1995 29.55% 28.36% 36.80% 2 — N/A N/A 27.21 217.34
1996 12.07% 11.06% 21.82% 2 — N/A N/A 30.35 247.56
1997 31.62% 30.51% 31.78% 2 — N/A N/A 39.77 321.72
1998 18.25% 17.27% 24.14% 2 — N/A N/A 45.52 376.14
1999 33.97% 32.87% 20.90% 2 — N/A N/A 51.46 470.38
2000 4.09% 3.29% -7.46% 2 — N/A N/A 55.41 526.99
2001 -1.71% -2.41% -11.46% 2 — N/A N/A 97.84 540.94
2002 -16.44% -17.01% -21.54% 2 — N/A N/A 85.09 439.66
2003 33.70% 32.85% 31.06% 2 — N/A N/A 117.15 548.82
2004 13.59% 12.85% 11.95% 1 — N/A N/A 32.77 596.36
2005 31.48% 30.55% 6.12% 1 — N/A N/A 41.56 809.13
2006 18.25% 17.49% 15.72% 1 — N/A N/A 48.87 1,043.06
2007 33.60% 32.78% 5.14% 1 — N/A N/A 62.83 1,398.39
2008 -42.91% -43.27% -37.31% 5 — N/A N/A 93.71 1,031.74
2009 27.59% 26.81% 28.34% 3 — N/A N/A 66.25 1,369.87
2010 26.62% 25.74% 16.93% 6 2.84 N/A N/A 120.52 1,589.65
2011 -8.30% -8.88% 1.03% 6 — 21.16% 19.35% 91.12 1,286.20
2012 3.62% 2.93% 16.42% 6 — 17.49% 15.73% 70.38 1,125.16
2013 31.19% 30.23% 33.55% 4 — 15.36% 12.53% 57.74 1,181.07
2014 2.28% 1.50% 12.56% 5 — 11.21% 9.29% 61.52 1,182.90
2015 -0.37% -1.11% 0.48% 3 — 11.05% 10.58% 47.19 1,039.85
2016 9.16% 8.28% 12.74% 3 — 11.19% 10.88% 49.56 892.23
2017 32.62% 31.23% 21.13% 3 — 10.42% 10.09% 65.30 1,084.27
2018 -14.56% -15.45% -5.24% 4 — 12.95% 11.18% 62.26 984.94
2019 35.74% 34.74% 31.02% 3 — 14.09% 12.21% 71.93 1,208.76
2020 34.80% 33.38% 20.89% 3 — 20.26% 19.41% 92.58 1,447.81
*This period represents a partial year performance (1/21/93 – 12/31/93) and the return is not annualized. 29
Performance data for both gross and net of fees reflect the reduction of transaction costs. Net of fees reflects the deduction of
advisory fees. Performance is GIPS-verified through 12/31/2018. The investment advisory fees are described in Part 2A of the Form
ADV. Performance results reflect the reinvestment of dividends and income. Past performance is not indicative of future results.
Index information is provided for illustrative purposes only. Indices are unmanaged, do not incur expenses and are not available for
direct investment. See Disclosure Notes.Overview Philosophy Outlook Strategy Appendix
PROFESSIONAL BIOGRAPHIES
Stephen Burke Michael Schaenen
Managing Partner Senior Partner
Stephen Burke joined ARS in June of 2007. Previously, he was the CEO Michael Schaenen entered the investment business in 1960 as a
of Deutsche Asset Management’s $165 billion Institutional Business in registered representative at Bache & Co. Prior to joining ARS, Michael
the Americas, serving the Defined Benefit, Insurance, and Cash was the founding partner of Schaenen Wood & Associates (“SWA”), an
Management segments. Stephen joined Deutsche after a 21-year career asset management firm whose total assets under management
at the Mellon Financial Corporation where he served as Vice Chairman exceeded $1.25 billion by 1993, at which point SWA was acquired by
of Standish Mellon Asset Management and was responsible for KeyCorp. Michael left SWA in 1995, forming Schaenen Fox &
institutional sales, marketing, and client services. Before joining Associates, which later became Somerset Capital Advisers, LLC.
Standish, he was the President of Dreyfus’ Marketing and Advertising Among his previous roles, Michael was a General Partner at
Division. Stephen holds a BA from Gettysburg College. Oppenheimer & Co. Michael received a BA in Psychology from Amherst
College.
Arnold Schmeidler
Senior Partner P. Ross Taylor III
Prior to founding ARS Investment Partners, LLC, Arnold Schmeidler was Partner
Vice President at A.W. Benkert & Company. He earned a BS in
Economics from New York University and an MS in Finance from Ross Taylor’s professional investing experience began in 1984 as a
Columbia University, where he studied under David Bonbright, a protégé portfolio manager. Prior to joining ARS, Ross was the Chief
of David Dodd (Graham & Dodd). Over the course of his career, he has Investment Officer for Somerset Capital Advisers, LLC beginning in
been quoted and/or interviewed by such publications as Barron’s, 2009. He previously served as a Managing Director and Principal of
Forbes, Fortune, Institutional Investor, International Herald Tribune, Caxton Associates, LLC (“Caxton”). At Caxton he managed an active
Money Magazine, The New York Times, The Wall Street Transcript, and equity product utilizing a value-driven strategy. Prior to joining Caxton,
The Wall Street Journal. Ross worked at U.S. Trust Company, rising to Senior Vice President
and Manager of Institutional Equity and Balanced Investing. Before
that Ross worked at Management Asset Corporation from 1986 to
1987, and Brundage, Story, and Rose from 1984 to 1986. Ross
received a BS in Economics from the University of Puget Sound and
an MBA from the Wharton School of the University of Pennsylvania.
30Overview Philosophy Outlook Strategy Appendix
PROFESSIONAL BIOGRAPHIES
Sean Lawless, CFA Kristen Niebuhr
Partner Chief Operating Officer
Sean Lawless entered the industry in 1987, primarily specializing in Chief Compliance Officer
investment manager selection and due diligence for families and Kristen Niebuhr joined ARS in 2017 and has over 30 years of
institutions. At ARS, Sean is lead portfolio manager responsible for experience in the financial services industry. At ARS she serves as the
developing multi-strategy portfolios. Prior to joining ARS, Sean joined Chief Compliance Officer and Chief Operating Officer. Previously,
Artemis Wealth, LLC (and its predecessor firm Modern Asset Kristen was Director of Practical Compliance at MarketCounsel, a
Management) in 2006 and provided investment advisory services using compliance consulting firm. Prior to that role, she served as President
a manager of managers approach. Previously, Sean was Head of of Source Financial Advisors, launched in September of 2012.
Multimanager – Americas for HSBC and a voting member of the Global Beginning in 2009, she served as Chief Administrative Officer of
Multimanager Investment Committee that was responsible for setting Alexandra & James, a holding company encompassing A&J Advisory
policy and manager selection for HSBC’s global sub-advisory Services (an RIA), Lebenthal (a B/D), A&J Family Wealth Management
businesses. He is a CFA charter holder, a member of the CFA Institute (a family office), and Smith Divorce Strategies (a divorce financial
and the New York Society of Security Analysts and received a BS in planning firm). Before joining A&J, Kristen started in 2007 with the
Economics from Southern Connecticut State University. newly-formed Constellation Wealth Advisors, overseeing their advisory
and broker-dealer operations. From 2001 through 2007, she had her
Andrew Schmeidler own consulting firm, specializing in start-up and ongoing support to
Partner advisors and hedge funds. From 1995 through 2001, she was Director
Andrew Schmeidler joined ARS in 1992 and has over 25 years of of Operations and Compliance at Schaenen Capital Management
portfolio management and research experience. Andrew served as Vice (which became Somerset Capital Advisers, LLC). She spent 1987
Chairman of A.R. Schmeidler & Co. Inc. prior to the business through 1995 in various roles at Merrill Lynch and Smith Barney. She
combination with ARS. He continues to manage accounts for received a BA in Economics from Boston University.
corporations, foundations, and high net-worth clients. Earlier in his
career at A.R. Schmeidler/ARS, he was a portfolio manager and
research analyst covering multiple sectors with a focus on the banking
and semiconductor capital equipment industries. In 2002 he returned to
ARS after spending two years as a founding member and Senior Vice
President of GasPedal Ventures, LLC, an internet incubator and
business development consultancy. Andrew has a BA in Government
from Skidmore College.
31Overview Philosophy Outlook Strategy Appendix
PROFESSIONAL BIOGRAPHIES
Brian Barry, CIMA Tom Winnick
Portfolio Manager Director of Business Development
Brian Barry joined the investment industry in 2003 and ARS in 2013. Tom Winnick joined ARS in 2020 as Director of Business Development
Previously, Brian worked at Bank of America in various investment responsible for the firm’s distribution effort. Tom has 30 years of
roles. Most recently, he was a Vice President and Portfolio Manager for experience in sales and distribution for financial institutions. Prior to
U.S. Trust and was responsible for advising high net worth and joining ARS, he was Managing Director in The Private Client Group at
institutional clients. Before joining U.S. Trust, he served as an Associate Oppenheimer Funds where he was responsible for distribution through
in the Consulting Services Group and was responsible for manager Private Banks, Trust Banks and Family Offices in the mid-Atlantic
search, selection and ongoing due diligence of investment products. He region. He previously served as Senior Vice President, Institutional
began his career as an Analyst within Banc of America Securities’ Services, at Franklin Square Capital Partners where he launched the
Corporate and Investment Bank. Brian received a BA in History and firm’s efforts to distribute to RIAs, Private Banks and Trust Companies.
Economics from the College of the Holy Cross and an MBA in Prior to Franklin Square, Tom was Managing Director at Dreman Value
International Finance from New York University’s Stern School of Management where he was responsible for all distribution and
Business. marketing efforts. Previously, Tom was President at DWS Distributors
where he held responsibility for all facets of intermediary distribution
Nitin Sacheti including sales and account management for the Broker Dealer, Banks
Portfolio Manager and Independent Channels. From 1993 to 2002, Tom held various sales
management and leadership responsibilities with Dreyfus Service
Nitin Sacheti joined ARS in 2020. Prior to joining ARS, he was the Corporation including creating their Financial Institutions Group,
Founder and Portfolio Manager of Papyrus Capital, an intrinsic value launching their separately managed account platform and overseeing
focused, long/short equity fund. Before founding Papyrus, Nitin was a the national key account group. He received a BA in Business
Senior Analyst with Equity Contribution at Charter Bridge Capital where Management from Temple University.
he managed the firm’s investments in the technology, media and
telecom sectors as well as select consumer investments. Previously, Sara Near
Nitin was a Senior Analyst at Cobalt Capital, managing the firm’s
Business Development Associate
technology, media and telecom investments. Prior to Cobalt, he was a
Senior Analyst at Tiger Europe Management. Nitin began his investment Sara Near joined ARS is 2020. She received her BA in Neuroscience
career in 2006 at Ampere Capital Management, a consumer, media, with a concentration in chemistry from Amherst College. She continued
telecom and technology focused investment firm, initially as a Junior her education at University College London and later, in 2020, wrote a
Analyst, later becoming Assistant Portfolio Manager. He received a BA thesis under Professor Robert Marx (Ph.D.). Previously in 2018, Sara
in Economics from the University of Chicago and was a visiting worked at Brown University’s Liu Laboratory researching epilepsy that
undergraduate student in Economics at Harvard University. arises from focal cortical dysplasia and genomics.
32Overview Philosophy Outlook Strategy Appendix
STRATEGY DEFINITIONS
ARS Core Fixed Income Asset Allocation (continued)
ARS Core Fixed Income Strategy ARS Tactical Asset Allocation Balanced Strategy
Our approach is to earn an appropriate level of income consistent Draws elements from our Core Equity, All Cap and Core Fixed Income
with the preservation of principal. We do not lower the standards for strategies to generate returns while reducing volatility and downside risk.
creditworthiness in the search for extra yield because we have
seen far too often that this approach leads to excessive loss of capital. ARS Core Equity
ARS Core Equity Strategy
Alternatives Invests in those companies we deem high-quality, with strong balance
ARS Multi-Strategy sheets and reasonable earnings growth. These companies have
A custom portfolio designed to meet a client’s specific needs by above-average dividend yields with the prospect for dividend growth.
investing in proprietary and third-party-managed strategies. Strategy The strategy intends to be well-diversified across sectors.
allocations are tailored to a client’s profile, focused on liquidity, income,
growth, and risk tolerance. In an effort to achieve superior risk-adjusted All Cap
returns, ARS may use traditional or alternative investment strategies in ARS Focused ETF Strategy
constructing the portfolio. Leverages our macro-outlook by constructing a portfolio that utilizes
Papyrus Capital Fund, L.P. ETFs to express our views. The strategy concentrates on sector,
A long/short strategy seeking to compound partner capital by investing industry and sub-industry ETFs that we feel provide the greatest
in mis-priced public securities, mostly equities, in the technology, media, exposure to our highest conviction themes.
telecom and consumer sectors with an emphasis on intrinsic value ARS Focused All Cap Strategy
generation over time. We seek to identify the best-positioned and undervalued companies
across market capitalization ranges and include investments
Asset Allocation characterized as growth and/or value in their orientation. Our primary
ARS Tactical Sector Allocation ETF Strategies goal is to build the purchasing power of portfolios over time.
Leverages our investment philosophy and process, while providing a
strategy that more closely tracks the benchmarks with limited turnover. Small Cap
Our ETF strategy offers important benefits for the implementation and ARS Focused Small Cap Strategy
management of client portfolios including exposures to broad markets, We believe market inefficiencies create mispricings and under-
sectors and geographies with enhanced liquidity and transparency. valuations, which can be substantial in smaller capitalization stocks. We
employ a private equity valuation approach in assessing public market
equities to identify U.S. micro- to small-cap companies with
capitalizations typically ranging from $100 million – $2.5 billion trading at
discounts of 50% or more from intrinsic value.
33Overview Philosophy Outlook Strategy Appendix
DISCLOSURE NOTES
Past performance is not indicative of future results. is designed to take into account variations reflecting conditions across regions, market
capitalization sizes, sectors, style segments and combinations. The Bloomberg
Definition of the Firm – ARS Investment Partners, LLC (“ARS”) was originally Barclay’s Intermediate US Government/Credit Bond® is a broad-based flagship
founded as A.R. Schmeidler & Co., Inc. in 1971 and is majority-owned by Artemis US benchmark that measures the non-securitized component of the Bloomberg Barclay’s
Corporation. Artemis US Corporation is 100% owned by Artemis Corporation, an US Aggregate Index with less than 10 years to maturity. The index includes
Ontario, Canada entity, which is in turn 100% owned by Artemis Investment investment grade, US dollar-denominated, fixed-rate treasuries, government-related,
Management Corporation, a financial services firm headquartered in Toronto, Ontario, and corporate securities. All Blended Benchmarks are rebalanced monthly.
Canada. Mr. Miles Nadal is the controlling shareholder of Artemis Investment
Management Corporation. ARS is a registered investment adviser under the Composite Definitions – ARS Focused All Cap includes all fee-paying, discretionary
Investment Advisers Act of 1940. ARS Investment Partners, LLC claims compliance institutional portfolios managed by ARS in a Focused All Cap strategy with an
with the Global Investment Performance Standards (GIPS) and has prepared and absolute return-oriented focus having a minimum initial portfolio size of $5 million
presented this report in compliance with the GIPS Standards. ARS Investment (amount lowered from $10 million on 7/1/2010). The Focused All Cap strategy
Partners, LLC has been independently verified for the periods 1/1/2000 through requires that equity, equity-like securities, and cash represent a target of 90% of the
12/31/18. The verification report(s) is/are available upon request. Verification portfolio value. If a portfolio does not have at least 90% of its value in these assets,
assesses whether (1) the firm has complied with all the composite construction the portfolio will be removed from the composite for the entire period and will be
requirements of GIPS standards on a firm-wide basis and (2) the firm’s policies and included in the composite again if its allocation is aligned with the above parameters
procedures are designed to calculate and present performance in compliance with for one full period. The composite was created in January 2007. Effective 7/1/2010,
GIPS standards. Verification does not ensure the accuracy of any specific composite the composite was redefined to include taxable accounts which had previously been
presentation. Benchmark returns are not covered by the report of independent excluded. Effective 1/1/17 a model fee of 1.05% was used to calculate net returns.
verifiers. Management believes that the returns prior to 2000 are accurate, but due to ARS Core Equity includes discretionary institutional portfolios managed by the Firm
a lack of firmwide client data, GIPS compliance cannot be claimed prior to 1/1/2000. and invests in companies with above-average dividend yields and strong balance
sheets, typically with clear prospects for dividend growth. For periods prior to 1/1/17,
Benchmark Definitions – The Russell 3000® measures the performance of the the composite is made up of 100% wrap portfolios, which may include, but is not
largest 3,000 US companies representing approximately 98% of the investable US limited to broker, investment advisory, custodial, and administrative fees. As of 1/1/17,
equity market. The Russell 3000® is constructed to provide a comprehensive, the composite began using non-wrap accounts. Also, as of 1/1/17, we no longer had
unbiased and stable barometer of the broad market and is completely reconstituted any wrap accounts. The composite was created in October 2011. Effective 1/1/17 a
annually to ensure new and growing equities are included. The S&P 500® includes model fee of 1.25% was used to calculate net returns. ARS Focused Small Cap
500 leading companies and covers approximately 80% of available market invests in companies with market capitalizations typically ranging from $100 million to
capitalization. The S&P Mid Cap 400® is designed to measure the performance of $2.5 billion. The portfolio is long biased, aiming to control risk via cash levels, prudent
400 mid-sized companies, reflecting the distinctive risk and return characteristics of shorts, inverse ETFs and option strategies. This composite was created in July 2018.
this market segment. The S&P Small Cap 600® seeks to measure the small-cap Net returns are calculated using a 1.25% model fee. ARS Focused ETF leverages our
segment of the U.S. equity market. The index is designed to track companies that macro outlook by constructing a portfolio that utilizes ETFs to express our views. The
meet specific inclusion criteria to ensure that they are liquid and financially viable. The strategy concentrates on sector, industry, and subindustry ETFs that we feel provide
Russell 2000® includes approximately 2,000 of the smallest securities based on a the greatest exposure to our highest conviction secular trends. This composite was
combination of their market capitalization and current index membership. The Russell created in June 2017. A model fee of 0.70% is used to calculate net returns. ARS
2000® is constructed to provide a comprehensive and unbiased small-cap barometer Tactical Sector Allocation Balanced ETF leverages our investment philosophy and
and is completely reconstituted annually to ensure larger stocks do not distort the process, while providing a strategy that more closely tracks the benchmarks with
performance and characteristics of the true small-cap opportunity set. The MSCI All limited turnover. This composite was created in December 2016. The Strategy seeks
Country World Index (ACWI) ex US® is designed to represent performance of the full a balance of current income and capital growth. The strategy strives for a 60/40
opportunity set of large- and mid-cap stocks across 23 developed (ex. US) and 26 balance between equity and fixed income ETFs with a 25% variance. A model fee of
emerging markets. It covers more than 3,000 constituents across 11 sectors and 0.70% is used to calculate net returns. ARS Tactical Sector Allocation Growth ETF
approximately 85% of the free float-adjusted market capitalization in each market. The leverages our investment philosophy and process, while providing a strategy that
index is built using MSCI’s Global Investable Market Index (GIMI) methodology, which more closely tracks the benchmarks with limited turnover.
34Overview Philosophy Outlook Strategy Appendix
DISCLOSURE NOTES
The primary objective is capital appreciation and growth. This composite was created Performance returns are in U.S. Dollars. Periodic returns are geometrically linked. The
in December 2016. A model fee of 0.70% is used to calculate net returns. composite rates of return have been calculated within ARS Investment Partners, LLC.
A complete list and description of the composites managed by ARS is available upon
Investment Management Fees – The investment management fees that apply to the request.
portfolio composites are as follows: Equity Accounts which include the ARS Core
Equity, ARS Focused All Cap, ARS Focused Small Cap & ARS Tactical Asset The information in this document is believed to be correct at the time of compilation,
Allocation (ARS Balanced Strategy & ARS Equity Strategy) – 1.25% per annum of the but no warranty of accuracy or reliability is given and no responsibility arising in any
first $1 million and 1.00% per annum of the next $20 million and to be discussed other way for errors and omissions (including responsibility to any person by reason of
thereafter; ARS Core Equity Account – 1.00% per annum, ETF Accounts which negligence) is accepted by ARS its officers, employees or agents. The information
include the ARS Tactical Sector Allocation ETF Strategy & ARS Focused ETF contained herein is current as of the date hereof but may become outdated or
Strategy, ARS Fixed Income ETF Strategy & ARS Growth Allocation ETF Strategy– subsequently may change. ARS does not undertake any obligation to update the
0.70% per annum of the first $5 million and 0.50% per annum of the next $20 million information contained herein in light of later circumstances or events. This document
and to be discussed thereafter; Institutional Accounts which include the ARS Tactical contains general information only and is not intended to be relied upon as a forecast,
Asset (Balanced) Strategy– 0.80% per annum of the first $25 million and 0.70% per research, investment advice, or a recommendation, offer or solicitation to buy or sell
annum of the next $25 million and to be discussed thereafter. Fixed Income Accounts any securities or to adopt any investment strategy. Nothing in this presentation
which include the ARS Core Fixed Income Strategy– 0.50% per annum of the first $15 constitutes financial, legal, or tax advice. This information is property of ARS and is
million and 0.35% per annum of the next $15 million and to be discussed thereafter. intended only for intended recipients and their authorized agents and representatives
The management fees for certain clients may differ from the above schedule because and may not be reproduced or distributed to any other person without prior written
those clients’ fees are grandfathered or because of relationships with the applicant or consent. Any distribution to social media is a willful violation of the confidential and
other accounts. For institutional accounts, certain asset or fee minimums may apply. regulatory strictures that govern this document.
Internal Dispersion – Internal dispersion is calculated using the asset-weighted Composite performance is shown gross of fees. The historical index performance
standard deviation of annual returns of all portfolios in the composite for the entire results are provided exclusively for comparison purposes only. It is not possible to
year. Dispersion is not presented for periods less than one year or when there were invest directly in an index. It should not be assumed that any account holdings will
five or fewer portfolios in the composite for the entire year. The Annualized 3-Year correspond directly to any comparative index reflected herein.
Standard Deviation is not presented for composites with less than a 36-month return.
Also, the standard deviation is not presented and not is required, for periods prior to The information contained herein (1) is proprietary to Informa Enterprise Solution PSN
2011. and/or its content providers; (2) may not be copied or redistributed; and (3) is not
warranted to be accurate, complete, or timely. Other data provided may be based
Basis of Presentation – Rates of return presented are computed using a time- upon information received from third parties which is believed to be accurate, but no
weighted rate of return methodology that adjusts for external cash flows. Total rate of representation is made that the information provided is accurate and complete. Please
return calculations includes realized and unrealized gains and losses, plus income, be sure to refer to your custodial account statement(s) as the true and accurate record
and cash and cash equivalents held. Gross performance returns are presented after of your portfolio holdings and transactions.
transaction costs and before investment management fees and all operating costs.
Net performance returns are presented after transaction costs and actual investment All data is subject to change.
management fees and before all operating costs. However, gross performance for the
ARS Core Equity Composite is presented as gross and net performance is actual Not FDIC-Insured. Not Bank-Guaranteed. May Lose Value.
investment management fees and after all operating costs and the gross returns are
presented as supplemental information. Operating costs include custodian and
administrative fees. Additional information regarding policies for valuating portfolios,
calculating performance, and preparing compliant presentations are available upon
request. Performance results for periods of less than a year are not annualized.
35You can also read