Bus or Rail? Finding the right solution for Hamilton's A Line
←
→
Page content transcription
If your browser does not render page correctly, please read the page content below
Bus or Rail? Finding the
right solution for
Hamilton’s A‐Line
Cost‐Benefit Analysis
An assessment of rapid transit choices for the proposed A‐Line, including
projections for ridership and population growth, technology (BRT or LRT), and
routing based on a practical cost/benefit analysis of different scenarios for the
City of Hamilton’s contribution to the project’s capital cost. The B‐Line is similarly
examined, for comparative purposes, with final recommendations for both routes.

   Image from Hamilton Rapid Transit, with modification.

                                                                       Ian Dunlop
                                                           University of Waterloo
                                                                      12/21/2011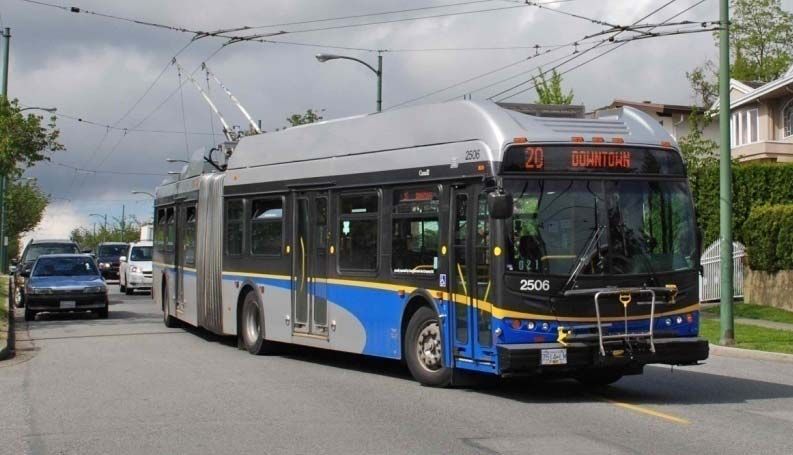
Bus or Rail? Finding the right solution for Hamilton’s A‐Line                                              2

   Bus or Rail? Finding the right solution for Hamilton’s A‐Line
                                                     December 21, 2011

                                                    Ian Dunlop
                                  MAES Candidate, Local Economic Development
                                School of Environment, Enterprise and Development
                                               University of Waterloo

                                              And presented to the
                         City of Hamilton Rapid Transit Team, Public Works Department

           © 2011 Ian Dunlop / Strategic Interchange, Div. of Dun‐Map Inc. (ian@strategicinterchange.ca)

ABSTRACT

The City of Hamilton is currently planning two rapid transit lines, the A‐Line and the B‐Line to be
completed within the next 10 to 15 years as part of Metrolinx’s “The Big Move” Plan. A recommendation
on the technology to be used, bus rapid transit (BRT) or light rail (LRT), for the A‐Line, between Hamilton
Harbour and Hamilton International Airport, has not yet been determined. This paper addresses the
question of which technology, LRT or BRT, is the best choice for the A‐Line. A cost‐benefit analysis of the
two systems is conducted, looking at the capital and long‐term operating costs, projected population
and ridership, funding scenarios, and local tax assessment impacts. It is well documented that BRT has
higher operational costs than LRT for high‐volume routes. Due to the high existing ridership on the B‐
Line, Hamilton will gain substantial benefits from building an LRT along this route as soon as possible,
with a minimum of 75% of the capital cost funding from Metrolinx. For A‐Line, due to the much lower
ridership, a phased approach for LRT is more appropriate. The first phase is completion of the core
section through Downtown to Mohawk College by 2026, and the remainder of the route phased in
between 2031 to 2036. However, to avoid a related property tax increase, the City’s maximum capital
contribution to a full A‐Line LRT project is just 10%. BRT could be used as an interim measure on the A‐
Line, but the significantly higher operating cost compared to LRT makes BRT more expensive in the long‐
run. The cost to the City of not building LRT, and instead choosing BRT, is $235,511,403 for A‐Line, and
$336,444,860 for B‐Line, with full capital funding from Metrolinx.

Strategic Interchange ©2011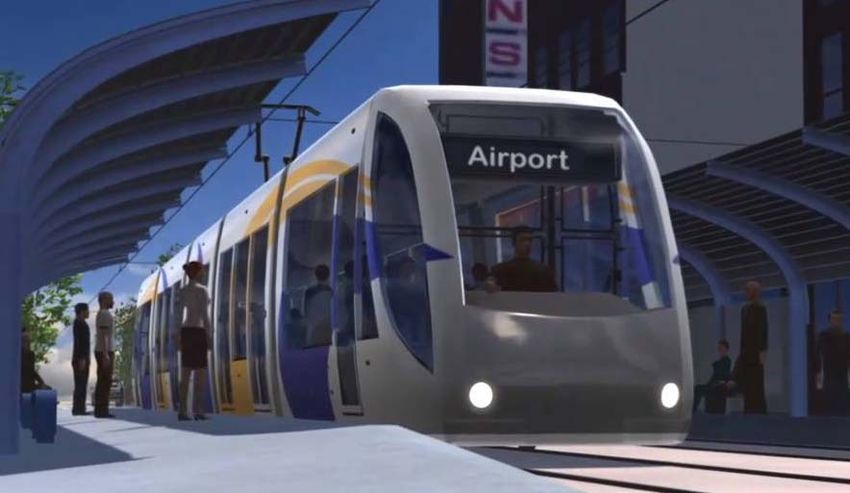
Bus or Rail? Finding the right solution for Hamilton’s A‐Line 3
TABLE OF CONTENTS
1. Introduction .......................................................................................................................................... 5
2. The History of the HSR and Rapid Transit in Hamilton ......................................................................... 6
3. HSR Transit System Profile .................................................................................................................... 8
4. Rapid Transit Corridors ......................................................................................................................... 9
A‐Line ............................................................................................................................................. 9
B‐Line ........................................................................................................................................... 11
5. Corridor Demographics ....................................................................................................................... 12
Population ................................................................................................................................... 12
Transit Ridership .......................................................................................................................... 14
Current A‐Line & B‐Line Ridership ............................................................................................... 15
6. Technology Choices ............................................................................................................................ 16
Environmental Benefits ............................................................................................................... 18
7. Population & Ridership Projections .................................................................................................... 19
Population ................................................................................................................................... 19
Ridership Projections ................................................................................................................... 21
8. Cost/Benefit of LRT vs. BRT ................................................................................................................. 23
Capital Costs ................................................................................................................................ 23
Operating Costs ........................................................................................................................... 24
Cost/Benefit Model Parameters .................................................................................................. 24
Results ......................................................................................................................................... 26
9. Conclusions ......................................................................................................................................... 31
References ................................................................................................................................................ 34
LIST OF FIGURES
Figure 1 ‐ Hamilton's Original “Light Rail Transit” Network, 1874‐1951 (Tweed & McNeil, 2011) ............................... 7
Figure 2 ‐ Hamilton Rapid Transit Network conceptual plan (Hamilton Rapid Transit, 2011) ...................................... 7
Figure 3 ‐ HSR Ridership, Revenues and Operating Costs (CUTA, 2008, pp. 84‐85; CUTA, 2010, pp. 38‐39, Hamilton,
2010b) ........................................................................................................................................................... 8
Figure 4 ‐ Site of James North GO Station ..................................................................................................................... 9
Figure 5 ‐ TH&B Railway Bridge at Hunter Street .......................................................................................................... 9
Figure 6 ‐ James Street, looking towards Downtown .................................................................................................... 9
Figure 7 ‐ Upper James St. Welcome to suburbia! ........................................................................................................ 9
Figure 8 ‐ At the base of James Mtn. Rd. Location for a tunnel entrance? ................................................................. 10
Figure 9‐ King Street at Wentworth (B‐Line) A Better Density for LRT? ..................................................................... 11
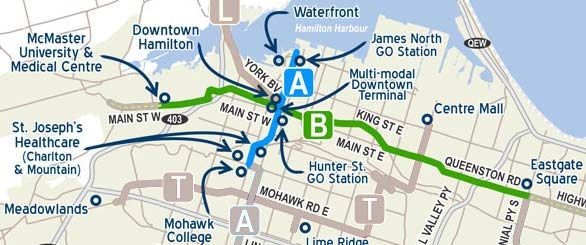
Figure 10 ‐ Rapid Transit Corridor detail map ............................................................................................................. 12
Figure 11 ‐ Population Density Comparison (Statistics Canada, 2011 and City‐data.com) ......................................... 13
Figure 12 ‐ A‐Line Core (Phased) Option (Hamilton Rapid Transit, 2011, With Modification) .................................... 16
Figure 13 ‐ LRT Operating in Portland, OR. Photo: Ian Dunlop .................................................................................... 16
Strategic Interchange ©2011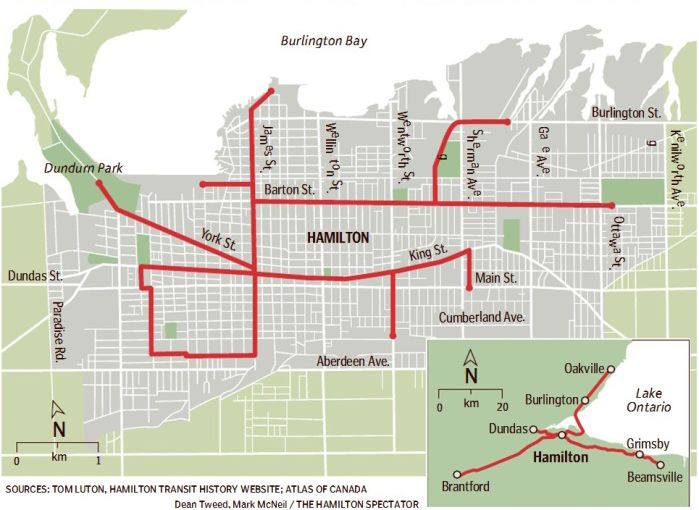
Bus or Rail? Finding the right solution for Hamilton’s A‐Line                                                                                                    4

Figure 14 ‐ Current HSR BRT Service Along the B‐Line. Photo: Cindy Slinn, HSR ......................................................... 17
Figure 15 ‐ Translink Articulated Trolley, Mfr. by New Flyer Industries. Photo: Steve Morgan .................................. 17
Figure 16 ‐ Linear Regression Projection for A‐Line Population (Actual based on Statistics Canada Census data,
           compiled by tract, 1986‐2006) ................................................................................................................... 19
Figure 17 ‐ Linear Regression Projection and Modified Projections for B‐Line Population (Actual based on Statistics
           Canada Census data, compiled by tract 1986‐2006) .................................................................................. 20
Figure 18 ‐ Linear Regression Projections for HSR Ridership ....................................................................................... 22
Figure 19 ‐ Comparison of BCR for A‐Line & B‐Line LRT/BRT Options ......................................................................... 28

LIST OF TABLES

Table 1‐ HSR Service Summary Statistics (CUTA, 2010, pp. 38) ..................................................................................... 8
Table 2 ‐ A‐Line LRT Route Options ............................................................................................................................. 10
Table 3 ‐ Population, Census Tract Area and Population Density (StatCan, 2011a) .................................................... 13
Table 4 ‐ HSR Daily and Yearly Boardings and Revenue Passengers............................................................................ 14
Table 5 ‐ A‐Line and B‐Line Corridor Total bus stop Boarding ..................................................................................... 15
Table 6 ‐ Annual A‐Line and B‐Line Boarding Volume ................................................................................................. 16
Table 7 ‐ Carbon Footprint of BRT vs LRT, related to current HSR Fleet ..................................................................... 18
Table 8 ‐ Projected Passenger Boardings..................................................................................................................... 22
Table 9 ‐ Summary of Cost/Benefit Model Input Parameters ..................................................................................... 26
Table 10 ‐ A‐Line LRT, BRT & Trolley Results ............................................................................................................... 27
Table 11 ‐ B‐Line LRT & BRT Results ............................................................................................................................ 27
Table 12 ‐ A‐Line Core LRT Routing Option Results ..................................................................................................... 27
Table 13 ‐ BCR of Delaying A‐Line LRT by 10 Years ...................................................................................................... 28
Table 14 ‐ Cost/Benefit Input Parameters for City Debt‐Financed LRT ....................................................................... 29
Table 15 ‐ BCR Results for City Debt‐Financed LRT, With Assessment Impacts .......................................................... 30

Strategic Interchange ©2011
Bus or Rail? Finding the right solution for Hamilton’s A‐Line                                                  5

1. INTRODUCTION

The City of Hamilton is currently planning two rapid transit lines, the A‐Line and the B‐Line to be
completed within the next 10 to 15 years. Metrolinx has so far assured the City that the project will be
fully funded. But does the project still benefit the City if it has to contribute to the substantial upfront
cost? Which technology, LRT or BRT, is the best choice for the A‐Line? This paper addresses these
questions through a cost‐benefit analysis of the two systems, looking at the capital, long‐term operating
costs, and how the upfront capital construction costs could be shared with Metrolinx. These figures will
also be compared to the B‐Line. Linear regression modelling will be used to estimate population and
ridership growth along the transit corridor. Consideration will also be given to the environmental
benefits of the energy choice, and whether a BRT solution should use diesel or electricity.

The preferred A‐Line route also faces two challenges for LRT: a low‐clearance bridge downtown, and a
steep incline up “The Mountain”, as the Niagara Escarpment is called in Hamilton. The preferred route
may therefore only be suitable for BRT without extensive, and expensive, infrastructure modifications.
The currently proposed LRT route swings further east, to use an existing expressway up the mountain,
which has a shallower incline. A longer distance, and thus travel time, could detract potential riders from
travelling via A‐Line to Mohawk College, and the proposed James North GO Station, which will have all‐
day, two‐way GO Train service to Toronto in 2015.

To determine the operating and capital costs, project ridership and travel times, information was
compiled from some of the city’s own reports, reviews of rapid transit projects in other jurisdictions,
transit planning and economics guidelines, related articles and literature. The goal of this research is to
draw a clear recommendation for which technology, LRT or BRT, has the most benefit to the City of
Hamilton, under the right funding scenario. This paper’s findings will be presented to Hamilton’s Rapid
Transit team and transit staff.

The paper begins with a brief history of the Hamilton Street Railway (HSR), which as the name suggests,
once operated a network streetcars in the city. Now, Hamilton is coming full circle to renew this
technology in modern form. A profile of the current HSR system follows this introduction, along with
descriptions and demographic details of the two proposed rapid transit corridors, the A‐Line and B‐Line.

Current HSR ridership for this study has been derived from the author’s analysis of a comprehensive
database containing passenger boarding counts for each route and bus stop in the City, which was

Strategic Interchange ©2011
Bus or Rail? Finding the right solution for Hamilton’s A‐Line                                                 6

compiled as part of a 2010 HSR Operational Review. Special thanks to the HSR for making this raw
information available for this research. From this accurate data, the base ridership counts for existing
bus routes were tabulated for the A‐Line and B‐Line corridors.

Population and ridership estimates for the corridors were projected using linear regression. The results
were then modified to suit targeted population and ridership growth by 2031. Capital and operating
costs estimates are based on equivalent numbers available for the B‐Line, with adjustment for the
different service characteristics of A‐Line.

A very comprehensive cost benefit analysis for both routes was then conducted, using these data, and
other parameters for inflation, growth, discounting and interest over a 25‐year period, starting in 2021.
Results were calculated for LRT, BRT and Trolley options, different routes and project phasing. The City
of Hamilton is concerned about the impact on local property taxes if the City has to cover any portion of
the upfront capital costs. A cost benefit analysis of a debt‐financed City contribution is thus considered,
to determine this impact, and draw the final conclusions.

2. THE HISTORY OF THE HSR AND RAPID TRANSIT IN HAMILTON

Transit service in Hamilton is provided by the Hamilton Street Railway (HSR). As the name suggests,
public transit in Hamilton started with streetcars, operating on rails. The first horse‐drawn streetcars
came into service in 1874, and the adult fare was 5 cents. (Manson, 2002, pp. 25) The streetcars were
electrified in 1890, and Hamilton became known as “The Electric City” (Gilbert, 2006), and continued
operation along a network spanning the city and into the surrounding communities, see Figure 1. Inter‐
city service was discontinued in 1932 (pp. 33), and urban streetcar service ended in 1951, replaced by
electric trolley buses. Although the HSR also had a growing fleet of diesel buses, the trolleys operated
until 1992. The HSR was first to test pilot a new bus technology in 1985, compressed natural gas (CNG).
A fleet of CNG buses soon replaced the electric trolleys, thanks to generous government subsidies at the
time (Milner, 2009). Due to higher maintenance costs and lower reliability than diesel buses, and an end
to the subsidies, the HSR’s CNG fleet is gradually being phased out as the buses reach the end of their
service life, and being replaced by hybrid‐diesel technology.

Strategic Interchange ©2011
Bus or Rail? Finding the right solution for Hamilton’s A‐Line                                                                                7

Concepts for rapid transit in Hamilton can be
traced back from the 1960’s through the early
1980’s, including monorails, and an “Intermediate
Capacity Transit System” or ICTS, on which the
Scarborough RT in Toronto and the SkyTrain in
Vancouver are based (City of Hamilton, 2009, citing
Metro Canada, 1981). Due to an outcry over the
project’s cost and controversial routing, the plan
was shelved.                                                            Figure 1 ‐ Hamilton's Original “Light Rail Transit” Network, 1874‐
                                                                                          1951 (Tweed & McNeil, 2011)

In 2006, the Provincial Government created what
was to be an arms‐length agency to develop, fund and implement transportation solutions for Greater
Toronto. Rebranded as Metrolinx, the agency introduced “The Big Move” in 2008, an ambitions 25‐year
plan to develop a network of rapid transit routes across the Greater Toronto & Hamilton Area (GTHA).
Included in this plan are two urban rapid transit lines in Hamilton, along with commuter GO Train service
improvements (Metrolinx, 2008).

The first rapid transit route, the B‐Line is based on an already existing rush‐hour BRT route in Hamilton
called the Beeline, which was introduced in 1989. The new name is likely a result of a desire to adopt a
more conventional naming system for Hamilton’s BRT routes, as the second of the proposed routes is
called the A‐Line, not the “Ehline”.

                                                                                      In response, the City of Hamilton
                                                                                      created a Rapid Transit Team and
                                                                                      entered into an agreement with
                                                                                      Metrolinx to begin detailed planning of
                                                                                      these transit corridors. A conceptual
                                                                                      plan for a network of rapid transit
                                                                                      routes across the city was developed,
                                                                                      and dubbed the “BLAST” network. See
                                                                                      Figure 2.

            Figure 2 ‐ Hamilton Rapid Transit Network conceptual plan
                          (Hamilton Rapid Transit, 2011)

Strategic Interchange ©2011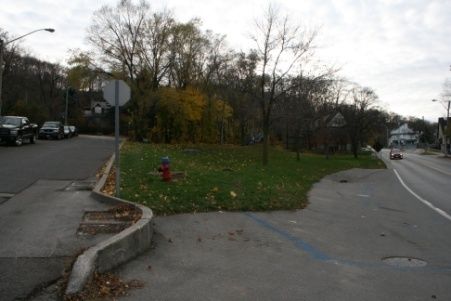
Bus or Rail? Finding the righ
ht solution for Hamilton’s A‐Linee 8
3. HSR TRANSIT SYSTEM
S PR OFILE
The 2010 Transit Fact Book,
B publish
hed by the Canadian Urban
n Transit Asso
ociation, provvides some reecent
statistics for
f the HSR’s operations (ssee Table 1). HSR annual ridership,
r reveenues and exxpenses are
graphed in Figure 3 (CU
UTA, 2008, 20
010). The HSR
R had a fare in
ncrease in 20
010, as shown
n by the increase
ue. Rising oil prices
in Revenu p have pu
ut increasing upward presssure on operrating costs, as
a indicated by
b the
trend, wh
hich shows no
o sign of reverrsing. Figures for 2011 are based on HSSR’s projections of 3.2%
ridership growth, repo
orted by HSR staff,
s and a 1.7% budget in
ncrease for 20
011 (City of Hamilton,
H 201
10b).
Table 1‐ HSR Service Sum
mmary Statistics (C
CUTA, 2010, pp. 38)
Annual Rid
dership 21,2
226,393 Reve enue Passenggers
Total Operrating Revenuues $34
4,853,496
Total Operrating Expensses $67
7,776,313
Cost Recovvery 51%
% ($1.59 revenue / $3.19 expenses
e per
passenger)
Bus Fleet Composition:
C 217
7 Buses
141
1 Diesel, including 25 Articulated (60’)
76 CNG
C
City of Ham
milton Populaation 504
4,559 (StatCan
n, 2006 Censu
us)
HSR Operation
ns Profile, 2008‐2011
1
80,,000,000
Revenue & Operating Costs (in $)
Ridership (Revenue Passengers),
70,,000,000
60,,000,000
50,,000,000
40,,000,000 Ridership
30,,000,000
Revenue in $
20,,000,000
Operatingg in $
10,,000,000
0
2008 2009 2
2010 2011 2012
Y
Year
Figurre 3 ‐ HSR Ridersh
hip, Revenues and Operating Costs
(CUTA, 20
008, pp. 84‐85; CUUTA, 2010, pp. 38‐‐39, Hamilton, 201
10b)
Strategic Intterchange ©201
11
Bus or Rail? Finding the right solution for Hamilton’s A‐Line 9
4. RAPID TRANSIT CORRIDORS
A‐LINE
The A‐Line runs from the Hamilton Harbour waterfront in the north,
to Hamilton International Airport in the south. The route passes the
proposed James Street North GO Train Station, Figure 4, which will be
the home of all‐day GO Train service to Toronto by 2015, and the
Hamilton GO Centre bus terminal, which currently has 4 GO Train
trips per day. Statistics Canada (2003) reported that one in ten
Figure 4 ‐ Site of James North GO Station
workers in Hamilton are commuting to work outside of the City,
mostly to Toronto, and this proportion is likely now much higher.
Therefore, an efficient local transit connection to these GO Stations is
important to encourage “smart commuting” with Toronto, in both
directions.
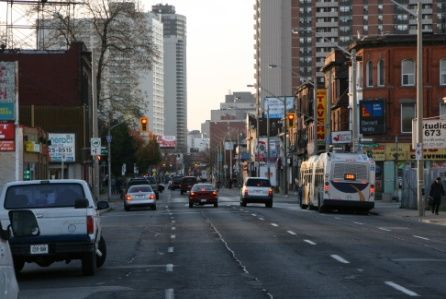
The A‐Line line also goes through downtown, and serves Mohawk
Figure 5 ‐ TH&B Railway Bridge at Hunter
College once atop the Mountain. The area between the waterfront Street
and the College has a high population density, Figure 6, as with the B‐
Line, but south of the College, the density is much lower. The route
goes through suburban areas and undeveloped rural land along
Upper James Street, Figure 7, on its way to the Airport. See Figure 10
for more details.
Express bus service was introduced on the A‐Line in 2010, with a 30‐
minute frequency during rush hours. This route, along with 3 regular Figure 6 ‐ James Street, looking towards
Downtown
service HSR routes (21, 33, and 35), operate between Downtown and
the College, with up to 10‐minute frequency during peak periods.
Route 27 serves the Upper James section, as far south as the
Mountain Transit Garage, with 15‐minute frequency during peak
periods and 30‐minutes off‐peak.
Figure 7 ‐ Upper James St.
Welcome to suburbia!
Strategic Interchange ©2011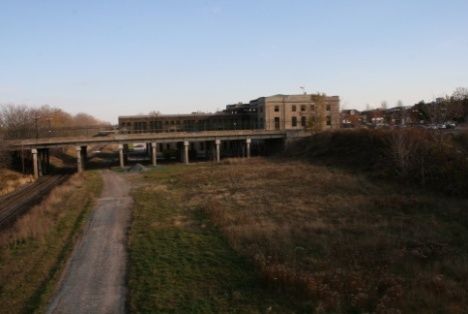
Bus or Rail? Finding the right solution for Hamilton’s A‐Line                                                                     10

There are two constraints along the A‐Line corridor that may impede
LRT technology. The first is the low‐clearance, narrow bridge on
James Street South at Hunter Street, Figure 5. The roadway, on either
side of the centre supports, is too narrow for two‐way rail. However,
replacement of this inadequate structure, built in 1933 (Mason,
2002) could be a warranted capital cost. A 2008 Feasibility Study
proposed lowering the road bed below the existing bridge is also                             Figure 8 ‐ At the base of James Mtn. Rd.
                                                                                                 Location for a tunnel entrance?
feasible (McCormic, 2008)

The second impediment is the Niagara Escarpment, the Mountain, Figure 8. James Mountain Road, with
its 10.7% grade (McCormic, 2008), is too steep for LRT. Iron wheels on iron rails lack the traction to
ascend or descend steep grades safely. Ironically, it is this lack of resistance that makes rail a smoother,
more energy efficient mode of transport than rubber‐tired vehicles. There are 3 possible solutions:

          1. Build a tunnel between James St and Mohawk College, a.k.a. subway, at a cost of
             pproximately $260 million (McCormic, 2008), a solution potentially inflammatory to
             neighbourhood residents environmentalists.
          2. Install a secondary traction technology, such as a cable or cog system along the steep
             portion of the incline. (Rapid Transit Office, 2009)
          3. Re‐route the LRT to the Claremont Access, which as a suitable 5% grade but increases the
             travel distance between Downtown and the College by 60% (see Table 2, and map Figure
             10), which shows this alternate A‐Line LRT routing. With such an impediment, the LRT may
             have difficulty competing for riders from the more direct, regular bus routes between
             Downtown and the College, and for Mountain commuters to the proposed James North GO
             Station. Due to the longer distance, laying more track, and related infrastructure upgrades,
             the cost saving is just $100 million, compared to Option 1 (McCormic, 2008). HSR
             operational costs will also be higher, due to the additional LRT distance, and because
             conventional bus service along James Street would still have to be maintained.

                                                 Table 2 ‐ A‐Line LRT Route Options

A‐Line Route Options           Downtown to College                                    Waterfront to Airport
                               Distance  Trip Time               Difference           Distance    Trip Time           Difference
via James Mtn. Road            2.7       8 minutes                                    16.3        35 minutes
via Claremont Access           4.5       12 minutes              150%                 18.0        39 minutes          111%
Trip times are based on the following methodology for speed and distance:
James Mountain Road: 1km @ 50km/h from base of Mountain to Brantdale, and 1.7km @ 15km/h through Downtown and in
the vicinity of Mohawk College, where stopping will be frequent.
Claremont Access: 2km @ 70km/h for Claremont Access and its approaches, and 2.4km @ 15km/h through Downtown and the
International Village (King Street East) bottleneck, and in the vicinity of Mohawk College.
An average speed of 30 km/h was used for the rest of the A‐Line route from Waterfront to Airport.

Strategic Interchange ©2011
Bus or Rail? Finding the right solution for Hamilton’s A‐Line 11
B‐LINE
The B‐Line runs from McMaster University in the west, to Eastgate
Square in the east, through the heart of Downtown Hamilton. The
corridor is the HSR’s busiest, and traverses the most densely
populated areas of the city. The downtown and McMaster University
are the biggest transit ridership draws in the city. The route follows
Main Street, to King Street, back to Main Street and Queenston Road. Figure 9‐ King Street at Wentworth (B‐Line)
A Better Density for LRT?
Most of Main and King Streets are one way, so each direction of the
current B‐Line bus service is split between them. The corridor is also served by Route 1–King and
variations of the Route 5/51 Delaware/University, with 6‐7 minute frequency most of the day. The
proposed B‐Line rapid transit route will consolidate these routes, and run in both directions in a
dedicated right‐of‐way along King Street, with a 4 minute peak headway.
Planning for the B‐Line is very advanced, compared to the A‐Line. As of the end of 2011, the B‐Line
Environmental Assessment and 30% detail design specification will be completed. This work is
proceeding on the basis of LRT being the preferred technology for B‐Line. As will be demonstrated in the
analyses to follow, LRT is a logical choice with the greatest benefits due to the high population and well‐
established transit ridership along this corridor. Will LRT similarly be a clear winner for the A‐Line?
It should also be noted that the HSR is currently planning for a new BRT route that will utilize the city’s
expressway network to connect major hubs on the Mountain to the east and west ends of the City.
Currently, the HSR’s transit network is focused primarily on the downtown, and the majority of bus
routes from the Mountain terminate there. The 2010 HSR Operational Review identified a new
Crosstown Express, Route 100, which will connect with the B‐Line at McMaster and Eastgate, and the A‐
Line at Upper James and the Lincoln Alexander Parkway. This route is shown on Figure 10.
Strategic Interchange ©2011Bus or Rail? Finding the right solution for Hamilton’s A‐Line 12
Figure 10 ‐ Rapid Transit Corridor detail map
5. CORRIDOR DEMOGRAPHICS
POPULATION
An analysis of the populations of the Statistics Canada Census Tracts along these corridors reveals that
these 2 routes directly serve 35% of Hamilton’s population. Table 3 provides a summary of the
population and density, along with a comparison of Waterloo’s recently approved iXpress LRT corridor
between Conestoga and Fairview Park Malls, and the combined A ad B Line corridors. The “A‐Line Core”
is the section of the route south as far as Mohawk College only. Table 3 shows the very high density of
population in this north‐end “core” section compared to the route as a whole, see Map, Figure 12.
Strategic Interchange ©2011Bus or Rail? Finding the righ
ht solution for Hamilton’s A‐Linee 13
Table 3 ‐ Populattion, Census Tract Area and Populattion Density (StatC
Can, 2011a)
Corridor Po
opulation Area (kkm2) Density /sq km
A‐Line 81
1,603 53.97 1,512
B‐Line 12
24,433 31.27 3,979
A & B Line
es 17
77,662 79.90 2,223
A‐Line Corre 38
8,681 8.50 4,551
iXpress (K
KW) 77
7,140 42.51 1,815
Concern was
w raised on
n local talk rad
dio and news media duringg the summer of 2011 as to
t whether orr not
the population densityy in Hamilton was sufficien
nt to support LRT, referringg to a Statisticcs Canada’s 2006
2
census figgure for the city, which inccludes Hamilto
on’s vast ruraal area. This statistic
s was compared
c to the
t
urban den
nsity of the city of Portland
d, Oregon, wh
here LRT has been a great success. Figu
ure 11 shows the
populatio
on densities fo
or the 2 rapid
d transit corrid
dors, as per Table
T 3, alongg with densitiees from 5 oth
her
municipallities for comparison, inclu
uding Portland. The density along the B‐Line
B is comp
parable to
Toronto’ss urban densitty. However, population density along the A‐Line falls short, outsside of the A‐Line
Core areaa, which could
d be of concern in evaluatiing the cost/b
benefit LRT an
nd BRT.
Populaation Denssity
Other Urban Areas
Calgary
Toronto
Montreal
M
Bufffalo, NY
Portlland, OR
I‐Xpre
ess (KW)
B‐Line
RT Corridors
A‐Line
A‐Line Core
A&
&B Lines
0 5
500 1000 150
00 2000 2500
0 3000 3500 4000 4500 5
5000
Number of peop
ple per km2
Figgure 11 ‐ Populatio
on Density Compaarison (Statistics Canada,
C 2011 and City‐data.com)
Strategic Intterchange ©201
11Bus or Rail? Finding the right solution for Hamilton’s A‐Line 14
TRANSIT RIDERSHIP
As part of the 2010 HSR Operational Review, a detailed boarding survey was conducted by IBI Group in
the Fall of 2008 and Winter of 2009. Each bus route was surveyed over a complete service cycle
(Weekday, Saturday and Sunday, from beginning to end of service). GPS coordinates were tracked to
cross‐reference boardings automatically with standardized bus stop locations. Fare payment categories
were also tracked. The result is a very comprehensive database with passenger boardings across the
entire system. A special thank‐you to HSR staff for making this database available, and for their
cooperation on this project. Without this data, the results of this report would not be so meaningful.
The total daily boardings derived from this database, and by further extrapolation to yearly boarding
figures, are in Table 4. The Boarding data included all of the different fare types and noted special
characteristics of the rider, such as whether they loaded a bicycle, or were in a wheelchair. Those types
of boardings were double‐counted, so the totals were adjusted by factoring in fare versus non‐fare
boardings. Transfers were also tracked, so the total boardings were adjusted by the transfer rate
applicable to ticket and cash fares, in order to arrive at a revenue‐passenger number. Through a further
analysis of the proportions of fare categories by boarding, an average revenue per boarding of $1.40
was determined, based on an adult cash fare of $2.55, ticket fare of $2.00, a range of $1 to $2 for the
various types of passes, and zero for “Free” boarding categories and transfers.
The reported HSR revenue‐passenger ridership in 2008 was 20,952,826, (CUTA, 2008) and the total
adjusted boardings from the database is 21,252,451 revenue‐passengers, a discrepancy of only 1.4%.
Considering that the database represents a sampling of just 3/365 days for each route, this data is very
reliable!
Table 4 ‐ HSR Daily and Yearly Boardings and Revenue Passengers
Day Boarding Days/Yr Total
Weekday 110,210 260 28,654,600
Saturday 50,979 52.5 2,676,397
Sunday 32,200 52.5 1,690,500
Annual Total 33,021,497
Adjustment for 35.64% of boardings 21,252,451
Transfers Revenue Passengers
Strategic Interchange ©2011Bus or Rail? Finding the right solution for Hamilton’s A‐Line 15
CURRENT A‐LINE & B‐LINE RIDERSHIP
The tabulation of ridership for the A‐Line and B‐Line for this report began by identifying all of the bus
stops along the corridors, and cross‐referencing to the different routes currently servicing them. A series
of queries were then executed to find the total ridership for each corridor. Care was taken to ensure the
most relevant data was captured for routes such as Delaware/ University, which have a number of
routing variations and also service areas beyond the B‐Line corridor. Another example is James Street
North, where only Route 2 in‐bound data was used, because out‐bound riders are unlikely have the A‐
Line corridor as their destination, and transfers would be captured at the Downtown terminal stops. The
results by route, service level and the total for each corridor are shown in Table 5.
Table 5 ‐ A‐Line and B‐Line Corridor Total bus stop Boarding
Current A‐Line Route‐Specific Passenger Boardings
Route Captured Weekday Boarding Weekday, Sat. & Sun. Boarding
Route 27 (Upper James) 3,118 6,571
Downtown to College (20, 21, 33, 35) 7,122 11,524
James North (2, 4) 826 1,483
Total 11,066 19,578
Current B‐Line Route‐Specific Passenger Boardings
Route Captured Weekday Boarding Weekday, Sat. & Sun. Boarding
Route 1 (King) 15,461 32,198
Route 10 (B‐Line Express) 7,023 7,023
Route 5/51 (Delaware/University) 13,518 25,886
Total 36,002 65,107
A new passenger boarding survey was conducted by the HSR at Mohawk College in March, 2011, which
showed that ridership to/from the college had increased by between 68% and 84% due to increased
enrollment at the College. For the purposes of the boarding data used for this research, the Downtown
to College weekday boarding total in Table 5 was increased by 1,100, a rounded median value to
account for the increase at the College.
Total annual boarding was calculated by multiplying the Weekday value by 260, the number of
weekdays in a typical year, and the Saturday & Sunday value by 105, the number of weekend days in a
Strategic Interchange ©2011Bus or Rail? Finding the right solution for Hamilton’s A‐Line 16
year. The result is shown in Table 6. The “A‐Line Core” is the passenger boarding volume for the north
section of the A‐Line between the Waterfront and Mohawk College only, see Figure 12.
Table 6 ‐ Annual A‐Line and B‐Line Boarding Volume
Total Annual Passenger Boardings % of Total HSR
A‐Line 3,319,784 10%
A‐Line Core 2,329,548 7%
B‐Line 10,873,980 33%
Figure 12 ‐ A‐Line Core (Phased) Option
(Hamilton Rapid Transit, 2011, With Modification)
6. TECHNOLOGY CHOICES
The two rapid transit technology choices for Hamilton are
Light Rail Transit (LRT) and Bus Rapid Transit (BRT). LRT,
Figure 13, has a high initial capital cost, due to the
installation of tracks and overhead wires, compared to
BRT, which can operate on normal roadways. The inverse
is true for operational costs. LRT is less expensive to
operate, because each train has a higher passenger
Figure 13 ‐ LRT Operating in Portland, OR. Photo: Ian
Dunlop
capacity than an articulated (high‐capacity) bus, therefore
the labour cost for the vehicle operator is cheaper on a per‐passenger basis. The life cycle of an LRT train
is typically 25 to 30 years, but only 17 years for a bus (City of Vancouver, 2006, pp. 2). An October 13,
2011 city staff report to Hamilton City Council posits that operating LRT on the B‐Line will result in 18
buses being removed from the HSR network, resulting in annual savings of $5.7 million (Hamilton, 2011).
Strategic Interchange ©2011Bus or Rail? Finding the right solution for Hamilton’s A‐Line 17
The HSR currently operates an express bus service along the B‐
Line with hybrid‐diesel articulated buses; see Figure 14. The
difference between the current level of service and a full BRT
system, is the latter provides more efficiency and passenger
amenities such as dedicated lanes, station‐style bus stops,
traffic signal priority, and real‐time information systems.
Figure 14 ‐ Current HSR BRT Service Along the B‐
Line. Photo: Cindy Slinn, HSR
LRT takes the efficiencies and amenities of BRT system further,
by operating in a dedicated right‐of‐way, offering a smoother, quieter, more comfortable ride and
thereby a better overall passenger experience. Much of the literature also touts the psychological
factors that play a role in the popularity and increases in ridership associated LRT. The curb lane of city
streets, the one buses use most, tend to be the roughest and most pot‐holed, and are sloped for water
drainage, resulting in a bumpy, rattled ride for bus passengers. People want “a feeling that transit is an
important part of exciting urban living.” (Vuchic, 2005, pp. 553)
Another possible choice, which does not yet
appear to have been explored in detail
during the current planning process, is a
return to electric trolley buses. Translink in
Vancouver operates a fleet of 228 trolleys,
which is about the same size as Hamilton’s
entire bus fleet of 217 (CUTA 2008, 2010).
Although trolleys cannot claim the same, Figure 15 ‐ Translink Articulated Trolley, Mfr. by New Flyer Industries. Photo:
Steve Morgan
smooth ride as LRT trains, they are very quiet
compared to diesel buses. Trolleys are also a smoother ride than diesel buses because they do not
require a transmission, which causes the bus to lurch as it changes gears. Trolleys have obvious flexibility
advantages to LRT because they can change lanes, and maneuver around disabled vehicles, whereas an
LRT does not have such capability when the track is blocked. Translink recently purchased a new fleet of
articulated trolleys from New Flyer industries, which have proved to be very popular with riders.
The new, articulated trolleys were purchased in 2005 at a cost of approximately $1.2 million each, while
articulated diesel‐hybrid buses cost is $1 million each. LRT trains are $3 to $5 million each (Metrolinx,
Strategic Interchange ©2011Bus or Rail? Finding the right solution for Hamilton’s A‐Line 18
2008). Trolleys last longer, and the energy costs are 56% lower, compared to diesel buses. (Gilbert &
Perl, 2010, citing Anderson, P.G.)
ENVIRONMENTAL BENEFITS
Energy choice also favours electric propulsion. Oil prices have fluctuated wildly since 2008, resulting in
high diesel fuel costs. As noted earlier in this paper, there are no longer incentives for the HSR to
continue operation of their natural gas fleet after the current CNG fleet is fully retired.
However, the LRT’s electric power can claim zero‐emissions at source, due to Hamilton’s proximity to
Niagara Falls. Therefore, not only does LRT offer operational cost savings through its inherently low
resistance and electric‐powered efficiency, it also offers significant environmental benefits. Table 7
shows the possible reduction in CO2 emissions for electric LRT/Trolley compared with diesel BRT on the
A‐Line and B‐Line. Diesel fuel consumption is based on the HSR’s reported fleet fuel consumption (CUTA
2010, pp. 38), with a 25% reduction to account for the claimed fuel economy benefits of hybrid‐diesel
buses.
Based on these figures, the HSR’s fleet CO2 emissions are currently 17,450 tonnes/yr, or 1.87 kg/km,
which could be reduced by 4,985 tonnes/yr, down to 1.47 kg/km with the use of electric vehicles on the
A‐Line and B‐Line. By comparison, Translink’s current fleet emissions are 1.36 kg/km (based on CUTA
2008, pp. 28). Interestingly, a car with a fuel economy of 6L/100km would produce 0.14 kg/km. These
emissions are based on 2.73 kg/L of diesel fuel and 2.36 kg/L of gasoline and 1.9kg/cubic metre of CNG
(Gilbert & Perl, 2010, pp. 175).
Table 7 ‐ Carbon Footprint of BRT vs LRT, related to current HSR Fleet
Route Vehicles Route Trips/Day Roundtrip L/100km Diesel Bus kg/day CO2 Tonnes LRT/Trolley
Length Travel (km) Consumption Emissions CO2/yr
(km) (L)
A‐Line 21.00 16.30 136.00 4,433.60 60.19 2,668.50 7,151.59 2,231.30 0.00
B‐Line 36.00 14.10 194.00 5,470.80 60.19 3,292.78 8,824.64 2,753.29 0.00
Total 57.00 30.40 330.00 9,904.40 60.19 5,961.28 15,976.23 4,984.58 0.00
System km/yr System Fuel kg/yr CO2 Tonnes/yr Reduction
Use
System 217.00 Buses 12,454,662.00 Diesel 6,494,436.00L 17,405,088.48 17,405.09
141.00 Diesel Nat Gas 3,103,648.00CM 5,896,931.20 5,896.93
76 CNG Total 23,302,019.68 23,302.02 ‐21.39%
Strategic Interchange ©2011Bus or Rail? Finding the righ
ht solution for Hamilton’s A‐Linee 19
Gilbert (2006), in a rep
port prepared
d for Hamilton
n City Councill, posits that by
b 2018, natu
ural gas and oil
o
on will peak, iff not earlier. This phenomenon known as “Peak Oil”” is expected to cause dram
productio matic
rises in th
he cost of all carbon‐based
c d energy, whicch will also haave a significaant impact on
n the HSR’s
operation
nal costs if the
ere are no acttions being taaken by then to adopt alteernatives.
7. POPU
ULATION & RIDERSH IP PROJECTTIONS
Populatio
on and ridersh
hip growth haave been projected to 2041 using a linear regression
n technique. As
A
was reveaaled through a lecture pressentation, linear regressio
on analyses th
he available sttatistical dataa to
calculate a trend, or a “line of best fit”.
f Although
h a simplistic approach, beecause no exttraneous facttors
dered, linear regression is a useful tool in predictingg future behavviour if the hiistorical trend
are consid d
continuess. As demonsttrated below,, the trend fro
om one result can be transsposed to ano
other, to develop
different “what if” scenarios.
POPULATTION
The population countss for the censu
us tracts used
d in Table 3 were
w compiled
d back to 198
86, giving us a 20‐
year popu
ulation profile
e up to the lasst Census in 2006.
2 Unfortu
unately, the 2011
2 census population
p daata
will not bee released byy Statistics Canada until February, 2012. The regression projections for the A‐LLine
and B‐Linee corridors arre shown in Figure
F 16 & Figure 17.
A‐Line Corridor
C P
Populatio
on Projecction
1
150000
1
125000
Population
1
100000
75000
50000
1981 1991 20
001 2011 2021 2031 2041
1
Year
R
Regression Treend Acctual 1986‐200
06
Figure 16
1 ‐ Linear Regresssion Projection fo
or A‐Line Populatio
on
(Actual based onn Statistics Canada Census data, coompiled by tract, 1986‐2006)
1
Strategic Intterchange ©201
11Bus or Rail? Finding the righ
ht solution for Hamilton’s A‐Linee 20
The trend
d for the A‐Lin
ne is for the population
p to continue incrreasing at a steady pace, as
a the city
continuess to expand its urban area southwards, particularly in the area beetween the Lincoln Alexander
Parkway and ort Employmeent Growth District. Some of the tracts in the A‐Line Core area
a the Airpo
experiencced a decline over the sam
me period. As a whole, the growth rate for
f the corrid
dor is
approximately 1.1% pe
er year.
The current growth tre
end for B‐Linee is not as pro pulation decline noted for the
ogressive. Thee gradual pop
A‐Line Core tracts is prresent in man
ny of the tractts along the B‐Line
B corrido
or. For many years,
y the
on decline hass mirrored a socio‐econom
populatio s mic decline in the “Lower City”.
C Howeveer, there is greeat
optimism for the rebirtth of these arreas, as can be hbourhoods like
b seen in sevveral up‐and‐ccoming neigh
Locke Streeet, James Street North an
nd Ottawa Strreet. The introduction of all‐day
a GO Traain service to the
new Jamees North station is expecteed to spark further rejuven
nation. Many,, including thee author, beliieve
that LRT along
a the B‐Liine is also an essential cataalyst to ensurre the long teerm vitality off the area, witth
spin‐off benefits for th
he entire City..
B‐Line Corridor
C P
Populatio
on Projecttions
220000
20
00000
Population
18
80000
16
60000
40000
14
120000
10
00000
1981 1991 20
001 2011 2021 2031 2041
Year
A
A‐Line Regressio
on Mod
dified Projectio
on
B‐Line Regressio
on Actu
ual 1986‐2006
Figure 17 ‐ Linear Regression Projectio
on and Modified Projections
P for B‐LLine Population
(Actual based on Statistics Canadda Census data, co
ompiled by tract 1986‐2006)
1
Although the regressio
on trend for the B‐Line corrridor populattion calls for decline,
d the Ontario
O Placess to
Grow Act (Ministry of Public Infrastructure Reneewal, 2006) caalls for a 30% population in
ncrease acrosss the
GTHA by 2031,
2 and at least 40% of this
t new grow
wth must be through
t inten
nsification of existing urbaan
Strategic Intterchange ©201
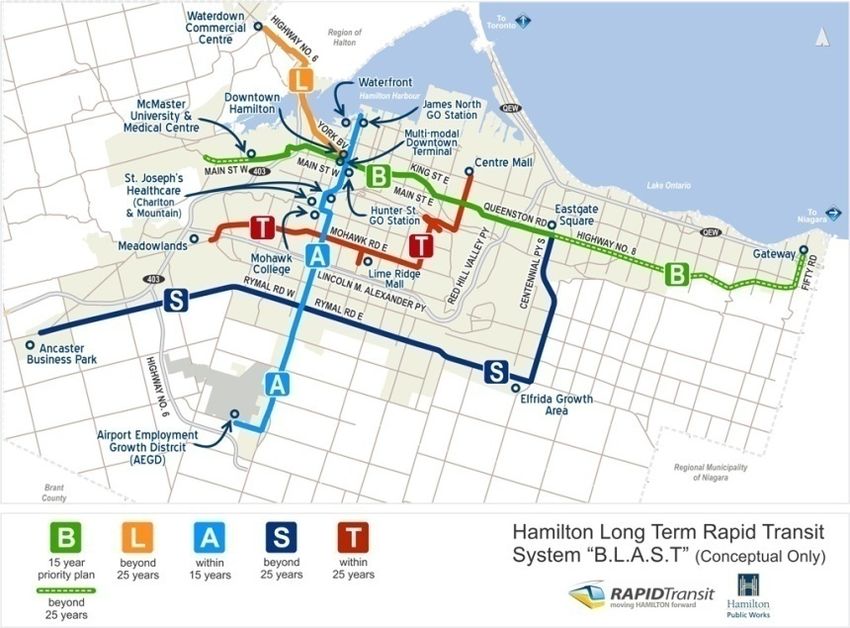
11Bus or Rail? Finding the right solution for Hamilton’s A‐Line 21 areas. The B‐Line corridor has great potential for intensification, with low real estate prices and new zoning on the way to foster redevelopment. The regression trend for the A‐Line is very close to the 30% population increase by 2031 target. This trend has been transposed to the B‐Line, and is represented by the green trend line in Figure 17. With this trend, population will increase from 125,600 today to 182,609 by 2041. The sudden shift to this growth trend will not happen overnight, so the modified projection line, shown in purple, plots a more gradual curve towards this ultimate trend. RIDERSHIP PROJECTIONS Overall ridership growth on the HSR has been modest for the past few years. Between 2007 and 2008, there was a decline of 0.5% (CUTA, 2008), which was attributed to a fare increase. Although there was another fare increase in 2010, ridership actually grew by 1.4%. According to HSR staff, ridership is up 3.2% in 2011, and shows no signs of slowing down. The overall growth regression trend for the HSR, excluding the 2007 data, is shown in Figure 18, next page. At this rate, indicated by the blue line, HSR ridership growth will not keep pace with the projected 30% population growth. If ridership grows in lock‐step with the 30% population growth trend, the result will be the green line on the graph, topping out at 28 million revenue passengers year in 2041, compared with 21.5 million today. With the urban intensification imposed by Places to Grow (Ministry of Public Infrastructure Renewal, 2006), and the more ambitious overarching goals of Metrolinx (2008) to increase transit use in the GTHA, a 100% increase by 2031 is also graphed by the purple line. Under this scenario, overall revenue passenger ridership will climb to 43 million passengers in 2031. This ridership growth is equivalent to 3.527% per year, slightly higher than the growth rate reported for 2011. This rate will be used in the cost/benefit analysis which follows. The resulting projected boarding volumes for the corridors are shown in Table 8. Other cities with LRT systems, and relevant literature, report a significant increase in ridership after the LRT is operational. Phoenix, AZ, for example, experienced ridership increases 25% higher than forecast during weekdays, and 60% higher on Saturdays shortly after their system opened (Holstege, 2009). Vuchic (2005, pp. 547) cites the example of an LRT line in Philadelphia and a BRT in Washington, DC, both opened at the same time, with similar alignments and demographic profiles. The ridership on the LRT is 24% higher than the BRT line. Strategic Interchange ©2011
Bus or Rail? Finding the righ
                            ht solution for Hamilton’s A‐Linee                                                                                                        22

                                                                           P
                                                                           Projected
                                                                                   d HSR Ridership
                                                 55

                                                 50
                  Annual Ridership in Millions                                                                                                Linear Regressio
                                                                                                                                                             on
                                                 45
                                                                                                                                                   Models
                                                 40
                                                                                                                                                100% Growth by 2031
                                                 35
                                                                                                                                                30% Growth by 2031
                                                                                                                                                              2
                                                 30                                                                                             Current Trend
                                                 25                                                                                             Actual 2008‐11

                                                 20
                                                      2008
                                                             2011
                                                                    2014
                                                                           2017
                                                                                  2020
                                                                                          2023
                                                                                                 2026
                                                                                                        2029
                                                                                                               2032
                                                                                                                      2035
                                                                                                                             2038
                                                                                                                                    2041
                                                                                           Year

                                                                     Figure
                                                                          e 18 ‐ Linear Regre
                                                                                            ession Projections for HSR Ridership
                                                                                                                               p

                                                                                  Table 8 ‐ Proje
                                                                                                ected Passenger Boardings
                                                                                                                B

                                                         Year                            2011                    2021                      2031
                                                         A‐Line                          3,319,784               4,694,887                 6,639,578
                                                         A‐Line Core
                                                                   e                     2,329,548               3,294,4
                                                                                                                       481                 4,659,103
                                                         B‐Line                          10,873,980              15,378
                                                                                                                      8,141                21,74
                                                                                                                                               47,992

No similarr jump in ride
                       ership has beeen added to the
                                                 t estimatess for the Hamilton LRT option cost/beneefit
analysis. In the modelss used above,, ridership willl have increased by over 40%
                                                                             4 by 2021, on its way to
                                                                                                    o
doubling by 2031. Thiss growth seem
                                  ms sufficient and         f the models which follow, and levelss the
                                                a realistic for
playing fieeld between the
                       t LRT and BRT
                                 B options.

Strategic Intterchange ©201
                          11
Bus or Rail? Finding the right solution for Hamilton’s A‐Line 23 8. COST/BENEFIT OF LRT VS. BRT A Cost/Benefit analysis is a useful undertaking for large capital projects. We need to see how the long‐ term benefits of the project, especially those with a high upfront cost, could pay off later in the project’s life. The benefits that may come at some point in the future have to be adjusted to their present‐day value in order to make the comparison meaningful. Inflation or other market conditions affect the value of future‐dated costs benefits over time. These factors become more important if money has to be borrowed to pay for the project. The effect of inflation means that a dollar we receive today is not worth the same as a dollar we receive 20 years from now. It will likely be worth less, in terms of its purchasing power (i.e. its net benefit) while a dollar we received 20 years ago would have been worth more at the time. Therefore, along with increasing future costs and benefits for factors like inflation, they must also be discounted to state them in their present value. Discount rates can be based on factors such as bank or investment interest rates. A summary of the Capital Costs, Operating Costs and other Cost/Benefit model parameters is included in Table 9, and are explained in detail below. CAPITAL COSTS The LRT capital costs (construction, vehicles) of $875 million for B‐Line (City of Hamilton, 2011) will also be used for the A‐Line model. The rationale for using the same figure is based on the additional construction costs related to the Mountain crossing and the longer length of the route, balanced with the lower construction costs for the suburban and rural sections of the line. These assumptions appear to be appropriate in comparison to the A‐Line sectional costs estimated in McCormic (2008). The BRT capital costs for B‐Line are estimated at $264.7 million (City of Hamilton, 2011). The A‐Line figure was reduced by 30% to $185.29 million, as the escarpment crossing will use the existing James Mountain Road access, and again, the suburban areas of the route will require less infrastructure than the urban B‐Line. For the Trolley option, this cost was doubled, to allow for the 20‐30% additional trolley bus purchase price (Metrolinx, 2008), and cost of installing the electrical wiring and infrastructure. Gilbert & Perl (2010, pg 160) posit that trolley construction is only $1 million more per km than diesel BRT, but this seems optimistically low. Further research is needed to ensure the trolley estimate is accurate. Strategic Interchange ©2011
Bus or Rail? Finding the right solution for Hamilton’s A‐Line                                              24

For the A‐Line Core LRT, 60% of the full‐route cost, or $525.3 million, has been assumed. Although this
section it is only about one‐third of the full A‐Line route length, construction and infrastructure costs will
be high through the downtown and building the mountain access tunnel. A second option for A‐Line
Core LRT via Claremont Access is estimated at $100 million less, as per McCormic (2008). For BRT, the
estimated cost of $105.88 million is based on 40% of the full A‐Line BRT cost, as the Core section should
require proportionally less new infrastructure than LRT.

OPERATING COSTS

Lower passenger boarding costs for LRT, and electric transit vehicles in general have been well
documented in the available literature on the topic. In St Louis, MO, for example, the per passenger
operating costs are $2.49 for bus and $1.32 for LRT (Condon, 2010, p.p. 17, citing Lyndon, 2007). By
comparison, the HSR’s current system‐wide operating cost per passenger is $3.19 (CUTA, 2010). To
provide a benchmark for the estimated operating costs of the proposed LRT and BRT options, this
cost/benefit analysis will reference the same City of Hamilton (2011) report used for determining the
capital costs. The annual B‐Line LRT operating cost is $7.8 million and BRT operating cost is $16.1 million.
For the A‐Line, these numbers have been reduced by 30% to $5.46 million and $11.27 million
respectively, to account for the A‐Line’s lower frequency of service, and likewise the fewer vehicles
required. A service level of every 7.5 minutes peak and every 10 minutes off‐peak is assumed
appropriate for initial A‐Line service, compared to 4 minutes peak and 7.5 to 10 minutes off‐peak for B‐
Line.

Operating costs used for A‐Line Core are 50% of B‐Line, accounting for the shortened route but a service
level similar to the B‐Line being warranted by the volume of passengers. For the A‐Line Core via
Claremont Access option, the disadvantages of the longer route have been factored through an increase
in the A‐Line Core operating cost of 50%, to account for the longer distance and travel time. The
Claremont option will also require one more LRT vehicle operating in each direction, and continuing to
maintain bus service on James Mountain Road. A one‐third penalty in passenger boarding is also
estimated, due to the less convenient routing compared to the more direct bus service.

COST/BENEFIT MODEL PARAMETERS

All of these numbers have been used as the initial values in the Cost/Benefit analysis model. An
operational date of 2021 is assumed. Initial costs have not been adjusted for inflation to that date,

Strategic Interchange ©2011
Bus or Rail? Finding the right solution for Hamilton’s A‐Line                                              25

because our benchmark for analysis is in “today’s dollars”, in 2011. If the future‐dated 2021 value of the
capital cost of $875.5 million were used, it would actually be $1.13 billion at the current inflation rate of
2.9% (Bank of Canada Annualized Inflation Rate, Oct. 2011, from www.bankofcanada.ca), and then
discounted back to this year. As the intent of this research is to provide a comparable cost/benefit
analysis across the different options, introducing this step would only add unnecessary complexity and
be a distraction from the actual results.

Each Cost/Benefit table spans a 25‐year period, from 2021 to 2045, which is the average lifespan of an
LRT vehicle (City of Vancouver, 2006). For revenues, the previously calculated revenue per boarding of
$1.40 is applied, and increases at an annual inflation rate of 2.9%. No additional capital cost inputs for
reconstruction, expansion or new vehicle purchases are included during this time‐span. All regular
maintenance and repair costs are assumed to be covered by the Operating Costs, which increase by the
rate of inflation and be further compounded by ridership growth over time. It is understood that costs
ramp up over time as equipment and infrastructure ages. In the beginning, “everything is new, there is a
holiday from wear and tear costs.” (Newkirk, 2002, pp. 176) Thus, the operating costs will become
higher in proportion to the revenues over the 25‐year time span with this model.

Ridership begins with the 2021 estimate, growing by 3.527% per year, in keeping with the target to
increase ridership by 100% by 2031. As noted earlier, no special consideration has been given to any
difference in ridership levels between the different technologies. To determine the present‐day, 2011
value of future‐dated costs and revenues, an annual discount rate of 2.63% is applied (Bank of Canada
Long Term Bond Rate, from www.bankofcanada.ca).

Of great importance to Hamilton’s decision makers is how much of the upfront capital costs will be
funded by Metrolinx. Other transit projects currently underway across the GTHA are funded 100% by
Metrolinx, and this position was reiterated by senior Metrolinx staff at a City Council meeting on
October 13, 2011. With the recent provincial election, economic pressures, and the funding
arrangements recently announced for the Waterloo LRT project, there is concern that Metrolinx will not
be able to follow‐through with its promise, and the City of Hamilton will have to make up for the
shortfall.

The Costs/Benefits have been modelled based on the City funding 0% (full Metrolinx funding), 10%, 25%,
33%, 50% and 100%. In any event, the City will cover the full operating costs of the chosen system. Even
if the funding arrangement is for Metrolinx to cover “100%”, it would be shortsighted to assume there

Strategic Interchange ©2011
You can also read