Business case development for the Western Area Peninsular Water Fund, Sierra Leone - October 2020
←
→
Page content transcription
If your browser does not render page correctly, please read the page content below
Business case development for the Western
Area Peninsular Water Fund, Sierra Leone

October 2020

Gwyneth Letley and Jane Turpie
Anchor Environmental Consultants (Pty) Ltd.


PREFACE AND ACKNOWLEDGEMENTS
This report was commissioned by Catholic Relief Services (CRS) in partnership with The Nature
Conservancy (TNC) through the Replenish Africa Initiative funding by the Coca Cola Foundation
to develop a business case for the investment in proposed nature-based solutions for the
Western Area Peninsular Water Fund, as well as to engage with key stakeholders to get their
support for the prioritisation of investments.

The study was carried out by Anchor Environmental Consultants, South Africa with input from
TNC and Villanova University, USA on the hydrological and hydraulic modelling of the BAU and
Conservation scenarios, and input from Zutari, South Africa on conventional engineering costs.

We are grateful to Simon Okoth, Caroline Raes, Jean-Philippe Debus, Azeez Oseni, Paul Emes,
and Alpha Amadu Bah from CRS, Colin Apse, Fred Kihara, and Tracy Baker from TNC, Virginia
Smith, Angela Cotugno and Wesley Shugart-Schmidt from Villanova University, and the National
Water Resources Management Agency (NWRMA) for useful discussions, technical inputs, data,
and feedback on an earlier draft.

                                               i
TABLE OF CONTENTS
1     INTRODUCTION ........................................................................................................................................................ 1
2     POTENTIAL FOREST DEGRADATION UNDER A BAU SCENARIO .............................................................. 4
    2.1       RATE AND DRIVERS OF FOREST DEGRADATION AND LOSS ................................................................................................ 4
    2.2       PREDICTED LAND COVER CHANGE UNDER BAU................................................................................................................. 8
3     IDENTIFICATION OF CONSERVATION INTERVENTIONS ............................................................................ 9
    3.1       OVERVIEW ................................................................................................................................................................................ 9
    3.2       INTERVENTIONS TO RETAIN AND RECOVER FOREST ....................................................................................................... 11
                Effective protection of the WAPNP .......................................................................................................................11
                Forest restoration within the WAPNP ................................................................................................................14
                Agroforestry buffer zones between urban edge and park boundary ......................................................17
                Riparian buffer zones.................................................................................................................................................19
    3.3       ENABLING INTERVENTIONS ................................................................................................................................................ 20
                Advocacy, communication and social mobilisation .......................................................................................20
                Enforcement of existing laws ..................................................................................................................................21
    3.4       INTERVENTIONS TO RAISE CO-FINANCING/REDUCE COSTS ........................................................................................... 22
                REDD+ ..............................................................................................................................................................................22
                Private tourism concessions ....................................................................................................................................25
4     POTENTIAL EXTENT OF INTERVENTIONS UNDER A CONSERVATION SCENARIO ..........................27
5     RETURN ON INVESTMENTS IN WATER SECURITY .....................................................................................29
    5.1       OVERVIEW ............................................................................................................................................................................. 29
    5.2       FLOW REGULATION .............................................................................................................................................................. 29
    5.3       EROSION CONTROL............................................................................................................................................................... 30
    5.4       FLOOD ATTENUATION ......................................................................................................................................................... 32
                Lumley .............................................................................................................................................................................35
                Granville ..........................................................................................................................................................................35
                Alligator ..........................................................................................................................................................................36
                Wellington ......................................................................................................................................................................36
                Bluewater .......................................................................................................................................................................36
                Whitewater ....................................................................................................................................................................36
                Congo ...............................................................................................................................................................................37
                Summary of expected annual losses.....................................................................................................................37
    5.5       LANDSLIDE MITIGATION...................................................................................................................................................... 38
6     CO-BENEFITS OF CONSERVATION SCENARIOS ............................................................................................39
    6.1       NATURE-BASED TOURISM ................................................................................................................................................... 39
    6.2       CARBON STORAGE ................................................................................................................................................................ 43
    6.3       BIODIVERSITY ....................................................................................................................................................................... 45
7     COST-BENEFIT ANALYSIS ....................................................................................................................................46
8     CONCLUSIONS ..........................................................................................................................................................49
9     REFERENCES ............................................................................................................................................................50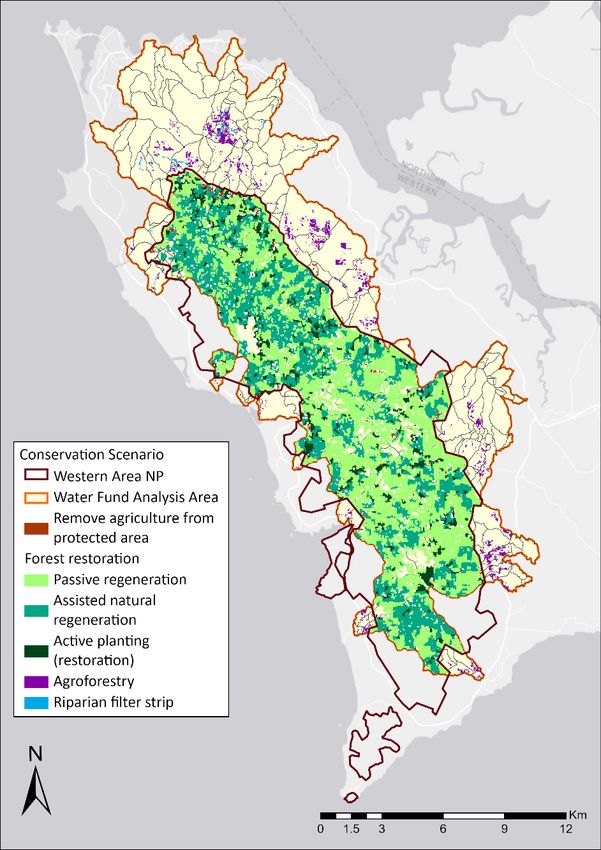
ACCRONYMS AND ABBREVIATIONS
1D       1 Dimensional
2D       2 Dimensional
ANR      Assisted Natural Regeneration
BAU      Business as usual
CBA      Cost-benefit analysis
CCBS     Climate, Community and Biodiversity Alliance Standard
CDM      Clean Development Mechanism
CIESIN   Center for International Earth Science Information Network
CRS      Catholic Relief Services
CTFA     Conservation Trust Fund Act
DFID     Department for International Development
FAO      The Food and Agriculture Organization of the United Nations
GEF      Global Environment Facility
GFCC     Global Forest Cover Change
GRNP     Gola Rainforest National Park
Ha       Hectares
ISAT     International Security Advisory Team
LULC     Land use land cover
METT     Management Effective Tracking Tool
MtCO2e   Million metric tonnes of CO2 equivalent
NDVI     Normalized Difference Vegetation Index
NPAA     National Protected Area Authority
NPV      Net Present Value
NWRMA    National Water Resources Management Agency
PES      Payments for Ecosystem Services
PUD      Photo-user-days
REDD+    Reducing emissions from deforestation and degradation
ROI      Return on Investment
SCC      Social cost of carbon
SSL      Statistics Sierra Leone
SWAT     Soil and Water Assessment Tool
TNC      The Nature Conservancy
UNDP     The United Nations Development Programme
UNEP     The United Nations Environment Programme
UNESCO   The United Nations Educational, Scientific and Cultural Organization
UNWTO    United Nations World Tourism Organisation
VCS      Verified Carbon Standard
WAP      Western Area Peninsula
WAPNP    Western Area Peninsula National Park
WAPFR    Western Area Peninsula Forest Reserve
WTTC     The World Travel & Tourism Council
WWF      The World Wide Fund for Nature

                                        iii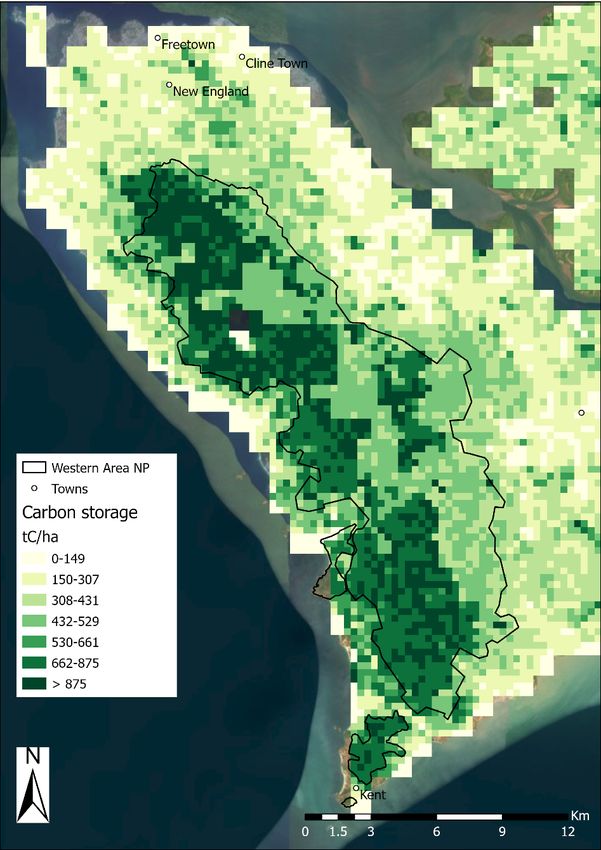
EXECUTIVE SUMMARY
Introduction

The city of Freetown, Sierra Leone has expanded rapidly over the past few decades. This has led
to rapid loss of forested area in the Western Area Peninsula (WAP), and increasingly within its
18 337 ha Western Area Peninsula National Park (WAPNP). The remaining forests are
important for supplying a range of ecosystem services to Freetown and beyond. Critically,
about 90% of Freetown’s freshwater supply comes from the watersheds that originate from the
WAPNP. As a result of fuelwood harvesting and forest clearing for agriculture and settlements,
water is becoming contaminated with sediments and pollutants, the risks of water shortages,
flooding and landslides are increased, and the important wildlife populations in the area,
notably the endangered Chimpanzee, are becoming increasingly threatened, diminishing the
potential tourism benefits that could be derived from the area in future.

The aim of this study was to determine the economic value of the difference in priority
ecosystem services flows between a Business-as-Usual (BAU) scenario and a Conservation
scenario which is focused on the WAPNP and facilitated by a Western Area Peninsula Water
Fund (WAPWF), and analyse these benefits in relation to the costs of implementation to
determine the net present value (NPV), return on investment (ROI), and cost-effectiveness of
the Conservation scenario.

The terms of reference for the study were to undertake the following steps with the input of
parallel hydrologic modelling studies:

1. Evaluate the potential feasibility of a range of potential conservation interventions;
2. Compile a Conservation scenario;
3. Estimate the cost of the Conservation scenario interventions;
4. Calculate the cost effectiveness and ROI of the WAPWF in terms of the water security
   objectives (expressed in physical terms); and
5. Calculate the NPV of the WAPWF taking other benefits into account.

In addition, as a first step, the study undertook a brief review of the forest degradation and
potential trajectory of change in order to estimate the state of the area at 2050 under a BAU
scenario.

Potential forest degradation under a BAU scenario

We analysed the change in canopy cover across the Western Area Peninsula National Park using
the Global Forest Cover Change (GFCC) Tree Cover dataset (30 m resolution). From 2000 to
2015, 10 587 hectares of forest experienced some thinning or loss of canopy cover, equating to
an overall loss of 2103 ha of forest. This is an average loss of 140 ha per year. Recorded canopy
cover ranged up to 83% in 2000 but by 2015 there were no areas with more than 64% canopy
cover.
The most serious driver of forest loss within the WAPNP is urban area expansion. By 2011,
3200 ha had been encroached by human settlements that housed some 100 000 people. There
are also extensive marijuana plantations and some smaller agricultural activities taking place.

The urban demand for charcoal has grown rapidly in the last couple of decades, and some of
that demand is being met from within the WAPNP. Logging and charcoal production activities
appear to be prevalent in the south-western section of the park. Large quantities or wood are
also being harvested daily for fish smoking in the Tombo village area.

From 2001 to 2020, the remaining area under natural vegetation on the WAP declined from
72% to 63%. Urban areas of the WAP are predicted to increase by 197% between 2015 and
2050, with significant encroachment into the WAPNP. By 2050 it is estimated that there will be
a loss of 5 115 hectares of forest from within the WAPNP, just less than one third of current
forest cover (Figure I).

Figure I.   Past (2015) and projected (2050) land cover for the Western Area Peninsula. The
            2050 land cover was used for the BAU scenario.

Identification of conservation interventions

The focus of the WF is on improving water security for the Freetown municipal area relative to
the BAU using nature-based interventions. The main options to be considered would be aimed
at halting and reversing the deforestation that has taken place in the WAPNP as well as to
preserve or restore forest areas in the riparian zones of the urbanised areas below the park,
with a view to retaining or improving the regulation of flows and retention of sediments, in
particular.

                                               v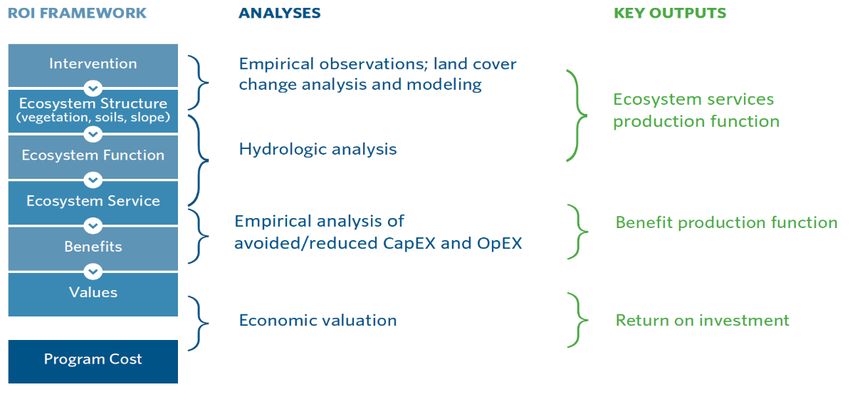
A literature review was undertaken of potential interventions to reduce deforestation and/or
restore forest cover and their costs. This benefited from some recent meta-analyses that have
been carried out on the drivers and interventions used to address deforestation. There is no
one single intervention seen as the panacea for stemming forest loss. Rather, given the fact that
many interventions are specialised and effective only under specific conditions, an intelligent
combination of policy options is preferred for effecting change. Previous studies have found
that one needs a mix of interventions that are directly aimed at forest conservation and
supporting or enabling interventions. Active interventions would include strict controls (e.g.
effective protected areas), mechanisms to incentivise conservation actions (e.g. payments for
ecosystem services), and mechanisms to reduce the demand for damaging activities (e.g.
agricultural reforms, alternative livelihoods), as well as restoration activities that are feasible in
areas treated under the first two. Supporting interventions include mechanisms to gain
political, government and community support (e.g. political advocacy, education, capacity and
awareness raising), to enable more effective law enforcement (e.g. to address systemic issues
such as capacity, corruption, judicial and legal structures and facilities), to improve cooperative
landscape management (e.g. through agreements and bylaws), and of course to ensure the
sustainable financing of all of the above. The following sets of interventions were considered as
the elements of a Conservation scenario.

Effective protection of the WAPNP
Protected areas are the most important and effective strategy for conservation. However, park
effectiveness in developing countries is jeopardized by severe underfunding, with the result that
illegal activities often continue unabated. Park effectiveness is correlated most strongly with
the density of guards, and is also dependent on their capacity and equipment. The number of
guards required to effectively protect a park is a function of the size of the park, its location and
accessibility, as well as the type of wildlife in the park. Estimates of required funding for
effective park management vary from US$192 per km2 to US$2180 per km2 per year (in 2019
prices). The African Parks model has a management cost of about US$1000 per km2 per year.

Sierra Leone has amongst the worst performing protected area systems in the world based on
forest loss over the period 2000–2012. Thus, strengthening their protected area systems is a
high priority nationally as well as in the WAP. Currently, the WAPNP has about 150-300 guards,
but their effectiveness is compromised by low salaries (~US$125/month), high staff turnover
and reported corruption. Creating an effective protected area will therefore require increasing
the number of staff and their working conditions, undertaking training and capacity building,
and monitoring performance using the Management Effectiveness Tracking Tool. In order for
the park to achieve its conservation objectives, the revamp of the park will also require the
elimination of existing illegal activities, including production of charcoal, marijuana and other
crop production. Given the challenges and large capacity and financing requirements, a public-
private partnership may be a good option, particularly if a high-value, low impact tourism
strategy is undertaken. This has been successfully implemented for many flagship parks in
other African countries.

Forest restoration within the WAPNP
Forest restoration can be achieved through active restoration, involving planting or seeding,
through assisted natural regeneration (ANR), which involves interventions such as weeding, fire
prevention, attracting seed dispersal, and fencing to control livestock grazing and other
disturbances, or through passive regeneration which occurs naturally through protection
against disturbances. ANR is more feasible at scale and is more cost-effective. However, some
active restoration will be necessary, such as in severely degraded areas around the edges of the
WAPNP or in areas where illegal agriculture has cleared the forest. Passive regeneration covers
the greatest area and involves, through protection, the natural restoration of canopy density.
We estimated the maximum potential extent of active restoration, assisted natural regeneration
and passive regeneration interventions in the WAPNP based on spatial data on the extent of
degradation. The most suitable areas for active and ANR activities based on factors such as
accessibility and slope would need to be identified through field visits.

Agroforestry buffer zones between urban edge and park boundary
Protection of the WAPNP forest habitats and ecosystem services would be enhanced by
maintaining forested or semi-forested areas around the park. Given that there is little forest
remaining around the park, the most viable option for a buffer zone is to establish agroforestry
in order to increase tree cover. This will help to serve as a deterrent to further encroachment of
human settlement and the exploitation of WAPNP resources. Encouraging tree planting within
existing cultivation areas requires both clear land ownership, a payment of ecosystem services
scheme to encourage the planting and retention of trees, and a competitive bidding process for
participation. A total of 1152 ha of land around the WAPNP was identified as potential
agroforestry buffer zones. As long as the PES covers the opportunity costs of the intervention
(the costs of the trees and their impacts of original crop production), then it is likely that
households would also enjoy additional productive benefits from the trees, e.g. fruits or
firewood.

Advocacy, communication and social mobilization
Without buy-in and the political will to change current systems from those at the top levels of
government, conservation effectiveness is limited. There will be a need to further investigate
potential models of advocacy that can harmonise interests and priorities, especially among
water, land and environmental conservation. Awareness raising and social mobilization are
also critical for protection of the WAP forests. This needs to include raising awareness of
specific policies, laws and regulations that relate to the protection and management of natural
areas and how these policies relate to improving livelihoods and water security.

Law enforcement
Enforcement of the law is a vital component of any regulatory system. Sierra Leone faces major
challenges in terms of environmental compliance and enforcement. Improved inter-ministerial
cooperation and improved cooperation from local authorities is needed. Furthermore, there is a
need for Sierra Leonean environmental laws to shift away from solely relying on criminal
enforcement to moving towards enhancing effective administrative and civil practices for
environmental violations. It is recognised that corruption is systemic and requires national level
attention. However, the Water Fund can employ certain measures to deal with the problem of
encroachment and the issuance of illegal land titles. For example, fencing the WAPNP and using
appropriate and clear signage would prevent these illegal activities from occurring within the
Park to a large degree. While this is not a long-term solution in terms of addressing the

                                               vii
overarching problem of corruption and weak policies and institutions, it provides a solution to
quickly address the rampant encroachment that is currently occurring.
Establish a REDD+ project to generate co-financing
There is significant potential to fund conservation through the sale of carbon credits. REDD+
provides an incentive for forest owners (in this case the government of Sierra Leone) to ensure
their forest is protected and kept intact. The findings from a project undertaken in 2012 found
that REDD+ for the WAPNP could be feasible and should be explored for implementation. Based
on the carbon mitigation potential of the forests of the WAPNP, it is estimated that the total
potential revenue from the sale of carbon credits could be between US$239 400 and
US$520 800 per year. Given that a REDD+ project currently exists in the Gola Rainforest
National Park, a national REDD+ program in Sierra Leone would be worth pursuing.
Potential extent of interventions under a Conservation scenario
The Conservation scenario included
• 12 556 hectares of forest restoration through active planting (1489 ha), assisted natural
regeneration (3938 ha) and passive regeneration (7129 ha);
• 1152 hectares of agroforestry in buffer areas of the WAPNP;
• 53 hectares of riparian buffer zones outside of the WAPNP;
• 90 km of fencing around the entire park;
• Removal of all illegal activities, and radically-improved park management.
This would require an initial investment cost of US$6.82 million plus ongoing annual costs of
some US$828 000 per year.
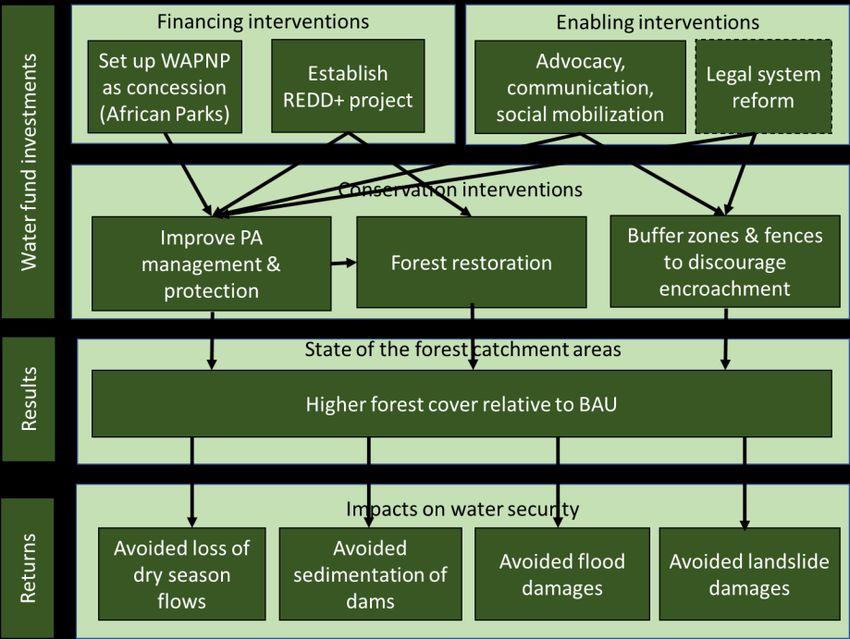
Return on investments in water security
The investments, expected effect, and resulting returns in terms of water security benefits are
summarised in Figure II. The different outcomes relative to a BAU scenario were estimated in
physical terms based on hydrological modelling, and valued in terms of avoided costs.
In Freetown, a number of low-income residents rely on unprotected wells as well as rivers and
streams for their daily water needs. However, in the dry season months (December to April)
people are sometimes forced to find an alternative, which usually involves purchasing water
from informal vendors. Dry season flows were about 11 000 m3 more under the Conservation
scenario than under the BAU scenario, amounting to an estimated annual cost saving to poor
households of US$436 941 per year.
The forests of the WAPNP are important for soil erosion control, trapping sediments and
preventing them from entering the Guma and Congo water supply reservoirs that are situated
within the WAPNP. These reservoirs are essential for supplying water to Freetown during the
dry season between December and April when only 11-17% of the annual river discharge
occurs. Under the BAU scenario it was estimated that the Guma reservoir would be completely
filled with sediments within 20 years. The Conservation interventions extend the lifetime of the
Guma reservoir by 55 years and the Congo reservoir by 35 years when compared to the BAU. Atotal of 8 812 tonnes of sediment would be prevented from reaching the dams each year relative
to the BAU, saving dredging costs of US$311 000 per year for the Congo Dam and US$531 500
per year for Guma Dam. If this were the single objective of the Conservation scenario, then the
return on investment would be about 111 tonnes/US$1000. This is about ten times higher
than if the problem were solved by dredging (10 tonnes/US$1000).
Figure II. Schematic diagram showing the different types of interventions and how they relate to
the expected water security benefits.
Flooding is the most common type of natural disaster in the country, occurring frequently
during the rainy season between the months of May and October. In general forest cover in
catchment areas can play a major role in mitigating flood risk. However, Freetown experiences
extremely high rainfall, and there is very little that either vegetation or man-made structures
can do to mitigate this. The most cost-effective solution is to avoid building in flood plain areas,
and very importantly, to plan for the fact that floodplain areas will expand as the urban area
expands, because of the effect of hardened surfaces on flows. TNC focuses on funding nature-
based solutions, and perhaps engineering solutions that help to protect nature as well as
contributing to water security. Here the only nature-based solution would be to protect the
floodplain areas in their entirety as natural areas. In Freetown, it is too late to do that, however.
It was estimated that the interventions under the Conservation scenario (mostly well above the
urban area), would reduce the expected annual damage costs from flooding across all seven
watersheds by some US$2.05 million, with an average annual reduction of 74 buildings being
inundated compared to the BAU scenario. The average number of buildings inundated each year
was highest in the Alligator watershed, but overall expected annual losses were highest in the
Lumley watershed. This results in a return on investment of US$1.65 for every US$1 invested in
restoration activities.
ixFreetown is also prone to landslides, which are triggered by high levels of intense rainfall over short periods of time and exacerbated by human activities such as encroachment into the WAPNP. Deforestation increases landslide hazard. While the impact of deforestation on landslides was not modelled during this study, a recent landslide risk and hazard assessment by The World Bank in Freetown estimated the average annual losses to be in the order of US$360 000, with an average of 11 fatalities of 140 people affected. Net present value including co-benefits of the Conservation scenarios In Sierra Leone, tourism is largely underdeveloped but has over the last decade shown positive signs of growth. However, the protected areas currently generate a very small percentage of the overall attraction-based tourism value in the country. The total attraction-based tourism value (in terms of direct contribution to GDP) in 2019 for Sierra Leone was estimated to be US$23.3 million. Based on empirical evidence of tourist activity (photo densities) about US$0.5 million or 2.2% of this national value can be attributed to the WAPNP, with a per hectare value of US$27. The WAPNP is endowed with a variety of unique and special fauna and flora, and is well positioned to attract tourists. Under the BAU scenario, without any intervention to protect the forests of the WAPNP and promote ecotourism, it was assumed that tourism would continue to follow current trends in tourism growth. Under the Conservation scenario, where interventions are in place to protect the forest and promote ecotourism through private tourism concessions, the per hectare value of the WAPNP was assumed to increase, reaching values by 2050 that are seen in similar forest parks elsewhere in Africa. Gombe National Park in Tanzania was used as a target value where the nature-based tourism value is estimated to be US$230 per hectare, eight times higher than that of the WAPNP. Gombe makes for a good comparison as to what the WAPNP could generate in the future if protected and promoted as a unique ecotourism destination. Given that the WAPNP is more easily accessed compared to Gombe, there is even more reason to believe that higher values can be achieved in the long-term. Using this as a target value, nature-based tourism associated with the WAPNP was assumed to grow at a rate of 7% per year under the Conservation scenario. In 2050 this would generate a total of US$1.36 million under the BAU and US$3.92 million under the Conservation scenario, a difference of US$2.56 million per year. Tropical forests play a critical role in the global carbon cycle. Based on global datasets derived from satellite data, it was estimated that approximately 12.6 million tonnes of carbon are stored within the vegetation and soils of the WAPNP, ranging from 42.6 t/ha to 1024.3 t/ha, with a mean value of 690 t/ha. The total global damage costs avoided by retaining this stock of biomass carbon is substantial at just over US$1.1 billion per year and the avoided damage cost to Sierra Leone was estimated to be just under US$0.25 million per year. A BAU scenario would result in an estimated loss of 5115 ha of forest from the WAPNP, equating to 3.53 million tonnes of carbon. The Conservation scenario, involving strict protection of the existing forest plus restoration of 12 556 ha of forest. The loss in forest under the BAU would result in global climate-related damages of US$312 million per year and national damages of some US$70 000 per year. The Conservation intervention would avert these damages and result
in an additional gain of over 8.6 million tonnes of carbon, thus avoiding global damage costs of
US$765 million and some US$170 000 to Sierra Leone.

The strict protection and restoration of the WAPNP would lead to an improvement in its flora
and fauna, which is something that many members of society, even beyond Sierra Leone, would
value. These kinds of values, referred to in the literature as non-use or existence values, are
intangible and difficult to quantify, even with best-practice stated preference methods. The
WAPNP is very important from a conservation perspective, e.g. as a habitat for rare and
endangered species such as the Western Chimpanzee. While this study has not attempted to
estimate existence value, this benefit is likely to be very significant and should be
acknowledged.

Cost-benefit analysis

The Conservation scenario was evaluated using a cost-benefit analysis to quantify the present
value return on investment (ROI, net welfare gains per US$ invested) and net benefits. The
costs and benefits were analysed over a time period of 30 years at a social discount rate of
3.99%. This was further tested under varying assumptions of costs, benefits and discount rate.

The results of the cost-benefit analysis suggest that the implementation of restoration
interventions in and around the WAPNP would result in a net benefit for the Conservation
scenario (Table I). The net present value over 30 years was estimated to be US$34.76 million,
with a ROI of 2.7. In other words, every" 1 US$ invested on average would generate a return of
just under US$3 in terms of benefits to stakeholders. The results presented here include the
avoided national costs in terms of carbon storage and not the avoided global costs which are
orders of magnitude greater. Including the global cost savings in the cost-benefit analysis would
result in a net present value in the order of US$13 billion.

The results from the sensitivity analysis strongly suggest that restoration interventions in and
around the WAPNP can be justified in economic terms when enabling conditions are in place to
ensure their success. Under varying assumptions of costs and benefits and timing and discount
rates, the results remain favourable. However, if enforcement is not strengthened and there is
poor advocacy, communication and social mobilisation (as under the BAU), then the results
show a negative NPV and a ROI of less than one due to the failure of ensuring adequate
protection of the forests. While the net benefits remain positive under varying assumptions,
the overall viability of the Water Fund is sensitive to changes in the timing of benefits as well as
in terms of the costs of interventions. Furthermore, the success of the Water Fund is largely
dependent on enabling interventions that require improvement and strengthening at national
and sub-national levels to ensure compliance of environmental laws. Without drastically
strengthened enforcement, it is likely that a BAU approach will continue into the future. It will
therefore be useful to introduce supporting interventions such as public-private partnerships
and REDD+ (benefitting the park authority) to ensure the success of the project and spillover
benefits to surrounding communities.

                                                 xi
Table I. Present value of the costs of interventions and value of ecosystem service benefits for
the Conservation scenario (2020 US$ millions, 3.99% discount rate, 30 years).
Present value (US$ millions)
Costs Conservation Scenario
Improved management of WAPNP 2.94
Active planting (restoration) in WAPNP 5.12
Assisted natural forest regeneration in WAPNP 3.72
Passive forest regeneration in WAPNP 6.17
Agroforestry PES 0.29
Fencing 1.54
Riparian buffer zones 0.17
Total present value of costs 19.96
Benefits
Erosion control 12.30
Flood attenuation 24.69
Flow regulation 5.27
Carbon retention and gains relative to BAU (savings to Sierra Leone) 2.81
Nature-based tourism 9.50
Agroforestry gains from tree introductions 0.15
Total present value of benefits 54.72
Net Present Value 34.76
ROI 2.7
Conclusions
Even though we were not able to quantify all the potential benefits, the results from the cost-
benefit analysis demonstrate a clear economic basis for the establishment of the Western Area
Peninsula Water Fund. Overall, a US$20 million investment in restoration interventions under
the Conservation scenario is expected to return at least US$55 million in economic benefits over
the 30-year timeframe. In other words, every US$1 invested by the Water Fund is expected to
generate at least US$2.70 of benefits to stakeholders. Furthermore, catchment restoration is
significantly more cost-effective than other conventional interventions. In addition to security in
water supply and mitigation of flooding and landslide risk, restoration of the WAPNP forests
brings wider benefits in terms of nature-based tourism, climate change resilience, job creation,
opportunities for women and most importantly, avoiding the irreversible loss of the unique and
valuable biodiversity of the Upper Guinean forest. Sensitivity analysis shows that even under
lower benefit and higher costs streams, as well as varying timing and discount rates, economic
viability can still be maintained. However, this requires the assurance of adequate enabling
conditions, which when removed, result in a negative NPV and BAU trajectory.
The following key results demonstrate the importance of protecting and restoring the forests of
the WAPNP and clearly demonstrate the feasibility of establishing the Water Fund. Compared
to a business-as-usual scenario:• About 11 000 m3 more water would be available to households during the dry season
months with an annual cost saving to poor households of US$436 941 per year;
• The amount of sediments entering the rivers of the Western Area Peninsula would be
halved, and the lifetime of Guma and Congo reservoirs will be 55 and 35 years longer,
respectively;
• Average annual flood damages across the seven urban watersheds would be reduced by
US$2.05 million, and the risks of landslides would likely be reduced;
• Gains in nature-based tourism value of the WAPNP could amount to US$3.92 million per
annum;
• Carbon stored in the WAP would be 8.6 million tonnes higher, avoiding annual climate
change damages of US$170 000 to Sierra Leone and of US$765 million at a global level;
• The more intensive management of the WAPNP, growth in high-end tourism and
agroforestry interventions could bring significant employment and livelihood benefits to
households living in the WAP.
Enabling interventions are critical for the success of the Water Fund. This will include clear
communication on the need for and long-term benefits of some of the necessary strict
protection measures in order to get buy-in from all stakeholders
xiii1 Introduction
Freetown, the capital city of Sierra Leone, has experienced significant growth over the last
decade. The city, designed for only 400 000 inhabitants, is now home to more than 1.2 million
residents, with this figure rising each year (CRS, 2018). As a result, the city has expanded to
accommodate a growing population, with increasing rates of urbanization and agricultural
expansion. This has led to extensive encroachment of settlements and farming areas into the
Western Area Peninsula National Park (WAPNP) causing loss and degradation of intact forest.
Forest degradation has also resulted from the collection of woody resources, charcoal
production and mining activities. The degradation and loss of forest is continuing at an
increasing pace, placing one of the country’s most valuable natural assets under imminent
threat.
The remaining protected forests of the WAP are important for a range of regulating and cultural
services including sediment retention, water supply, reduction of flood and landslide risks,
carbon storage and biodiversity. As such they are important for water security (Box 1) and as a
buffer against climate change and the economic challenges that come with it.
Box 1. Water security
The United Nations defines water security as: “the capacity of a population to safeguard sustainable
access to adequate quantities of acceptable quality of water for sustaining livelihoods, human
wellbeing, and socio-economic development, for ensuring protection against water-borne pollution
and water related disasters and for the preservation of ecosystems in a climate of peace and political
stability” (Soto Rios et al. 2018). There are four core elements within this definition:
• People have access to safe adequate quantities of acceptable quality drinking water for sustaining
livelihoods, human well-being, and socio-economic development. Water supply needs to be
adequate and reliable, and typically piped to people’s homes and places of work;
• Water is available for economic activities and development, energy production, industry and
transport as required, and people’s livelihoods are not affected by unreliable water supplies;
• Ecosystems are preserved such that they deliver water related ecosystem services. This includes
that protection of freshwater resources, and the aesthetic and recreational opportunities
associated with aquatic ecosystems and human-made reservoirs; and
• Climate related water hazards, such as floods and droughts, and the risks associated with these,
are effectively managed.
Critically, the forest area of the WAPNP protects soil cover in the catchment areas of the city’s
two main water supply dams (NWRMA, 2019). There are more than 50 water catchments
across the Western Area Peninsula and over 90% of them are located within the WAPNP
(NWRMA, 2019). Water supply to the city of Freetown is mainly from the Guma reservoir,
which supplies 1.5 million people, and the Congo reservoir, which supplies 300 000 people
(Guma Valley Water Company, 2008). Deforestation allows soil to be washed into the dams,
reducing their storage capacity and increasing water treatment costs.
The forest ecosystem also plays a role in capturing rainfall and aiding its infiltration, which
helps to maintain baseflows so that water is available for use throughout the dry season. Aside
1from the municipal areas supplied by dams, households in the rest of the peninsula obtain their
water directly from springs, rivers and streams as well as some boreholes and wells. There are
numerous small weirs that supply over a million people in rural and urban communities outside
of the municipal area, although these are mostly in bad condition. Deforestation increases the
likelihood of these water sources running dry for part of the year.
The forest areas of the WAP are also important for protecting the downstream urban areas from
flooding and landslides. Deforestation increases the volume and velocity of runoff from the
catchment areas, increasing the capacity for damage. In addition, the activities that cause
deforestation (all illegal within the WAPNP) also lead to a reduction in water quality as soils,
agricultural pollutants and human wastes enter streams that flow into the settled areas around
the park, threatening human health. Habitat loss and illegal hunting also threatens the wildlife
populations that are already largely confined to the parks’ limited area, such as the endangered
Chimpanzee (the national animal of Sierra Leone), potentially undermining the tourism and
recreational value of the park as well as its global value.
Urgent action is needed to protect this critical natural resource and in particular to invest in
nature-based solutions to ensure sustainability for future generations. To this end, the Catholic
Relief Services (CRS) in partnership with The Nature Conservancy (TNC) through the Replenish
Africa Initiative funding by the Coca Cola Foundation aims to develop a business case for the
investment in proposed nature-based solutions for the WAPNP as well as to engage with key
stakeholders to get their support for the prioritisation of investments. The development of the
Western Area Peninsula Water Fund is just one of a handful of Water Funds that are in
development across Africa. This follows the successful establishment of the Upper Tana-Nairobi
Water Fund in Kenya in 2015 and the launch of the Greater Cape Town Water Fund in South
Africa in 2018, both of which put forward ecological infrastructure restoration as critical
components to enhancing water security in their respective cities. Analysis using hydrological
modelling demonstrated that such measures can be significantly more cost-effective than
alternative, conventional interventions.
The aim of this study was to determine the economic value of the difference in priority
ecosystem services flows between a “business as usual” scenario and a “conservation” scenario
which is facilitated by a Western Area Peninsula Water Fund (WAPWF), and analyse these
benefits in relation to the costs of implementation to determine the net present value (NPV),
return on investment (ROI), and cost-effectiveness of the Conservation scenario, based on an
analytical framework developed by TNC (Figure 1.1).
The terms of reference for the study can be summarised as follows:
1. Evaluate the potential feasibility of a range of potential conservation interventions,
such as greenbelts, park guard training, reforestation, alternative livelihoods, policies to
curb illegal issuing of land title, education and communication, and low impact
development designs to capture sediments, improve water quality and mitigate flooding,
based on a review of their potential efficacy, costs and social acceptability.
2. Compile a conservation scenario in which nature-based interventions are located at
priority sites that would likely yield the greatest net benefits, but considering spatial
variation in cost-effectiveness; this to be submitted to the hydrologic modelling teams.3. Estimate the cost of the conservation scenario, including the costs of design,
installation, overhead expenses, management, maintenance and repairs, monitoring,
opportunity costs to landowners, incentive or compensation payments, and transaction
costs, e.g. in drawing up, monitoring and enforcing agreements.
4. Calculate the cost effectiveness and ROI of the WAPWF in terms of the water
security objectives (expressed in physical terms) – increased dry season water supply
(m3/a), reduced TSS in water abstracted by households or treated by the public utility,
reduced number of flooded structures. Cost effectiveness to be determined both
individually (as single objectives) to evaluate whether conservation is cost-competitive
with alternative, conventional solutions, and collectively (multiple objectives) in which
costs are compared to a bundle of alternative, conventional interventions that provide
this suite of target outcomes (by assigning a share of the conservation scenario to each
target outcome). Return on investment to be calculated on the basis of the cost to achieve
the same outcomes as the Conservation scenario using the least costly conventional
interventions.
5. Calculate the NPV of the WAPWF taking other benefits into account, such as
biodiversity, carbon sequestration and storage, or food security.
Figure 1.1. ROI framework for green infrastructure assessments (adapted from Kroeger et al.,
2017)
The study was carried out by Anchor Environmental Consultants, South Africa with inputs on
the hydrological and hydraulic modelling of the BAU and Conservation scenarios from The
Nature Conservancy (Baker & Srinivasan, 2020) and Villanova University, USA (Smith &
Cotugno, 2020; Smith, Shugart-Schmidt & Cotugno, 2020), and inputs on conventional
engineering costs from Zutari, South Africa. The development of the Conservation scenario
included input from the National Water Resources Management Agency (NWRMA), Catholic
Relief Services (CRS) and Guma Valley Water Company.
32 Potential forest degradation under a BAU scenario
2.1 Rate and drivers of forest degradation and loss
Global forest loss has remained alarmingly high during the last decades and threats and losses
continue to be reported. Between 2000 and 2012, 2.14 million km2 of global forest was lost,
with over 10% of the total forest lost occurring within protected areas, equating to 3% of the
total protected forest (Heino et al., 2015). The main direct drivers of global deforestation are
linked to agriculture, logging, infrastructure expansion and livestock grazing (Geist & Lambin,
2002; Lawlor et al., 2009; Defries et al., 2010; Hosonuma
et al., 2012; Busch & Ferretti-Gallon, 2017; Scullion et al., Forest loss, or deforestation, is
2019). Insecure property rights, weak governance, pro- defined as the long-term or
development policies and institutional failures are permanent conversion of land
important indirect drivers of forest loss (Lawlor et al., from forest use to other non-
2009; Busch & Ferretti-Gallon, 2017; Scullion et al., 2019). forest uses. Forest degradation
is a direct, human-induced, long-
In tropical Africa, the expansion of subsistence agriculture,
term loss or reduction in forest
population growth and urban expansion, and mining
carbon stocks, not recognised as
activities are the main deforestation drivers, with deforestation (Sedano et al.
fuelwood collection and charcoal production being the 2016). Both are due to human
main degradation driver (Boahene, 1998; Hosonuma et al., activities and do not happen
2012; Busch & Ferretti-Gallon, 2017; Scullion et al., 2019; naturally.
Seymour & Harris, 2019).
Freetown has experienced significant land cover change over the last two decades (ÖBf, 2012;
Mansaray, Huang & Kamara, 2016). Between 2000 and 2011, 420 ha of forest were lost
annually on the Western Area Peninsula, an annual rate of 0.8% (ÖBf, 2012). This is higher than
the global annual rate of 0.4% estimated by the FAO for primary forests over the same period
(2000-2010, FAO, 2010). Deforestation on the peninsula doubled from 3% (0.5% annually)
between 2000 and 2006 to 6% (1.2% annually) from 2006 to 2011 (ÖBf, 2012). By that time,
almost of all the change detected by remote sensing was due to deforestation, and not
degradation. However, the poor resolution of the imagery at the time would not have been very
good for detecting forest degradation (ÖBf, 2012).
We analysed the change in canopy cover across the WAPNP from 2000-2015 using the Global
Forest Cover Change (GFCC) Tree Cover Multi-Year 30 metre dataset1. Over this period, 10 587
hectares of forest experienced some thinning or loss of canopy cover, equating to an overall loss
of 2103 ha of forest (Figure 2.1). This is an average loss of 140 ha per year. A total of 41
hectares of forest within the National Park lost 60-80% canopy cover from 2000 to 2015, 806
hectares of forest lost 40-60% canopy cover and just over 4 000 hectares had canopy loss of
between 20 and 40%. The remainder (5659 ha) lost 1-20% canopy cover.
1Note that there were many missing values in the 2015 layer, which means that our estimates are
conservative.Closer inspection of the data shows a shift in the density of the forest canopy in the WAPNP
(Figure 2.2). The distribution of the area of forest within each canopy cover band has changed
significantly since 2000 where much of the forest had a canopy cover close to 60%, with some
areas reaching as high as 83% canopy cover. In 2005, this distribution changed with a shift to
lower canopy cover classes, with most of the forest falling within the 20-40% cover band. This
pattern has continued and by 2015 the highest canopy cover recorded across the park was 64%.
This suggests that there has been loss in canopy cover as well as a thinning out of the canopy,
analogous to high levels of degradation.
350
300
250
Area (hectares)
200
150
100
50
0
12
19
26
33
40
47
54
61
68
75
82
89
96
-9
-2
-100
5
-93
-86
-79
-72
-65
-58
-51
-44
-37
-30
-23
-16
Canopy cover change %
Figure 2.1. The total area (hectares) of forest canopy cover change (%) from 2000-2015 in the
Western Area Peninsula National Park. The negative values indicate the % loss in
canopy cover and the positive values the % gain in canopy cover.
Figure 2.2. The area of forest (in hectares) within each canopy cover band for the period 2000-
2015 in the Western Area Peninsula National Park. Data source: Global Forest Cover
Change (GFCC) Tree Cover Multi-Year 30 metre dataset.
5The most serious driver of forest loss within the WAPNP is urban area expansion (Figure 2.3).
Shifting agriculture, fuelwood harvesting and charcoal production, stone quarrying, illegal
logging, and marijuana farming also lead to forest degradation and loss (ÖBf, 2012; Figure 2.3,
Figure 2.4). Important indirect drivers of forest degradation and loss are rural-urban migration,
poor law enforcement, corruption, conflicting government mandates and poverty.
Figure 2.3. National Protected Area Authority (NPAA) WAPNP threat map. Source: NPAA
Figure 2.4. Illegal marijuana plantations within the Western Area Peninsula National Park.
Source: NPAA (2017).An earlier study estimated that by 2011, approximately 3 200 ha of forest within the protected
forest reserve had been encroached by human settlement, with most of this occurring on the
northern peak with the expansion of Freetown (WHH, 2011). At the time, it was estimated that
some 100 000 residents lived in areas that had been forested only ten years prior. There are
also extensive marijuana plantations and some smaller agricultural activities taking place. Along
the boundary of the Park, particularly in the northern sections, land is being encroached or
“brushed”2, either for agricultural activities or for construction purposes. Poaching and the use
of snares seems to be more common in the northern sections of the Park.
Fuelwood harvesting and charcoal production has led to significant loss of forest cover. Over
the past two decades there has been an unprecedented increase in the commercial trading of
fuelwood products in Sierra Leone, with the vast majority of small scale charcoal production
having been initiated since the turn of the century (Munro & van der Horst, 2012). In Freetown,
firewood used to be the primary source of energy for cooking, but this has been taken over by
charcoal, with 73% of households using charcoal by 2013 (Table 2.1, Fayiah, Dong & Singh,
2018). This is an annual growth rate of 9% since 2004. Kerosene was being used by more than
10% of households in 2004 but by 2013 this had dropped to less than 1%. The absence of
electricity in homes, especially for cooking, and a preference for charcoal as a cooking fuel has
strengthened the demand for charcoal across the country (Munro & van der Horst, 2012; Fayiah
et al., 2018a). This trend has been reinforced by landlords asking tenants to cook with charcoal
instead of firewood to reduce smoke damage and fire hazards, as well as by the invention of the
Wonder Stove (see westwindenergy.sl), an energy efficient cookstove that reduces the amount
of charcoal needed for cooking by about 60% (Munro & van der Horst, 2012). The latter is a
good example of what is known as the “rebound effect” that happens when introducing more
efficient energy technologies in an unconstrained supply situation.
Table 2.1. The population of Freetown and % household primary energy source for cooking,
1963-2013. Source: Fayiah et al., 2018
Freetown % Freetown household primary energy source
Freetown National
Year as % of
population population Charcoal Wood Kerosene LPG Elec. Others
national
1963 127 917 2 180 355 5.9 1.0 91.0 7.0 - - -
1975 276 247 2 735 159 10.1 18.0 68.0 12.0 - - -
1989 469 776 3 515 812 13.4 30.0 60.0 8.8 - - -
2004 764 484 4 976 876 15.4 32.2 50.7 10.8 1.0 0.1 5.2
2013 1 019 744 5 989 623 17.0 72.7 26.0 0.6 0.2 0.05 0.5
Charcoal is produced illegally within the WAPNP. A recent article in 2019, explains that each
illegal charcoal pit in the protected forest uses about 40 trees and can produce more than 11
tonnes of charcoal, worth around US$800 (see https://www.gcca.eu/stories/trail-sierra-leones-
illegal-charcoal-burners). While some of the urban charcoal demand is supplied from the
WAPNP, most still came from outside of city as of around 2011 (Munro & van der Horst, 2012).
The districts of Kambia and Port Loko which are situated north-east of Freetown were
identified as the main areas of production. Charcoal is also sourced from the districts of
2 Brushing refers to the clearing of land through felling of trees and burning (slash and burn)
7Moyamba (south-east), Tonkolili (east) and Bombali (north-east). Logging and charcoal
production activities appear to be prevalent in the south-western section of the park.
In the fishing village of Tombo, wood is harvested from the forest to smoke fish. It has been
estimated that about 8 000 bundles of firewood are used per day to smoke fish, equating to
more than 100 000 trees per year (WHH, 2011). Recent satellite imagery shows that the town
of Tomba has expanded significantly since 2011, with noticeable deforestation into the adjacent
WAPNP.
2.2 Predicted land cover change under BAU
An analysis of land cover change using Normalized Difference Vegetation Index (NDVI) data by
Smith et al. (2020) has shown that over a twenty-year period from 2001 to 2020 the remaining
area under natural vegetation on the WAP declined from 72% to 63%. Using the NDVI analysis
and translating this onto the Sentinel land cover, a land cover as of 2050 was generated for the
BAU scenario. Urban areas of the Western Area Peninsula are predicted to increase by 197%
between 2015 and 2050, with significant encroachment into the WAPNP. By 2050 it is
estimated that there will be a loss of 5 115 hectares of forest from within the WAPNP, just less
than one third of current forest cover.
Figure 2.5. Past (2015) and projected (2050) land cover for the Western Area Peninsula. The
2050 land cover was used for the BAU scenario.3 Identification of conservation interventions
3.1 Overview
The focus of this study is on improving water security for the Freetown area relative to the BAU
using nature-based interventions. The main options to be considered would be aimed at halting
and reversing the deforestation that has taken place in the WAPNP as well as to preserve or
restore forest areas in the riparian zones of the urbanised areas below the park, with a view to
retaining or improving the regulation of flows and retention of sediments, in particular.
This task involved an extensive desktop review of potential forest restoration interventions,
based on studies conducted elsewhere in the region (and globally), to get a better
understanding of the factors affecting their success in different socio-ecological contexts. We
first start with a short review of recent meta-analyses of the drivers of deforestation and the
interventions and policies that have been found to reduce it. We then move onto reviewing the
proposed conservation interventions. This also included collating information on the various
costs of different interventions.
Scullion et al. (2019) and Busch & Ferretti-Gallon (2017) studied the relative influence of
different drivers of forest loss and degradation and explored the interventions that stem it
through quantitative meta-analyses. Hundreds of spatially explicit econometric studies on
forest loss and degradation were examined to determine which types of interventions best
conserve forests and prevent degradation. Both studies show that a wide range of policies and
strategies exist to protect forests and that there is no one single intervention seen as the
panacea for stemming forest loss. Rather, given the fact that many interventions are specialised
and effective only under specific conditions, an intelligent combination of policy options is
preferred for effecting change. Their findings suggest that one needs a mix of interventions that
are directly aimed at forest conservation and supporting or enabling interventions.
Active interventions would include strict controls (e.g. effective protected areas), mechanisms
to incentivise conservation actions (e.g. payments for ecosystem services), and mechanisms to
reduce the demand for damaging activities (e.g. agricultural reforms), as well as restoration
activities that are feasible in areas treated under the first two.
• Protected areas: Designed to prevent land use change, protected areas are a mainstay
of biodiversity conservation. There is ample evidence proving that protected areas slow
or stop deforestation compared to unprotected areas. However, their efficacy depends
on the extent and intensity of nearby development, as well as the density of park guards.
However, their success is often challenged where institutions and political support are
weak (Busch & Ferretti-Gallon, 2017; Scullion et al., 2019).
• Payments for ecosystem services (PES): Over the past decade PES programs have
become increasingly popular as a forest conservation strategy. They come in a variety of
forms, including reducing emissions from deforestation and degradation (REDD+) and
can be implemented as a stand-alone intervention or in combination with protected
areas (Sims & Alix-Garcia, 2017). While there have been mixed reviews on their success,
PES programs can provide a strong incentive to conserve forests and can reduce
9You can also read