Business Intelligence - Computer Society of India
←
→
Page content transcription
If your browser does not render page correctly, please read the page content below
52 pages including cover

                                     Knowledge Digest for IT Community
                                     Volume No. 42 | Issue No. 7 | October 2018                                                  50/-
ISSN 0970-647X

                                        Business
                                      Intelligence
www.csi-india.org

                    COVER STORY                                                   Article
                    Business Intelligence 6                                       Importance of Bussiness Intelligence
                                                                                  in Digital Marketing 18

                    RESEARCH FRONT                                                Technical Trends
                    CRISP Model: A Structured Approach for                        Internet of Things in Business
                    Presentation of Research 11                                   Intelligence 21

CSI Communications Volume No. 42 • Issue No. 7 • OCTOBER 2018
Contents
Chief Editor
S S Agrawal
KIIT Group, Gurgaon
Published by Cover Story
AKSHAYA KUMAR NAYAK Business Intelligence 6
For Computer Society of India Neelam Jha
Editorial Board: Research front
Arun B Samaddar, NIT, Sikkim
Bhabani Shankar Prasad Mishra, CRISP Model: A Structured Approach for Presentation of Research 11
KIIT University, Bhubanewar Bhagwan Singh
Debajyoti Mukhopadhyay, MIT, Pune
Articles
J Yogapriya, Kongunadu Engg. College, Trichy
Importance of Bussiness Intelligence in Digital Marketing 18
M Sasikumar, CDAC, Mumbai, Rajshree Srivastava
R Subburaj, SRM University, Chennai
R K Samanta, Siliguri Inst. of Tech., West Bengal Technical Trends
R N Behera, NIC, Bhubaneswar Internet of Things in Business Intelligence 21
S. Suseela, Pragya Bajpai and Pooja Sharma
Sudhakar A M, University of Mysore
Sunil Pandey, ITS, Ghaziabad Articles
Shailesh K Srivastava, NIC, Patna Internal or External 24
Vishal Mehrotra, TCS Which Database Could Contribute More to Business Intelligence?
S. Balakrishnan and D. Deva
Design, Print and Dispatch by Business Intelligence on Cloud (BIC) - Merits, Challenges and Solutions 28
Sunil Gupta and Goldie Gabrani
GP Offset Pvt. Ltd.
Business Intelligence and Network Analytics: Research Directions 33
P. Aruna
PLUS
CSI Executive Committee 26
CSI Lakshmangarh Chapter Inaugural Ceremony - A Report 35
Standards, Global Practices and Latest Trends in Research Paper Publications 36
Please note: CSI Student Chapter Inaugural + Digital Security Training Workshop in association 37
CSI Communications is published by Computer
Society of India, a non-profit organization.
with CSI Noida Chapter & IT Dept., Noida Inst. of Engg. and Tech., Greater Noida,
Views and opinions expressed in the CSI UP on 8th September 2018
Communications are those of individual
authors, contributors and advertisers and they CSI 53 Annual Convention Cum Exhibition 2018 38
may differ from policies and official statements
of CSI. These should not be construed as legal 6th International Conference on Innovations in Computer 44
or professional advice. The CSI, the publisher,
the editors and the contributors are not Science & Engineering (ICICSE-2018)
responsible for any decisions taken by readers
on the basis of these views and opinions.
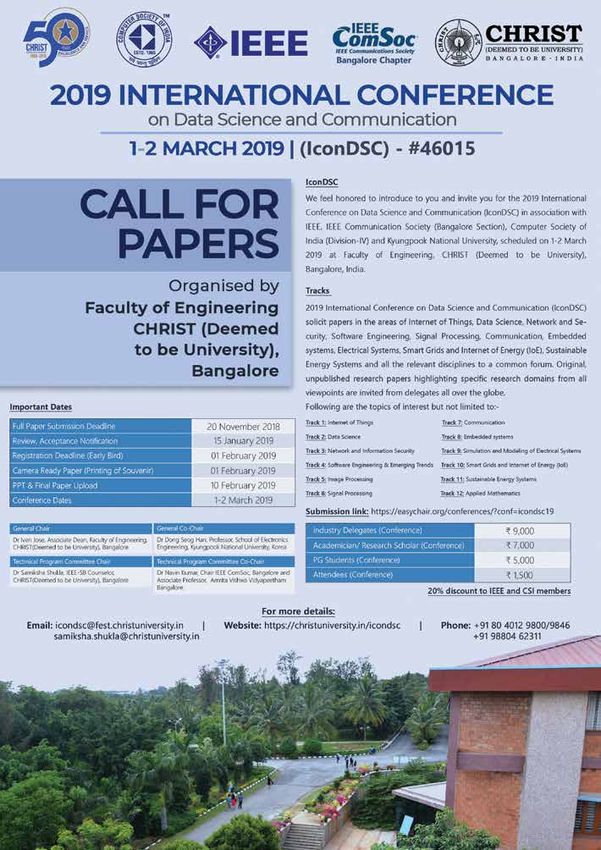
2019 International Conference on Data Science & Communication 46
Although every care is being taken to ensure
genuineness of the writings in this publication, Chapter Activities News 47
CSI Communications does not attest to the
originality of the respective authors’ content.
Student Branch News 48
© 2012 CSI. All rights reserved.
Instructors are permitted to photocopy isolated ICACCP’ 19 3rd Cover
articles for non-commercial classroom use
without fee. For any other copying, reprint or IndiaCom-2019 Back Cover
republication, permission must be obtained
in writing from the Society. Copying for other Printed and Published by Akshaya Kumar Nayak on behalf of Computer Society of India, Printed GP Offset Pvt. Ltd.
than personal use or internal reference, or of
articles or columns not owned by the Society
269, 2nd Floor, A-2, Shah & Nahar Indl. Estate, Sitaram Jadhav Marg, Lower Parel, Mumbai 400 013 and Published from
without explicit permission of the Society or Samruddhi Venture Park, Unit No. 3, 4th Floor, Marol Industrial Area, Andheri (East), Mumbai 400 093. • Email : hq@csi-india.org
the copyright owner is strictly prohibited. Editor: Prashant R. Nair
3
C S I C o m m u n ic a t i o n s | O C TO B E R 2 0 1 8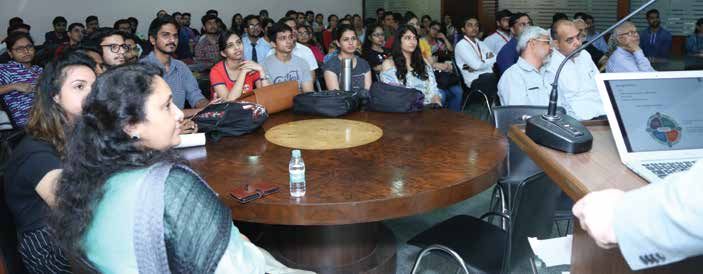
Editorial
                            Dear Fellow CSI Members,

                            “A true sign of intelligence is not knowledge but Imagination”
                            					                                          - Albert Einstein
                            “Failure is simply the opportunity to begin again, this time more intelligently”
                            								- Henry Ford

Prof. (Dr.) S. S. Agrawal
                            The current issue of CSI Communications is on Business Intelligence – An important and interdisciplinary
       Chief Editor         area of research and applications. The issue is enrich by a number of articles received from professionals,
                            researchers as well as business communities.
                            Business intelligence (BI) is a technology-driven process for analyzing data and presenting actionable
                            information to help executives, managers and other corporate end users make informed business decisions.
                            The cover story is written by Dr. Neelam Jha, Sr. Faculty of Central Bank of India, Officers Training College. The
                            article highlights the features and challenges of Business Intelligence as well as its scope. The impediments
                            of BI and how it can be used as a solution is highlighted in the present article.
                            On the research front an article on CRISP Model has been written by Prof. Bhagwan Singh from school of
                            Business Management and Science, Central University of Himanchal Pradesh. The other articles include
                            importance of BI in Digital Marketing, IOT in BI, Internal and External Databases, Business Intelligence
                            on Cloud (BIC) -Merits, Challenges and Solutions, Business Intelligence and Network Analytics: Research
                            Directions.
                            Current Trends
                            Currently organizations are starting to see that data and content should not be considered separate
                            aspects of information management, but instead should be managed in an integrated enterprise approach.
                            Enterprise information management brings Business Intelligence and Enterprise Content Management
                            together. Currently organizations are moving towards Operational Business Intelligence which is currently
                            under served and uncontested by vendors. Traditionally, Business Intelligence vendors are targeting only top
                            the pyramid but now there is a paradigm shift moving toward taking Business Intelligence to the bottom of
                            the pyramid with a focus of self-service business intelligence.
                            This issue also gives detailed information about CSI 53rd Annual Convention 2018 hosted by Udaipur Chapter
                            to be held on December 14th -16th, 2018 at the Hotel Inder Residency Udaipur – Rajasthan and ICACCP-2019,
                            INDIACom-2019. We encourage you to prepare for the same and actively participate in it. Information about
                            the activities that have taken place at various regions and divisions and the students chapters are also given.
                            We are thankful to all the contributors and look forward to receive your valuable articles in future also.
                            We express our gratitude to all the execom members and the CSI Officials. We look forward to receive
                            constructive feedback and suggestions from our esteemed members and reader of CSI fraternity. Please log
                            on to http://www.csi-india.org/ and email to csic@csi-india.org.

                            With kind regards,

                            Prof. (Dr.) S. S. Agrawal
                            Chief Editor

                                                                                                                              www.csi-india.org
                                                                          4
                                              C S I C o m m u n ic a t i o n s | O C TO B E R 2 0 1 8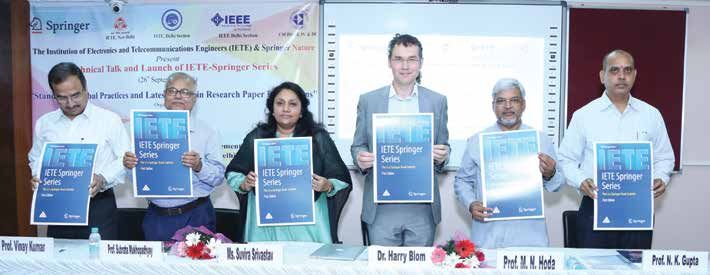
Computer Society of India
                                                                                                         TM

                                                            http://www.csi-india.org

Message from the
Vice President cum President Elect
 From : Vice President, Computer Society of India
 Date    : 01 October, 2018
 Email : vp@csi-india.org / Cell : (91) 82106 93239

Development of a country is influenced by many interrelated                 to the Respective regional Vice Presidents Prof. Arvind Sharma & Dr.
parameters like Economic, Social, Human Resource, Environment,              Vipin Tyagi along with the Chairman, Managing Committee members
Education, Infrastructure etc. Each of these parameters is important        & members of both the newly formed Chapters & wish them all the
in itself. Generally the nations face many development challenges as        best on behalf of CSI for their future activities & achievements.
a result of different combinations of these factors. It is recognized
fact that Information & Communication Technology (ICT) can help to          I seek the active & kind support of the Members to make CSI more
address the Challenges for the enhancement of the Socio Economic            Dynamic, Vibrant, Productive & Sustainable to achieve the height of
Transformation.                                                             excellence.

These are needs to bridge the gap between people with effective             I sincerely request all the Office Bearers, Executive Members, CSI
access to Digital Information & Communication Technology and those          office staffs to kindly work with responsibility for the Society (CSI)
with very limited or not capable to access at all. Computer Society of      to serve honestly for the cause of every Division, Region, Chapter,
India, since it’s inception has tried continuously for the achievement of   SIG, Student Branch & every Individual Members including Student
these national goal with multi directional approach for reaching out to     Members.
the larger section of our society.
                                                                            The 53rd Annual Convention of Computer Society of In India, CSI- 2018
CSI understands that the inclusive growth is multifaceted & can be
                                                                            is being organized by CSI Udaipur Chapter from 14-16, December
addressed as growth with justice. The justice signifies economic,
                                                                            2018 at Hotel Inder Residency, Udaipur for which the preparation is
political & social equality among all the citizens of the country.
                                                                            going in full swing under the dynamic leadership of a group of Young
Inclusive growth does not have any self mechanism to reach the
                                                                            & Visionary Professionals Mr. Amit Joshi , Chairman, Dr.Bharat Singh
deprived & excluded section of the society.
                                                                            Deora, Vice Chairman, Dr. Dinesh Sukhwal, Hony. Secretary & Mr.
Hence it is the outcome of planned & thoughtful action of Computer          Gaurav Kumawat MC member of Udaipur Chapter. The call for papers,
Society of India to go to the masses who are not being able to receive      registrations, Exhibition & other related activities have been placed
the benefit of ICT & where the CSI is having less presence.                 in this issue for the Information & perusal of the members for their
                                                                            active participation.
As the result, in the current years CSI has taken initiatives to extend
it’s presence in North East region by establishing it’s chapters at         Thanking you & wishing you a very happy & enjoyable
Nagaland, Revieving the Chapter at Guwahati, Student Branch at              Durga Puja & Vijaya Dashami.
Sikkim Manipal Institute of Technology, Sikkim, National Institute of
Technology , Shillong. All of them are engaged with good activities. We
are taking initiative to establish the CSI Chapter/Student Branches in
near future in the State of Manipur & Tripura.

In recent past two new chapters are opened, one at Agra, Uttar Pradesh      Prof. Akshaya Nayak
& another at Lakshman Garh, Modinagar, Rajasthan. I congratulate            Vice President, CSI

                                                                         5
                                             C S I C o m m u n ic a t i o n s | O C TO B E R 2 0 1 8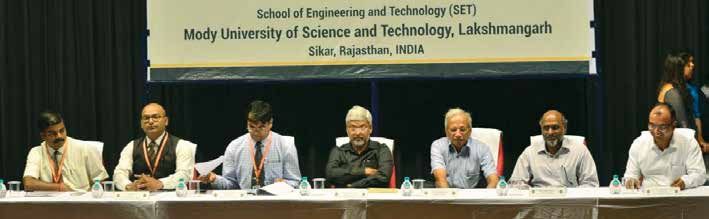
COVER STORY

Business Intelligence
   Neelam Jha
   Faculty, Central Bank of India, Officer’s Training College

                                                        Cleansing &                                                     Making
                        Data
                                                        Structuring                        Analysis                    Informed
                      Collection
                                                          of Data                                                      Decisions

Introduction
      Welcome to the world of                             per se was defined in 1989 by Howard               Privatisation and Globalisation) without
information where terabytes of data are                   Dresner, an analyst in Gartner Group.              borders. Making the battle fiercer for
being generated in nano seconds. Data                     It would be a misnomer to look at                  established players there are emerging
has really made the world inclusive in                    Business Intelligence only as a Stastical          competitive players like Start Ups,
real terms as it has no colour, caste,                    report. It is in fact a proactive tool for         Fintech, E commerce and many more.
religion or nationality what so ever. The                 customer engagement and boosting                   Today the markets are flooded with
moment a thought comes to our mind                        revenues.                                          options; a consumer is spoilt for choice
and we search for it on the internet,                                                                        and it is getting increasingly difficult to
the process of creation of data begins.                                         Data                         keep the customers loyal and engaged
Our activities of liking a blog, travelling                                                                  to particular companies’ products/
to a place or simply posting our selfies                                                                     services. Hence the companies need
creates footprints of data. We humans                                                                        to be well informed to stay ahead in
                                                                Information
are generating data at an amazing                               Technology
                                                                                           Applications      the competitive world. It is all about
speed from Australia to Antarctica.                                                                          procuring accurate information at the
This data forms the foundation for                                                                           exact time and making it available to the
information and meaningful insights for                                                                      right person.
                                                                               Business
organisations. But all of this data is not                                                                   Challenges to Business
                                                                              Management
of importance to organisations. So how                                                                            An organisation is often faced by
do they make sense of this humongous                                                                         dilemmas like pricing, sales, costs,
                                                               It is often said that you need to
amount of data? It is undoubtedly an                                                                         operations etc vis a vis changes in
                                                          be intelligent to succeed in business
uphill task.                                                                                                 business trends and customer’s
                                                          and of course ‘Nothing succeeds like
      The analysis of Demand & Supply                                                                        preferences.      There     are      issues
                                                          success”. Be it a micro enterprise or a
is the fundamental concept of business.                                                                      regarding performance, management,
                                                          big corporate, every organisation needs
It is a deciding factor in choosing the                                                                      competencies,       customer        service,
                                                          to take informed business decisions.
right product at the right price in right                                                                    recruiting right talent and of course the
                                                          The only difference is in the quantum of
market. To make these right decisions                                                                        perennial question of adopting changes.
                                                          revenue being generated. For example
organisations use various tools. One                                                                         Irrespective of the geographical location
                                                          MacDonald as well as a local vada pav
such important tool is Business                                                                              or the size or customer’s demography,
                                                          vendor both analyse the data of footfalls/
Intelligence which has gained a lot of                                                                       businesses encounter the following
                                                          online orders along with other factors to
prominence and has become an integral                                                                        questions on an ongoing basis –
                                                          decide on their working hours. And yes
part of organisations irrespective of its                                                                         Businesses seek answers to the
                                                          in the days of Swiggy/Zomato local vada
sales, volume or size.                                                                                       above questions pertaining to various
                                                          pav vendor also gets online orders!
So what is Business Intelligence?                              Data driven Decision Support                  areas of business like finance, sales,
      In   simple     words    Business                   System (DSS) is essence of business                operations, inventory management
Intelligence as per Gartner refers to                     management. To put it in another way,              etc for enhancing the effectiveness of
technologies, applications & process                      Business Intelligence is an imperative             core business procedures and better
for collection, integration & analysis of                 key to successful organisations which are          productivity. The solution lies in the data
data with motive to enhance operational                   competing in a world (of Liberalisation,           which is available in plenty. Just as bit
efficiency and revenues. It is a time
tested old concept which was more of
a decision support system in the fifties.                        Why                 What                 When            Who             How Many
However the term Business Intelligence
                                                                                                                                        www.csi-india.org
                                                                              6
                                                  C S I C o m m u n ic a t i o n s | O C TO B E R 2 0 1 8
COVER STORY

is the smallest computing unit,                                                                                                   Enterprise
raw data forms the building                    Excel                     Data Mart                Data WareHouse                  Data Ware
block for information. But being                                                                                                    House
flooded by data is not always a
good idea as a major part of this
data is ambiguous and of poor quality.
Many companies are also struggling due                                               Huge                 Uncertain
to siloed data bases, legacy issues and
lack of resources. This huge stockpile                   Inaccurate
of raw data needs to be cleaned up                                                                                        Obsolete
and properly structured to be used as a
valuable input by the organisation. Only
then can it act as the missing links in                  Unstructured
                                                                                                                        Complex
jigsaw puzzle for the business entity.
     Hence as a key business attribute,
data needs to be contextual and relevant
so as to provide meaningful insights                                              Multiple Sources of data
into customer’s behavior. This is crucial                                                                                      Device data
as all organisations these days have a
customer centric approach and they                         Survey
build their strategies accordingly.                                                                                   Location data
     There is a possibility of gathering                                   Customer data
data without information but there is                                                              Social Media
no possibility of garnering information                                                              Platform
without data which brings to the fore
-The paradox of data and its multiple
sources which is explained in the                                           Timely identification of business trends
diagram below,
     These      issues     forced     the
organisations to rethink and led to the                                           Optimum usage of resources
growth of alternative options. Smaller
organisations prefer excel/data mart
whereas bigger organisations prefer
warehouse as depicted in picture below:                                                Employee satisfaction

Journey of BI
     Customer is the king of the market
and hence the intent of the organisations                               Fastr & fact based business descisiion making
is always to analyse his behaviour and
make a proper assessment of the the
risks so as to make better business
                                                                                  360 degree view of customer
decisions. In the dynamic world
Business intelligence has been evolving
over the years. When we look at the
journey of BI, it is observed that each                                              Increase in sales & revenue
stage builds on another.
     The traditional approach worked on
                                                                                                 a linear sequential process. The journey
                                                                                                 began with a tool centric approach
                                                                                                 and slowly progressed towards being
                                                                                                 a collaborative partner of business.
                                            BI 2.0                                               The focus continued on reducing costs,
 • Data centric approach                                        • App Centric                    initiating BPR (Business Process
 • Client server Architecture    • Web Centric                  • Personal, Collaborative,       Re-engineering) and identifying new
                                 • Service Oriented            • Visual                         business opportunities in the dynamic
                                    Architecture (SOA)                                           business scenario. As we all know that
              BI 1.0                                                        BI 3.0               data driven decisions are more reliable
                                                                                                 than those based on assumption,
                                                                                                 perception or instinct. Hence the

                                                                   7
                                       C S I C o m m u n ic a t i o n s | O C TO B E R 2 0 1 8
COVER STORY
success of BI implementation hinges patterns between numbers, identifying its fundamental components is data
on data alongwith many other factors. trends and their underlining reasons. integration. It faces huge challenges as
But then there are problems galore in It is much more than just being a data is often from heterogeneous and
getting scalable, accessible and good technology, it is in fact a combination of incompatible sources.
quality data. people, process and IT as shown in the Impediments in the path of BI
The modern BI approach is about picture: Although BI is growing at a good
optimizing the execution engines while The traditional process of Business pace, yet it has not achieved its full
summarizing the technical complexities. Intelligence can be briefly understood in potential. Inspite of having a sound
Agile BI is another approach which the diagram below: technical implementation, BI projects
focuses on automation, speed, flexibility It starts with gathering of data from sometimes flounder due to lack in
and responsiveness. Further it tends to various sources and collecting it into a strategic focus. It might result in
reduce total cost of change. BI can also central repository called warehouse. budget over runs, delays in projects
be embedded directly to other platforms A data warehouse may contain one or and annoyed customers. Many a times
and hence can be used on various web many data marts. organisations treat it as a tool, rather
platforms. There are certain tools like Then in the next step of Data like an operating system. We need to
Microsoft Power BI which allow non mining (also called as knowledge understand that BI is complex and
technical users to aggregate analyze discovery in database) which is an hence it needs continuous attention.
and visualize data. While choosing integrated application, the raw data The process is time consuming, but
a BI strategy, companies can either is structured. It aims at detecting even the ancilliary steps needs to be
use tools that come free with ERP, or the hidden display patterns in the followed. Otherwise there is a possibility
purchase a third party BI solution. Big data. of incorrect conclusions being drawn.
Companies may prefer to build their The users can now create various The decision to implement BI is
own customized BI solutions. BI does reports from the data. Further taken at the topmost level and many
not operate as a single standalone tool. stastical and multidimensional times BI projects are not limited to
Along with the changes in the business analysis is done using algorithms one particular department in the
environment, BI is also becoming more and/ or models. organisation. Also there are various
adaptable & flexible. Now BI is working Various hypotheses are now tested kind of cultures in an organisation. All
towards end to end self service tool. based on the results of analysis. It these add up to creating hurdles in
There are immense benefits of could be exploratory, descriptive or implementation of BI. Some obstacles
Business Intelligence, some of which predictive in nature. to BI are given hereunder:
are enumerated below: Dashboards simplifies the complex Lack of synergy between IT &
Business Intelligence hinges on datasets and display the current Business
choosing the appropriate software that metrics and is a snapshot of various Results not forthcoming fast
is best suited to a particular business KPI(key performance indicators) Delayed results make the business
need. Microsoft, Google, SAP, IBM are and business trends and thus data look for other IT enabled solutions
leading software companies and some is turned to relevant information Businesses are looking at iterative
examples of popular BI Software/tools so as to help in the decision making process styles
are as follows: process. It is costly for small business.
How does it work? These steps are now being blended Long development life cycle
Having discussed the technology into an open, fluid interaction where Availability of too many types of
part in detail, it should not be construed experiments can be run in each phase software causes confusion for the
only as an autonomous technological of cycle individually and hence it management.
process. BI is basically a business should be given adequate importance. Struggling with unstructured data,
process wherein people take the centre BI implementation takes a lot of which does not make apparent
stage. BI is the key to prudent decision preparations beforehand and one of
making as it joins the above three
constituents to help businesses make DATA DATA DATA
optimal decisions. It helps in spotting MINING ANALYSIS
People
BI
WAREHOUSE REPORTING & DIGITAL
QUERYING DASH BOARD
Technology Process
www.csi-india.org
8
C S I C o m m u n ic a t i o n s | O C TO B E R 2 0 1 8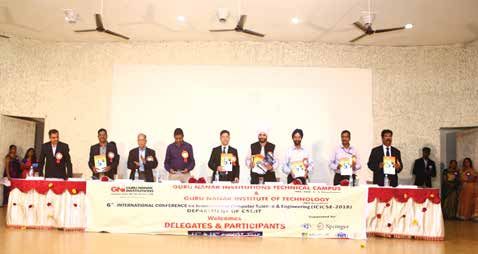
COVER STORY
sense ongoing business by automatically at deepest level
Integrating data is a tough task refreshing the data thus enabling the There should be quality
particularly when it is collected decision makers to take a suitable call checkpoints for discrepancies after
from heterogeneous sources as per the trends and business needs. data integration
Checking & validation of data is not ââ Geo spatial Applications : The ETL (Extract, Transform, and
properly It helps businesses to gain location Load) process should be carefully
Complexities & rigidities in some of based insight for effective decision monitored, so that Extract & Load
the tools making. It is very useful for organisations Process occurs at the appropriate
BI as a solution having a worldwide presence. level.
BI could be referred to as the As per the business requirements,
ââ Performance Metrics : the volume of data should be
brain in the human body. Just as It helps to organize and distribute
millions of thoughts come to us every checked with real time updates.
metrics on the performance of the Usage of probabilistic & fuzzy logic
day, out of which the brain retains the business. Organisations need profits
important information. Similarly BI is based event processing
and hence they need to quantify Continuous assessment should be
used to process important data even
performance using KPI’s. done and the strategies be modified
from disparate databases and provide
valuable insights therein. However it ââ Spreadsheet: accordingly to maximize ROI
faces various challenges and two of It has many good features and Conclusion:
them are depicted in the graph: As is still cost effective for smaller data It’s been ten years that on a black
can be seen in the graph, considerable volumes. Monday, Lehman Brothers filed for
business opportunities and time is Scope for improvement: bankruptcy thereby turning the financial
lost due to data latency (i.e. delays BI implementation projects are crisis to a near panic. The events that
in fetching data from warehouse or different from software development followed created more chaos in the
dashboard) and decision latency (delays projects. They require simultaneous world economy. To avoid such chaotic
in making informed decisions). usage of data sources and applications. situations, BI tools should be used more
Business
The success of BI depends on proactively and the information needs to
understanding the data structure be analysed accurately. It is a business
Data Latency
and its integration. BI also helps in process improvement initiative and has
maximizing the customer journey for huge potential in all areas of business
Business lost
Decision future projects. The BI should focus on
Latency Action Taken like Finance, Banking, Retail, CRM,
providing solutions to the companies Sales etc. Cloud BI is another good
Time lost for their immediate as well as long option as it provides 100% uptime and
term problems. The BI team should scalability but then the security as well
also provide early alerts on the basis of as legal issues regarding privacy need
Features in BI Solutions : patterns being generated by the data. to be dealt with.
The features of Business A few suggestions that provide the However there appears to
Intelligence help in the Decision making structured framework for improving BI: be a gap between enterprise and
process by providing meaningful Smaller but more frequent releases consumer software which is forcing
insights into customer behaviour and of functionalities/services to users the managements to rethink on ROI on
spending pattern. Let’s understand a Development team to work Business Intelligence tools. Hence one
few them: alongwith end users should also look at the collaboration
ââ OLAP: Knowing your users requirements of machine learning tools, cognitive
Online Analytical Processing helps and aspirations beforehand computing and IOET with Business
users to view data from various view Use either Inmon/Kimball as Intelligence so as to make it a driving
points; hence it can also be called per specific needs.(In Inmon force to propel the organisation
a multidimensional tool. Common methodology a design is created towards its goals. It is imperative that
operations of OLAP are Slice and Dice, before starting development of organisations have a board mandated
Drill down Up, Nesting, Pivot etc. software solutions whereas in vision and mission policy of which
Kimball focus is on deployment of Business Intelligence should form
ââ Predictive Analysis : individual solutions ) an important component. BI is not
Helps users to predict customer Get all the stakeholders (i.e. only about gathering more and more
behaviour, forecast demand and finance, marketing, operations, information for the users; rather it is
prepare strategies using various sales etc) on the same page about creating intelligent inputs for the
tools like Regression Analysis, Time The manual interventions need businesses. BI is not just a reporting
Series Model, Hypothesis Validation, to be reduced, as automated BI tool; it is in fact an instrument to redefine
Forecasting etc. data integration is seamless and the business strategies. Remember BI
ââ Interactive Dashboard : provides better experience. is not optional but mandatory. The only
It provides a real time view of the Data integration needs to be done question is how well the organisation
9
C S I C o m m u n ic a t i o n s | O C TO B E R 2 0 1 8
COVER STORY
executes it. efficiency and revenues. It is a time It would be a misnomer to look at
In simple words Business tested old concept which was more of Business Intelligence only as a Stastical
Intelligence as per Gartner refers to a decision support system in the fifties. report. It is in fact a proactive tool for
technologies, applications & process However the term Business Intelligence customer engagement and boosting
for collection, integration & analysis of per se was defined in 1989 by Howard revenues.
data with motive to enhance operational Dresner, an analyst in Gartner Group. n
About the Author
Neelam Jha (CSI membership no.: 2010000188) Currently working as Faculty, Officers Training College, Central Bank of India
Professional qualification: CAIIB, MBA, Certified Bank Trainer, Cyber Law, CeISB
Work experience: Have worked in Central Bank of India for last twenty years in various capacities: Branch Head, Credit
Officer, Faculty, Senior Internal Auditor and different verticals at Branch/Regional/Zonal Office levels.
Benefits for CSI members: Knowledge sharing and Networking
Participating in the International, National, Regional chapter events of CSI at discounted rates
Contributing in Chapter activities
Offering workshops/trainings in collaboration with CSI
Joining Special Interest Groups (SIG) for research, promotion and dissemination activities for selected domains, both
established and emerging
Delivering Guest lecturers in educational institutes associated with CSI
Voting in CSI elections
Becoming part of CSI management committee
WEB DEVOLOPMENT USING ANGULAR 5
(Academic Year 2018-19)
As per the culture of Pillai’s HOC College of Engineering, Department of Computer Engineering organizes various technical Workshops for
aspirants assembling with various interests in the field with a very high competitive spirit to participant and with the strong determination
to include their achievements & accomplishments to their resumes. For the current academic year 2018-19, we have organized a workshop
on “Web Development using ANGULAR 5” on 28th July 2018.
Workshop on “Web Development using ANGULAR 5” was conducted by Mr. Ajinkya Zore; he has four year experience in Tata Consultancy
Service [TCS]. He is Oracle Certified Professional java programmer, now he is working in BPN paribus MFID Global Market Research.
Basically ANGULAR 5 is a java script based on open source front end web application framework mainly maintained by Google.
The workshop covered some following basic and advance topic based
on ANGULAR 5:
• Basic Knowledge of ANGULAR 5 • Node Module
• Web Page Editing • ANGULAR CLI
• Dash Board • Pipes
• Background Color Editing • Routing
Workshop on “WEB DEVOLOPMENT USING ANGULAR 5” on 28th July 2018
www.csi-india.org
10
C S I C o m m u n ic a t i o n s | O C TO B E R 2 0 1 8Resea r ch f r on t
CRISP Model: A Structured Approach for
Presentation of Research
Bhagwan Singh
Head of Department, Department of Marketing & Supply Chain Management (M&SCM), School of Business & Management Science [SBMS]
Central University of Himachal Pradesh [CUHP], Dharamshala, H. P. E-mail ID: bhagwansingh.bs@gmail.com
In this article, the need for a structured module to present once research is bridged by proposing a
model christened CRISP. The model focusses on various aspects that need to be emphasised during
once presentation of Research, Thesis, or Project (RTP) so that the researcher has a guided template
that allows them to highlight their work. The model has been communicated to researchers in both pure
Science and Social Sciences and has been discussed at various platforms so as to fine tune it and make
it more comprehensive so that it could become an effective tool. CRISP model presented here has been
utilised by researchers from various disciplines in Central University of Himachal Pradesh to present
their research towards defending their thesis. The various attributes of the model have been researched
with the help of questionaire to test the effectiveness of CRISP model as an important tool to fill the
need for a uniform structured presentation approach to communicate the findings of their research. The
findings strongly support the model for implementation towards research presentations.
Introduction
A bonding between research presentation style/model/module which over the past five years and has evolved
and teaching is always deemed to be is uniformly accepted by all universities/ to the current status that is presented
spirit for higher education fraternity colleges/institutions for presenting in this paper. A need is felt to confirm
(Elen and Verburgh 2008). In keeping their Research outcomes from their the performance of the model in
with this spirit, Higher educational Thesis/Project. terms of student satisfaction. While
institutes undertake research work in When we look at presentation students’ learning approach majorly
the form of desertations, projects and of research/thesis/project (RTP) in depends upon their perceptions of a
thesis with great zeal by putting in lots higher education at the Post Doct/ particular learning context, it is also
of efforts. At the end of their research PhD/PG level, there is no such uniform based on their prior experiences of
work, the researchers have to make module/model which can be taken for studying and the present learning
a presentation. After being an active understanding the researcher’s view environment (Entwistle and Ramsden,
listener to many of these project and across the disciplines. The difference 1983; Ramsden, 2003; Zeng, et al.,
thesis presentations over a period of of presentation style from sciences 2013). To assess students’ research
time as one of the members on the to social sciences and professional experience in higher education system,
evaluation board, I have noticed that courses such as MBA, MCA etc, differs two studies are relevant. For instance,
most of the researchers tend to miss as the supervisors or guides assigned, the Postgraduate Research Experience
out on one or other of the important design their own presentation style, Questionnaire (PREQ) adopted by
components that need to be stressed and following the prevailing practices. Australian universities (Marsh, Rowe,
hence get invariably questioned by the Thus the understanding of the output & Martin, 2002) in the late-1990s to
examiners to bring out those aspects. of the presentations from both within collect information about the research
One of the major reasons for these and across disciplines becomes varied experience of postgraduate students.
lacuna is the lack of a uniform template and hence tough to be adopted by the The PREQ includes supervision,
for making their presentation. Another stakeholders. In order to fill this gap intellectual climate, infrastructure,
important aspect of a good presentation of understanding the output of the thesis examination, goals and
is, wherein the stakeholders who research done by the researchers, a expectations, overall satisfaction and
need to utilise the outcomes of the uniform presentation style is proposed skills development in postgraduate
research are able to obtain what they through the CRISP model with a vision degrees). In the similar vein, Zeng, et al.
are looking for, clearly and precisely. In to standardise the format across (2013) attempted to validate the Student
the Bhartiya (Indian) higher education disciplines. Research Experience Questionnaire
perspective of researchers’ learning The CRISP model has been (SREQ) developed in the Hong Kong
process, Currently there is no such implemented by many researchers context and to explore the relationships
11
C S I C o m m u n ic a t i o n s | O C TO B E R 2 0 1 8Resea r ch f r on t
between student research experiences “CRISP” MODEL for Presentation of Thesis / Research / Project
and their perceived skill development The “CRISP” mode is an INNOVATIVE Template for making comprehensive presentation in a structgured
and overall satisfaction. So as to manner of the work undertaken during their Thesis / Research / Project in Social Science.
streamline and give wider access to the “CRISP” is an acronym for 5 important aspects that need to be emphasised while making these
use of the CRISP model, a small study presentations in Social Science.
has been undertaken to assess the C=Concrete Issues R=Research Methodology I=Insight Generation S=Summary P=Publications
perception of the researchers who have
[A] [B] [C] [D] [E]
been using the model and those who
have participated in discussion of the I GAIN SOUL Research Framework ââ Goals Reached/Need more time
I is for Inroduction 33 Research Design ââ Gaps covered / Not Covered
presented model. The various attributes 33 Hypothesis Framing ââ Needs Satisfied / Not Satisfied
(if any)
chosen for the study are presented in G is for Gaps
33 Sample Design ââ Objectives Achieved / Not Achieved
A is for Additional Inputs ââ Hypothesis Accepted / Rejected
the next section. I is for Importance
33 Sampling Frame
33 Sample Area
N is for Need 33 Sample Size
Attributes chosen for testing 33 Data Collection & Gist & Findings
perception of the researchers’ S is for Scope Analysis/Validation
33 Statistical Tools and
Suggestions & Recommendations
O is for Objectives Conclusions
towards CRISP Model: U is for Uniqueness
Technique
33 Instrumentation/ Appebdux . Abbexyre
1. Attitude [AT] towards the L is for Limitations. Observation
presentation learning module:
Researcher’s Publications
This psychological component Researcher’s Manuscript
was measured via six items which By: Dr. Bhagwan Singh
Head of Dept. of Marketing & Supply Chain Management, School of Business &
intended to measure researchers’
Management Studies, Central University of Himachal Pradesh, Dharamshala.
attitudinal approach towards CRISP Email ID: bhagwansingh.bs@gmail.com
in terms of their like and dislike,
association and disassociation Fig. 1: “CRISP” MODEL presented in RASHTRAPATI BHAVAN in 2017 for Innovation
important and not important etc.
2. Reflection [RF] towards the in nature which covers the holistic Analysis and Results
presentation learning module: approach of research presentation The study used descriptive
The five items of this component module/model particularly named as statistics viz. percentage method, Chi-
intended to capture the reflective CRISP (i.e. five acronyms viz. Concrete square test for dichotomous questions
behaviour of researchers Issues, Research Methodology, (non-metric data) followed by T-test for
whether they are associated with Insight Generation, Summary and scaled data to measure the researchers’
CRISP module in terms of their Publications). Therefore to quantify perception/experience towards CRISP
presentation knowledge and skill the above module, the structured module.
enhancement etc. questionnaire was used to assess the The sample profile of respondents
3. Motivation [MO] towards the (scholars/students); shown in Table-1
researchers’ perception towards CRISP
presentation learning module: This ranging from gender, age, Post Doct./
module/model with the help of 23 items
psychological measure attempts Ph.D./PG opted in sciences/social
of scale which comprises of measures
to capture researchers’ motive sciences; Post Doct./Ph.D/PG pursuing
related to Attitudes [AT], Reflection [RF],
towards CRISP module as a drive years, and Post Doct./Ph.D./PG. opted
of adaptation in their research/ Motivation [MO], Skill Development
in language.
thesis presentation using four [SD] and Satisfaction [ST] reported in
Table 1 shows the frequency and
items scale. Questionnaire. Each item was asked
percentage of the total 44 respondents
4. Skill Development [SD] as by using five point Likert scale ranging
who participated in the study. The
outcome of the presentation from 1 (strongly agree) to 5 (strongly
frequency column shows that 31 male
learning module: The five items of disagree). Prior to this, brain storming
and 13 female respondents were the
this scale is intended to measure round was approached to decide the part of study. The percent column
researchers’ skill enhancement above scale items with the help of key shows that the male respondents
as an outcome variable of CRISP members including professors and accounts for 70.5 % of the total and
module. scholars. female respondents accounts for
5. Satisfaction [ST] as outcome of The questionnaires were distributed 29.5%. Total 21 respondents (47.7%)
the presentation learning module: among 50 (Fifty) Post Doct./ Ph.D/ PG belong to age group between 21-25
Finally the three items of this enrolled scholars/ students in Central years, 17 respondents (38.6%) belong
measure is used to capture the University of Himachal Pradesh from to age group between 26-30 years and 6
ultimate outcome of CRISP in terms social sciences and sciences in order to respondents (13.6%) belong to age group
of researchers’ overall satisfaction measure the perception towards CRISP between 31-35 years. majority of the
level towards the above module in module/model. After evaluating the participants of study were Post Doct./
their research presentation. missing responses, only 44 (Forty Four) Ph.D/PG students from Social science
Research Methodology responses out of 50 were found to be background i.e. 77.3% and only 22.7%
This research done is exploratory suitable for preliminary analysis. were from Science background. Among
www.csi-india.org
12
C S I C o m m u n ic a t i o n s | O C TO B E R 2 0 1 8Resea r ch f r on t
Table 1: Gender, Age and Post Doct./PhD/PG Opted, Years of Pursuing and language
Gender Age Post Doct./PhD/PG Opt Years of Pursuing Language
Frq. %tage Frq. %tage Frq. %tage Frq. %tage
Male 31 70.5 21-25 21 47.7 Science 10 22.7 1 13 29.5 English 44 100.0
Female 13 29.5 26-30 17 38.6 S Science 34 77.3 2 17 38.6 Total 44 100.0
Total 44 100.0 31-35 6 13.6 Total 44 100.0 3 4 9.1
Total 44 100.0 4 5 11.4
5 5 11.4
Total 44 100.0
Table 2: Awareness towards Research/Thesis/Project (RTP) presentation-I
Need for a module of RTP Know any RTP module If yes specify the RTP module
Freq. %tage Freq. %tage Freq. %tage
Yes 41 93.2 Yes 20 45.5 CRISP 20 45.5
No 3 6.8 No 24 54.5 Other 24 54.5
Total 44 100.0 Total 44 100.0 Total 44 100.0
Table 3 : Awareness towards Research/Thesis/Project (RTP) presentation-II
Whether CRISP provided informative Whether CRISP developed your RTP Whether CRISP covered all aspects of
material for RTP Presentation Presentation skills research
Freq. %tage Freq. %tage Freq. %tage
Respondents Respondents Respondents
24 54.5 24 54.5 24 54.5
Not included Not included Not included
Yes 19 43.2 Yes 17 38.6 Yes 17 38.6
No 1 2.3 No 3 6.8 No 3 6.8
Total 44 100.0 Total 44 100.0 Total 44 100.0
these, 29.5% respondents are pursuing found that 45.5% of respondents know not developed their RTP Presentation
Post Doct./Ph.D/PG since one year, about module for RTP presentation and skills. The data reveals that 38.6% of
38.6% are pursuing Post Doct./Ph.D/PG 54.5% do not know about these kinds respondents said that CRISP covered
since two years, 9.1% are pursuing Post of modules. It was quite interesting all aspects of research work in the said
Doct./Ph.D/PG since three years, 11.4% to know that 45.5% of respondents module and only 6.8% respondents said
are pursuing Post Doct./Ph.D/PG since know about CRISP model as a module that CRISP has not covered all aspects
four years and only 11.4% are in their for presentation and 54.5% do not of research work in the said module.
fifth year of Post Doct./Ph.D/PG. It can know about any module, but after Table 4 shows that the results
be stated that majority of students are presentation of this CRISP module, of chi square test for gender {χ(1) =
pursuing Post Doct./Ph.D/PG since two now they are aware of such model of 1.350, p = 0.245}, age {χ(2) = 3.107, p =
years. All the respondents have adopted presentation. 0.211}, Post Doct./Ph.D/PG opted {χ(1)
English as a medium of instruction and The above data reveals that 54.5% = 1.073, p = 0.585} reveals that there is
presenting their Post Doct./ Ph.D/ PG. of the respondents do not know about no statistically significant association
Tables- 2 & 3 depict the descriptive CRISP were excluded from the study. between Gender, age, Post Doct./Ph.D/
statistics of researchers’ awareness The rest of 45.5% of respondents who PG opted and a need for any kind of
towards CRISP model based know about CRISP were considered for module for RTP presentation. This
presentation in terms of Yes/ No type further interpretation. Among these reveals that male and female, all age
answers. respondents 43.2% said that CRISP groups of students and students from
Table-2 illustrates that 93.2% of provided them informative material different education equally prefers for
respondents feel that there should be for RTP Presentation where as 2.3% any kind of module for RTP presentation.
any kind of module for RTP presentation refused the statement. Total 38.6% of The results of chi square test for
whereas only 6.8% respondents do not respondents said that CRISP developed genders {χ(1) = 1.605, p = 0.205}, Age
feel that there should be any kind of their RTP Presentation skills and only {χ(2) = 0.797, p = 0.671}, Post Doct./
module for RTP presentation. It was 6.8% respondents said that CRISP has Ph.D/PG opted {χ(1) = 1.076, p = 0.584}
13
C S I C o m m u n ic a t i o n s | O C TO B E R 2 0 1 8Resea r ch f r on t
Table 4: Chi Square Test for Gender, Age, Post Doct./Ph.D/PG Opted
* Do you feel that there should be any kind of module for research presentation
Value df Asymp. Sig. (2-sided)
Gender Pearson Chi-Square 1.350a 1 0.245
Age Pearson Chi-Square 3.107a 2 0.211
Phd./Post Doct. Opted Pearson Chi-Square 1.073a 2 0.585
Total 100.0
a. 2 cells (50.0%) have expected count less than 5. The minimum expected count is 0.71.
b. Computed only for a 2x2 table
Table 5: Chi Test for Gender, Age, Post Doct./Ph.D/PG opted
* Do you know any model for making Research presentation
Value df Asymp. Sig. (2-sided)
Gender Pearson Chi-Square 1.605a 1 0.205
Age Pearson Chi-Square 0.797a 2 0.671
Post Doct./Ph.D/PG Opted Pearson Chi-Square 1.076a 2 0.584
2 cells (50.0%) have expected count less than 5. The minimum expected count is 0.71.
Computed only for a 2x2 table
are insignificant for knowledge of any module for RTP presentation. This reveals that male and female, all age groups of students
and students from different education equally prefers respondents have equal Knowledge of any module for RTP presentation.
Overall Perception (which includes: AT: Attitude; RF: Reflection; MO: Motivation; SD: Skill Development and ST: Satisfaction)
of Research Degree scholars (RDs)/Students towards CRISP model for RTP (Research/ Thesis/ Project) presentation.
Table 6: T test Perceptions Vs Gender & Post Doct./Ph.D/PG Opted
Independent Samples Test Between Perception of RDs/ Students towards CRISP model for
RTP presentation and Gender and Post Doct./Ph.D/PG Opted
t test for equality of Result t test for equality of means for Post
means for Gender Doct./Ph.D/PG Opted
t df Sig. 2 t df Sig. 2 Result
tailed tailed
AT1 I am interested in the above model of -1.094 42 0.280 Insignificant -0.650 41 0.519 Insignificant
research presentation in general.
AT2 I think that the above model in my -0.969 42 0.338 Insignificant -1.239 41 0.222 Insignificant
discipline is important.
AT3 I think that basic research design should 0.613 42 0.543 Insignificant 0.847 41 0.402 Insignificant
be enough in my Ph.D/PG course
AT4 I think that the application of above model -0.787 42 0.436 Insignificant -0.045 41 0.965 Insignificant
should be essential in my Ph.D/PG
AT5 I would like to know more about the above 0.150 42 0.881 Insignificant -0.939 41 0.353 Insignificant
model of research process
AT6 Applying the above model is important for -1.650 42 0.106 Insignificant -0.236 41 0.815 Insignificant
effective thesis presentation.
RF1 I have assimilated knowledge about -0.794 42 0.431 Insignificant 3.038 22.645 0.006 Significant
‘CRISP’ Model for RTP presentation.
RF2 I have learned to pay attention to the way 1.496 42 0.142 Insignificant -0.403 41 0.689 Insignificant
research is carried out.
RF3 Attention has been paid to hidden issues 0.933 42 0.356 Insignificant 0.160 41 0.874 Insignificant
of RTP.
RF4 There are opportunities to talk with -0.344 42 0.732 Insignificant 1.169 41 0.249 Insignificant
researchers about presentation skills
www.csi-india.org
14
C S I C o m m u n ic a t i o n s | O C TO B E R 2 0 1 8Resea r ch f r on t
Independent Samples Test Between Perception of RDs/ Students towards CRISP model for
RTP presentation and Gender and Post Doct./Ph.D/PG Opted
t test for equality of Result t test for equality of means for Post
means for Gender Doct./Ph.D/PG Opted
t df Sig. 2 t df Sig. 2 Result
tailed tailed
RF5 The five key aspects of thesis presentation 0.669 42 0.507 Insignificant 0.115 41 0.909 Insignificant
should be essential part of the Ph.D/
PG/ Research methodology coursework/
curriculum.
MO1 I am inspired to learn more about the 0.639 42 0.526 Insignificant 0.498 41 0.621 Insignificant
emerging issues of CRISP model
MO2 My understanding of related concepts in -1.437 42 0.158 Insignificant 0.972 41 0.337 Insignificant
the domain has increased
MO3 I have become enthusiastic about my -0.211 42 0.834 Insignificant -0.206 41 0.837 Insignificant
research/thesis presentation
MO4 My interest in research/thesis/ -0.985 42 0.330 Insignificant -0.531 41 0.598 Insignificant
presentation has increased
SD1 I have learned to develop my ideas and -.360 42 0.721 Insignificant 0.326 41 0.746 Insignificant
present them in my research work.
SD2 The above model has sharpened my -1.969 41 0.056 Insignificant -0.145 40 0.885 Insignificant
research presentation skills.
SD3 The above model let me feel confident -1.083 42 0.285 Insignificant 0.094 41 0.925 Insignificant
about tackling unfamiliar issues in my
research work
SD4 The above model helps me to develop a 0.046 41 0.963 Insignificant 0.352 40 0.727 Insignificant
range of communication skills.
SD5 The above model has helped me to -0.388 42 0.700 Insignificant 0.094 41 0.925 Insignificant
develop the ability to make presentation
independently
ST1 Overall, I am satisfied with the quality of 0.897 42 0.375 Insignificant -0.763 41 0.450 Insignificant
learning experience of CRISP.
ST2 Overall, I am satisfied with the contents of -0.059 42 0.953 Insignificant -0.297 41 0.768 Insignificant
CRISP for presentation skills.
ST3 Overall, I am satisfied with the use of -0.063 42 0.950 Insignificant 0.446 41 0.658 Insignificant
CRISP for RTP.
The above table shows the values of T test for Perceptions Vs Gender & Post Doct./Ph.D/PG Opted. It can be illustrated that
all male, female and students from different education have similar perception towards CRISP model except Post Doct./Ph.D/
PG Opted & RF1: I have assimilated knowledge about ‘CRISP’ Model for RTP presentation. Here the different levels of student’s
posses’ different knowledge about CRISP. It can be interpreted that different education level of students differently understands
about the CRISP model.
Overall Perception Score between 4-5 (Agree-Strongly Agree)
100% 0.759 0.772 AT1
0.841 0.819 0.818
80%
0.795 0.75 0.659 0.750.772 0.818 0.704 0.750.773
0.773 AT2
60% 0.659 0.614 0.591
0.728 0.773 0.569
40% 0.477 0.773 AT3
20%
AT4
0%
AT1
AT2
AT3
AT4
AT5
AT6
RF1
RF2
RF3
RF4
RF5
MO1
MO2
MO3
MO4
SD1
SD2
SD3
SD4
SD5
ST1
ST2
ST3
AT5
Fig. 2 : Perception Score for Agree to Strongly Agree responses
15
C S I C o m m u n ic a t i o n s | O C TO B E R 2 0 1 8Resea r ch f r on t
Fig. 2 reveals that students’ overall adopted in various science disciplines engaging in following this model since
perception towards CRISP model is which are completely in variance with last 5 years in the development of CRISP
satisfactory as majority of responses the social sciences methodology. model. I will also extend my thanks to
are in between 4-5 on the Likert scale The findings conclude that the teachers and students of Dept. of
i.e. agree to strongly agree. the researchers/students strongly Marketing & Supply Chain Management
Conclusion recommend the CRISP model for (M&SCM) and teachers & students
The research findings for Chi- making presentations, because it will from other departments of our School
square test between gender, age and bring uniformity and clarity for the of Business and Management Studies
Ph.D. opted and need for any Research stakeholders and researchers alike. (SBMS) in adopting and supporting the
presentation model states that all the The respondent’s perception scores model of CRISP.
male-females, different age groups and interpret and recommend CRISP model References
Ph.D. researchers of Social Sciences & for making research presentation. [1] Elen, J., & Verburgh, A. (2008). Bologna
Sciences equally shown preference for The model could be further tested by in European research universities.
a structured model to help in making researchers other than those at the Implications for bachelor and master
universities, such as the corporate and programs. Antwerpen: Garant.
their presentation. Prior to the CRISP
government sectors. [2] Entwistle, N.J., & Ramsden, P. (1983).
model, all the researchers involved Understanding student learning.
in answering the questionnaire were Acknowledgement London and Canberra: Croom Helm.
unaware of any such model and they all I would like to acknowledge the [3] Marsh, H.W., Rowe, K.J., & Martin,
appreciated the fact that now a uniform long discussions with Prof. (Dr) O.S.K.S. A. (2002). PhD students’ evaluations
presentation model is available for Sastri and his efforts to involve his of research supervision: Issues,
them to present their work. research students to implement the complexities and challenges in a
The results of T-Test for Ph.D. opted CRISP model for making their research nationwide Australian experiment in
benchmarking universities. Journal of
Vs Perception statements, illustrates presentations. These efforts have
Higher Education, 73(3), 313–348.
that there is no significant difference tremendously improved the various [4] Ramsden, P. & Moses, I. (1992)
between Social Sciences and Sciences aspects of the model. I would also like Associations between research and
Ph.D. researchers with regard to the to thank Prof. (Dr) Deepak Pant who teaching in Australian higher education,
presentation style as proposed in CRISP has included the CRISP model as part Higher Education, 23, pp. 273-295.
model. of innovations at Rashtrpati bhavan. [5] Ramsden, P. (2003). Learning to teach
The experts from sciences like This has provided both motivation and in higher education (2nd ed.). London:
Physics, Environment etc., when inspiration to take this effort forward Routledge.
[6] Zeng, L. M., Webster, B. J., & Ginns,
consulted about CRISP model said with zeal. I would like to appreciate
P. (2013). Measuring the research
that some more effort is needed for the support given by my Post Doct. experience of research postgraduate
its implementation in science streams, Student Dr. Sachin Kumar and research students in Hong Kong. Higher
especially with regard to the Research scholars Dr. Devendra Nasa, Dr. Education Research & Development,
methodology section of the model. This Rishi Kant, Mr. Deepak Jaiswal and 2013Vol. 32, No. 4, 672–686.
is due to the very varied methodologies Mr. Kamlesh Kumar for constantly
ANNEXURE: Final CRISP Model (2 Pages)
ANNEXURE: Final CRISP Model Slide wise for presentation of RTP.
Slide 1 Slide 5 Slide 9
Slide 2 Slide 6 Slide 10
www.csi-india.org
16
C S I C o m m u n ic a t i o n s | O C TO B E R 2 0 1 8Resea r ch f r on t
Slide 3 Slide 7 Slide 11
Slide 4 Slide 8 Slide 12
ANNEXURE: Final CRISP Model Slide wise for presentation of RTP.
Slide 13 Slide 14 Slide 15
About the Author
Dr. Bhagwan Singh, Head of Department (HoD) of Marketing & Supply Chain Management (M&SCM), School of
Business & Management Studies (SBMS) in the Central University of Himachal Pradesh (CUHP), Dharamshala,
District Kangra, H.P. He is Academic Council (AC) Member of Central University of Himachal Pradesh (CUHP).
He is Coordinator of MOOCs Prakosht of CUHP. He is also the Chairman of Management Research Circle
(MRC) of SBMS, CUHP, Member of School Board of SBMS and Chairman of Board of Studies (BoS) of Dept. of
Marketing & Supply Chain Management (M&SCM), SBMS. He has also been Chairman of Management Society
of SBMS. He held Faculty Development Program CBPF sponsored by ICSSR, in December 2013 which brought
good credit to his department and University. Having 18 years of his teaching experience in MBA/MCA UG/PG/
PhD & Post Doc, he has authored TWO Books based on Web Based Marketing and further engaged in writing
books on Green Marketing & IT based Marketing. E-mail-ID: bhagwansingh.bs@gmail.com
17
C S I C o m m u n ic a t i o n s | O C TO B E R 2 0 1 8You can also read