Butterflies in the United Kingdom: habitat specialists and species of the wider countryside, 1976 to 2020 - Date: September 2021
←
→
Page content transcription
If your browser does not render page correctly, please read the page content below
Butterflies in the United Kingdom:
habitat specialists and species of
the wider countryside, 1976 to 2020

Date: September 2021
We are the Department for Environment, Food and Rural Affairs. We’re responsible for
improving and protecting the environment, growing the green economy, sustaining thriving
rural communities and supporting our world-class food, farming and fishing industries.

We work closely with our 33 agencies and arm’s length bodies on our ambition to make
our air purer, our water cleaner, our land greener and our food more sustainable. Our
mission is to restore and enhance the environment for the next generation, and to leave
the environment in a better state than we found it.

© Crown copyright 2021
This information is licensed under the Open Government Licence v3.0. To view this
licence, visit www.nationalarchives.gov.uk/doc/open-government-licence/

This publication is available at www.gov.uk/government/publications

Responsible statistician: Christine Holleran

Any enquiries regarding this publication should be sent to us at

Department for Environment, Food and Rural Affairs, Foss House, Kings Pool, 1-2
Peasholme Green, York, YO1 7PX

Public enquiries and user feedback: 03459 335577 or enviro.statistics@defra.gov.uk

Press enquiries: 02082 257317

Website: https://www.gov.uk/government/collections/biodiversity-and-wildlife-statistics

                                                                                     2 of 15
Contents
In this release ......................................................................................................................4
Habitat specialists ................................................................................................................4
Species of the wider countryside .........................................................................................6
Assessment .........................................................................................................................7
Relevance ............................................................................................................................8
Background..........................................................................................................................8
Butterflies of the wider countryside on farmland .............................................................11
Butterflies of the wider countryside in woodland .............................................................13
Web links ...........................................................................................................................14
Next publication date .........................................................................................................15
3 of 15In this release
This release covers 2 measures of annual butterfly population abundance: the first for
habitat specialist butterflies (species strongly associated with semi-natural habitats such
as chalk downland) and the second for more widespread butterflies found in both semi-
natural habitats and the wider countryside in the UK. These statistics contribute to a suite
of indicators due to be updated in October this year (UK Biodiversity Indicators, 2021);
earlier data availability is allowing their release ahead of that publication.
• Since 1976, the unsmoothed habitat specialist butterfly index has fallen by 61%.
• Over the same period, the unsmoothed index for species of the wider countryside has
fallen by 22%.
• Large fluctuations in numbers between years are a typical feature of butterfly
populations, principally in response to weather conditions. Despite the sunniest spring
on record, 2020 was only an average year for butterflies in the UK with more than half
of all species (32 from 58, or 55%) decreasing in annual abundance, after a summer
which was duller and wetter than average.
• The statistical assessment of change is made on an analysis of the underlying
smoothed trends. Since 1976, populations of habitat specialists have declined
significantly though species of the wider countryside show no significant change.
Assessments of the short-term trends (2015 to 2020) show no significant change for
either habitat specialists or species of the wider countryside.
Habitat specialists
Habitat specialist species, which are vulnerable to semi-natural habitat loss and
fragmentation, have not recovered from declines experienced in the late 1970s. These
declines were mainly attributed to the knock-on effects of the drought conditions
experienced in 1976. Overall, the habitat specialist index declined by 61% between 1976
and 2020 (Figure 1). Analysis of the smoothed trend shows a statistically significant
reduction in relative abundance over the period 1976 to 1979. The index showed an
increase over the period 2015 to 2020 from 32% to 39% of the 1976 level, however,
analysis of the smoothed trend showed no statistically significant short-term change.
Individual butterfly species fare differently within the overall trend. Habitat specialists
showing the greatest long-term decline since 1976 include heath fritillary; wood white;
Lulworth skipper; grayling; and small pearl-bordered fritillary. No species show a
significant short-term decline since 2015. Silver-spotted skipper; large heath; black
hairstreak; silver-washed fritillary; and dark green fritillary show the largest significant
increases over the long term, whilst silver-studded blue is the only species of habitat
specialist butterfly to show a statistically significant increase since 2015.
4 of 15Figure 1: Trends for habitat specialist butterflies in the UK, 1976 to 2020
United Kingdom
120
100
Index (1976 = 100)
80
Habitat specialist butterflies (26)
60
40
20
0
1976 1981 1986 1991 1996 2001 2006 2011 2016
100
90 Increased
80
Percentage of species
70
60
No change
50
40
30
20 Decreased
10
0
Long term Short term
(1976-2020) (2015-2020)
Notes:
1. The line graph shows the unsmoothed trend (dashed line) and the smoothed trend
(solid line) together with its 95% confidence interval (shaded).
2. The figure in brackets shows the number of species included in the index.
3. The bar chart shows the percentage of species within the indicator that have shown a
statistically significant increase, a statistically significant decrease or no statistically
significant change (little change).
4. Since 2017, an improved analysis method has been used to derive the species indices
and in 2020, improvements were made to better account for the colonisation of sites
5 of 15(see ‘Background’ section for further information); therefore, the charts presented here
are not directly comparable to those presented in releases prior to 2020.
Source: Butterfly Conservation, UK Centre for Ecology & Hydrology, Defra, British Trust
for Ornithology, Joint Nature Conservation Committee.
Species of the wider countryside
The species of the wider countryside index showed a decrease of 22% between 1976 and
2020 (Figure 2); however, analysis of the smoothed trend shows the change was not
statistically significant. The index showed an increase over the period 2015 to 2020, from
69% to 78% of the 1976 level, however, analysis of the smoothed trend also showed this
short-term change is not statistically significant.
Individual butterfly species again fare differently within the overall trend. Species of the
wider countryside showing the greatest long-term declines include wall; small tortoiseshell;
white-letter hairstreak; small heath; and gatekeeper. No wider countryside butterfly
species show a significant short-term decline since 2015. Ringlet; comma; speckled wood;
and marbled white show the largest significant increases over the long term. Small Heath
shows a significant short-term increase since 2015.
Figure 2: Trends for butterflies of the wider countryside in the UK, 1976 to 2020
United Kingdom
120
100
Index (1976 = 100)
80
60
40
Butterflies of the wider countryside (24)
20
0
1976 1981 1986 1991 1996 2001 2006 2011 2016
6 of 15100
90 Increased
80
Percentage of species
70
60
No change
50
40
30
20 Decreased
10
0
Long term Short term
(1976-2020) (2015-2020)
Notes:
1. The line graph shows the unsmoothed trend (dashed line) and the smoothed trend
(solid line) together with its 95% confidence interval (shaded).
2. The figure in brackets shows the number of species trends included in the index.
3. This indicator includes individual measures for 25 species of butterflies; the UK wider
countryside butterfly index, however, only includes 24 trends. This is because an
aggregate trend is used for small skipper (Thymelicus lineola) and Essex skipper
(Thymelicus sylvestris); these 2 species have been combined due to historical
difficulties with distinguishing between them in the field.
4. The bar chart shows the percentage of species within the indicator that have shown a
statistically significant increase, a statistically significant decrease or no statistically
significant change (little change).
5. Since 2017, an improved analysis method has been used to derive the species indices
and in 2020, improvements were made to better account for the colonisation of sites
(see ‘Background’ section for further information); therefore, the charts presented here
are not directly comparable to those presented in releases prior to 2020.
Source: Butterfly Conservation, UK Centre for Ecology & Hydrology, British Trust for
Ornithology, Defra, Joint Nature Conservation Committee.
Assessment
Long and short-term assessments of the statistical significance of changes over time (that
is, since the time series began in 1976 and over the latest 5 years) are based on
smoothed data, with the analysis of the underlying trend performed by the data providers.
Latest-year changes are based on unsmoothed data. While this final period is too short to
7 of 15make any meaningful assessment, when the change exceeds a 1% threshold, the
direction is given simply as an acknowledgement of very recent trends and as a possible
early indication of emerging trends.
Habitat specialist butterflies:
• Long term (1976 to 2020) – deteriorating,
• Short term (2015 to 2020) – little or no overall change, and
• Latest year (2020) – decreased
Butterflies of the wider countryside:
• Long term (1976 to 2020) – little or no overall change,
• Short term (2015 to 2020) – little or no overall change, and
• Latest year (2020) – decreased
Relevance
Butterflies are considered to provide a good indication of the broad state of the
environment because they respond rapidly to changes in environmental conditions and
habitat management, occur in a wide range of habitats, and are representative of many
other insects, in that they utilise areas with abundant plant food resources. Butterflies are
complementary to birds and bats as indicator species, especially the habitat specialists,
because they use resources in the landscape at a much finer spatial scale than either
birds or bats. There are also long-term data available on changes in populations of
butterflies which help in the interpretation of shorter-term fluctuations.
Background
This indicator is comprised of 2 multi-species indices compiled by Butterfly Conservation
(BC) and the UK Centre for Ecology & Hydrology (UKCEH) from data collated through the
UK Butterfly Monitoring Scheme (UKBMS) including from the Wider Countryside Butterfly
Survey (WCBS). The indicator includes individual measures for 26 habitat specialist
butterflies (low mobility species restricted to semi-natural habitats) and 25 more
widespread butterflies (which use both semi-natural and general countryside habitats)
using data collected at 5,917 sample locations (see Figure 3). The UK wider countryside
butterfly measure, however, only includes 24 trends because an aggregate trend is used
for small skipper (Thymelicus lineola) and Essex skipper (Thymelicus sylvestris). These 2
species have been combined due to historical difficulties with distinguishing between them
in the field.
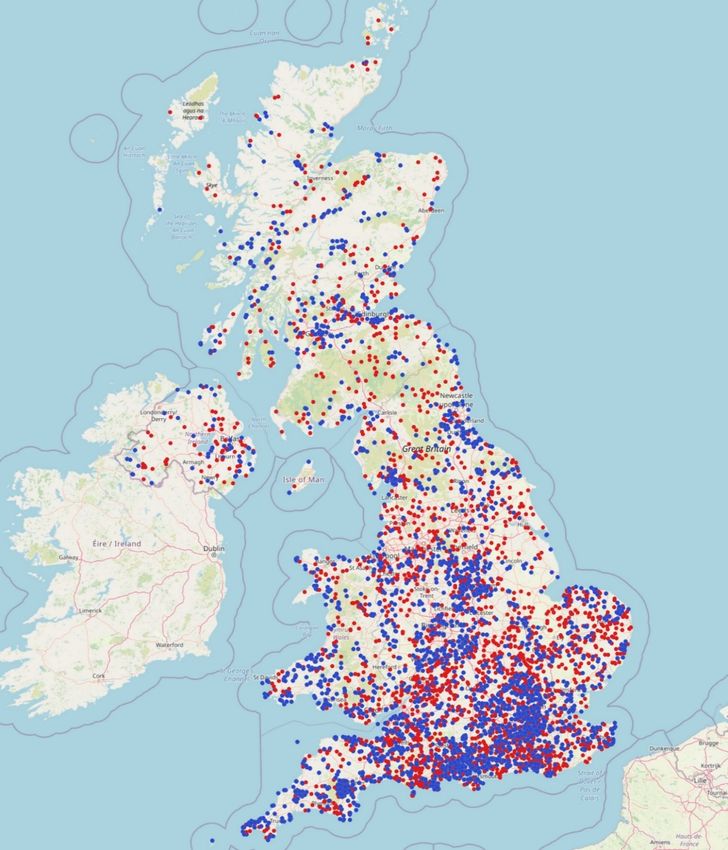
8 of 15Figure 3: Locations of the 3,768 UK Butterfly Monitoring Scheme sites (blue) and the 2,149
Wider Countryside Butterfly Survey squares (red) as of 25 August 2021.
The year-to-year fluctuations in butterfly numbers are often linked to natural environmental
variation, especially weather conditions. Therefore, in order to identify underlying patterns
in population trends, the assessment of change is based on smoothed indices. The
smoothed trend in the multi-species indicator is assessed by structural time-series
analysis. A statistical test is performed using the software ‘TrendSpotter’ to compare the
difference in the smoothed index in the latest year versus other years in the series. Within
the measures, each individual species trend is given equal weight, and the annual figure is
the geometric mean of the component species indices for that year.
9 of 15Populations of individual species within each measure may be increasing or decreasing,
irrespective of the overall trends. The bar chart provided alongside each trend graph
above shows the percentage of species within that indicator that have shown a statistically
significant increase, a statistically significant decrease or no statistically significant change
(little change). A list of species included within each index, together with a summary of the
estimated long-term and short-term changes for each species and an assessment of the
individual species trends can be found in the accompanying data set.
In 2017, the method for compiling species annual indices was improved. Indices are now
calculated for all species using the Generalised Abundance Index (GAI) method
developed in 2016 (Dennis et al. (2016) BIOMETRICS: DOI: 10.1111/biom.12506) with an
additional modification that the data from each site in each year is weighted in the final
stage relative to the proportion of the species flight period surveyed that year for that site.
This weighting is necessary as the GAI extrapolates from observed data to estimate the
total count across the season, accounting for gaps in the recording, and ensures that the
observed data have a stronger effect upon the final indices than the extrapolated data.
The improved method uses butterfly count data collected at both UKBMS butterfly transect
and reduced effort sites (3,768) and randomly selected 1 km squares of the WCBS (2,149)
(see Figure 3 for the locations of these sites). All butterfly counts in a season are used to
estimate the seasonal pattern of butterfly counts for that year, using a concentrated
likelihood method (see Dennis et al. (2016)); the resulting indices and species trends are
similar to those generated through analysis methods used prior to 2017.
In 2020, further methodological improvements were made to better model trends for
species that have expanded in range and colonised new sites (UKBMS transects and
WCBS squares) by adding pre-colonisation zero abundance counts for species at sites
they have colonised, where the site was being monitored prior to colonisation. At the time,
the effect of these changes was most notable for species such as Essex/small skipper and
purple hairstreak, where there was a slight reduction in their population indices for the
earlier years relative to the latter years.
As there are delays in data submission, data for previous years are also updated
retrospectively. This means that the species indices for individual years may vary from
previous publications.
Further details of the methods used can be found on the UKBMS website and in the
Technical background document for this indicator.
Since 2019, 2 additional multi-species indices have also been compiled for butterflies in
the UK: the first for butterflies of the wider countryside on farmland, the second for
butterflies of the wider countryside in woodland. Although these habitat-specific measures
are not included within the formal assessment for ‘Butterflies in the United Kingdom:
habitat specialists and species of the wider countryside’, they are presented here in order
to give a more complete picture of the trends for UK butterfly populations.
10 of 15These habitat indices include 23 species of wider countryside butterflies surveyed on
farmland and 25 species surveyed in woodland; the farmland and woodland indices,
however, only include 22 and 24 trends respectively. This is because an aggregate trend
is used for small skipper (Thymelicus lineola) and Essex skipper (Thymelicus sylvestris);
these 2 species have been combined due to historical difficulties with distinguishing
between them in the field. The indices use data collected at 4,143 locations with farmland
habitat and 2,871 locations with woodland habitat (these farmland and woodland locations
are subsets of the 5,917 locations shown in Figure 3). A list of species included within
each index, together with a summary of the estimated long-term and short-term changes
for each species and an assessment of the individual species trends can be found in the
accompanying data set.
The assessment of change for these habitat measures is made on an analysis of the
underlying smoothed trends, however, the base year for the long-term trends is 1990
rather than 1976. This is because prior to this date, there are insufficient data for a number
of species included within the 2 indices. Since 1990, UK populations of wider countryside
butterflies on farmland show no significant long-term change, whilst in woodland,
butterflies have declined significantly. Since 2015, the short-term trends for both farmland
and woodland butterflies show no statistically significant change.
Butterflies of the wider countryside on farmland
The wider countryside farmland butterflies index for the UK increased by 2% between
1990 and 2020. The index also increased in the 5 years to 2020, from 4% below its 1990
level in 2015 to 2% above this level in 2020 (Figure 4). Analysis of the smoothed trends
shows that neither increase is statistically significant.
Individual butterfly species fare differently within the overall stable long-term trend.
Species in significant long-term decline on farmland include small tortoiseshell; wall;
Scotch Argus; gatekeeper; and Essex/small skipper. No species decreased on farmland
over the short term (since 2015). Three species, the ringlet; speckled wood; and
brimstone, increased significantly on farmland over the long term, whilst small heath and
small copper have increased significantly over the short term.
11 of 15Figure 4: Trends for butterflies of the wider countryside on UK farmland, 1990 to 2020
United Kingdom
160
140
120
Index (1990 = 100)
100
80
60
40
Butterflies of the wider countryside
20 on farmland (22)
0
1990 1994 1998 2002 2006 2010 2014 2018
100
90 Increased
80
Percentage of species
70
60
No change
50
40
30
20 Decreased
10
0
Long term Short term
(1990-2020) (2015-2020)
Notes:
1. The line graph shows the unsmoothed trend (dashed line) and the smoothed trend
(solid line) together with its 95% confidence interval (shaded).
2. The figure in brackets shows the number of species trends included in the index.
3. This indicator includes individual measures for 23 species of butterflies; the UK
farmland butterflies index, however, only includes 22 trends. This is because an
aggregate trend is used for small skipper (Thymelicus lineola) and Essex skipper
(Thymelicus sylvestris); these 2 species have been combined due to historical
difficulties with distinguishing between them in the field.
12 of 154. The bar chart shows the percentage of species within the indicator that have shown a
statistically significant increase, a statistically significant decrease or no statistically
significant change (little change).
5. In 2020, improvements were made to the analytical techniques to better account for the
colonisation of sites (see ‘Background’ section for further information); therefore, the
charts presented here are not directly comparable to those presented in releases prior
to 2020.
Source: Butterfly Conservation, UK Centre for Ecology & Hydrology, British Trust for
Ornithology, Defra, Joint Nature Conservation Committee.
Butterflies of the wider countryside in woodland
The wider countryside woodland butterfly index for the UK decreased by 42% between
1990 and 2020 but increased in the 5 years to 2020, from 51% of its 1990 level in 2015 to
58% of its 1990 level in 2020 (Figure 5). Analysis of the smoothed trends shows a
statistically significant decline since 1990 but no significant change in the short term.
The long-term decline of woodland butterflies is thought to be due to a lack of woodland
management and loss of open spaces in woods. Species showing the greatest long-term
significant declines in woodland include wall; small tortoiseshell; small copper; Essex/small
skipper; and gatekeeper. No species show a significant decline in the short term. Ringlet
displayed the same trends in woodland as on farmland, increasing significantly over the
long term, but showing no significant change since 2015. Small heath and white-letter
hairstreak show a significant short-term increase.
Figure 5: Trends for butterflies of the wider countryside in UK woodland, 1990 to 2020
United Kingdom
120
100
Index (1990 = 100)
80
60
40
20 Butterflies of the wider
countryside in woodland (24)
0
1990 1994 1998 2002 2006 2010 2014 2018
13 of 15100
90 Increased
80
Percentage of species
70
60
No change
50
40
30
20 Decreased
10
0
Long term Short term
(1990-2020) (2015-2020)
Notes:
1. The line graph shows the unsmoothed trend (dashed line) and the smoothed trend
(solid line) together with its 95% confidence interval (shaded).
2. The figure in brackets shows the number of species trends included in the index.
3. This indicator includes individual measures for 25 species of butterflies; the UK
woodland butterfly index, however, only includes 24 trends. This is because an
aggregate trend is used for small skipper (Thymelicus lineola) and Essex skipper
(Thymelicus sylvestris); these 2 species have been combined due to historical
difficulties with distinguishing between them in the field.
4. The bar chart shows the percentage of species within the indicator that have shown a
statistically significant increase, a statistically significant decrease or no statistically
significant change (little change).
5. In 2020, improvements were made to the analytical techniques to better account for the
colonisation of sites (see ‘Background’ section for further information); therefore, the
charts presented here are not directly comparable to those presented in releases prior
to 2020.
Source: Butterfly Conservation, UK Centre for Ecology & Hydrology, British Trust for
Ornithology, Defra, Joint Nature Conservation Committee.
Web links
Butterfly Conservation: The state of Britain’s butterflies
Joint Nature Conservation Committee: UK Biodiversity Indicators
14 of 15UK Butterfly Monitoring Scheme: Butterflies as indicators
Next publication date
Summer 2022
15 of 15You can also read