California Fish and Wildlife - Journal for the Conservation and Management of California's Species and Ecosystems
←
→
Page content transcription
If your browser does not render page correctly, please read the page content below
California Fish and Wildlife

                 107       • SPRING 2021 • NUMBER
          VOLUME                                           2

    Journal for the Conservation and Management of
          California’s Species and Ecosystems

 Published Quarterly by the California Department of Fish and Wildlife
STATE OF CALIFORNIA
                                    Gavin Newsom, Governor

                  CALIFORNIA NATURAL RESOURCES AGENCY
                   Wade Crowfoot, Secretary for Natural Resources

                             FISH AND GAME COMMISSION
                                    Eric Sklar, President
                           Jacque Hostler-Carmesin, Vice President
                                   Russell Burns, Member
                                   Peter S. Silva, Member
                                 Samantha Murray, Member

                         Melissa Miller-Henson, Executive Director

                        DEPARTMENT OF FISH AND WILDLIFE
                          Charlton “Chuck” Bonham, Director

                            CALIFORNIA FISH AND WILDLIFE
                                  EDITORIAL STAFF

Ange Darnell Baker............................................................................Editor-in-Chief
Lorna Bernard............................Office of Communication, Education and Outreach
Neil Clipperton, Scott Osborn, Laura Patterson, Dan Skalos,
Katherine Miller Karen Converse, Kristin Denryter, Matt Meshiry,
Megan Crane, and Justin Dellinger.................................................. Wildlife Branch
Felipe La Luz and Ken Kundargi......................................................... Water Branch
Jeff Rodzen, Jeff Weaver, John Kelly, and Erica Meyers................ Fisheries Branch
Cherilyn Burton, Katrina Smith
and Grace Myers........................................... Habitat Conservation Planning Branch
Kevin Fleming................................................Watershed Restoration Grants Branch
Jeff Villepique and Steve Parmenter....................................... Inland Deserts Region
James Ray and Peter McHugh............................................................ Marine Region
David Wright and Mario Klip.................................................. North Central Region
Ken Lindke, Robert Sullivan, and Jennifer Olson........................... Northern Region
Lauren Damon............................................................................... Bay Delta Region
Randy Lovell............................................................................Aquaculture Program
Jennifer Nguyen............................................................................ Cannabis Program
California Fish and Wildlife
VOLUME 107          SPRING 2021          NUMBER 2

                Published Quarterly by

                 STATE OF CALIFORNIA
       CALIFORNIA NATURAL RESOURCES AGENCY
          DEPARTMENT OF FISH AND WILDLIFE
                 ISSN: 2689-419X (print)
                ISSN: 2689-4203 (online)
                        --LDA--
California Fish and Wildlife Journal

The California Fish and Wildlife Journal is published quarterly by the Califor-
nia Department of Fish and Wildlife. It is a journal devoted to the conservation
and understanding of the flora and fauna of California and surrounding areas. If
its contents are reproduced elsewhere, the authors and the California Department
of Fish and Wildlife would appreciate being acknowledged.

Please direct correspondence to:
Ange Darnell Baker
Editor-in-Chief
California Fish and Wildlife
Angela.Baker@wildlife.ca.gov

Inquiries regarding the reprinting of articles and publishing in future issues can be
directed to the Subscription Manager via email at publications@wildlife.ca.gov.

Alternate communication format is available upon request. If reasonable
accommodation is needed, call 916-322-8911 or the California Relay (Telephone)
Service for the deaf or hearing-impaired from TDD phones at 800-735-2929.

Contents
Notes from the Editor
ANGE DARNELL BAKER.............................................................................................. 54

Advancing bird survey efforts through novel recorder technology
and automated species identification
MATTHEW TOENIES AND LINDSEY N. RICH....................................................... 56

Field Trial Comparing Two Materials for Marine Oil Sheen Sampling
BRUCE M. JOAB, JAMES MCCALL, MICHAEL J. ANDERSON,
AND MICHAEL AMMANN............................................................................................ 71

The distribution of anadromy and residency in steelhead/rainbow trout in the
Eel River, northwestern California
BRET HARVEY, RODNEY J. NAKAMOTO, ADAM J. R. KENT, AND
CHRISTIAN E. ZIMMERMAN..................................................................................... 77

Western Message Petroglyphs indicate historic beaver presence in a San Francisco
Bay Area watershed
LEIGH MARYMOR AND RICHARD BURNHAM LANMAN..................................... 89

Comparing camera traps and visual encounter surveys for monitoring
small animals
MADISON K. BOYNTON, MATTHEW TOENIES, NICOLE CORNELIUS, AND
LINDSEY N. RICH........................................................................................................... 99

BOOK REVIEW: Into Wild Mongolia........................................................................ 118

In Memoriam: Andrew M. Pauli (1953–2021)............................................................ 120

INFORMATION FOR AUTHORS........................................................................... 123

California Fish and Wildlife 107(2):54; 2021
Notes from the Editor
The spring issue of 2021 is following the same pattern as the winter issue in coming
late, and likely for the same reason—the impact that the COVID-19 pandemic has had on
the research community. Amazingly, this is the first issue in quite a while where I have no
new Associate Editors to introduce—perhaps I finally have enough to cover the diverse
manuscript topics the Journal receives.
This issue begins with a fascinating study examining the effectiveness of four differ-
ent acoustic recorders for bird detection as well as assessing the effectiveness of a new AI
method of automated species identification. Technology in the wildlife field has advanced
significantly in recent years providing researchers with methods that are less invasive, more
efficient, and cheaper than ever before. The researchers in this study, who are part of CDFW’s
Wildlife Branch, discovered that the lowest-cost recorder (which is also significantly smaller
than traditional acoustic recorders) performed just as well as higher-cost recorders—and
that species detections were significantly higher than traditional, point-count methods! And
the automated species identification platform, BirdNET, was extremely accurate, correctly
identifying 96% of species—this truly has significant implications for future bird research.
The next article, a combined effort from CDFW’s Office of Spill Prevention and
Response unit and the Chevron Corporation, describes a trial to compare two methods for
sampling oil sheens in marine environments. They concluded that the material used by
CDFW, a fiberglass material, and that used by the U.S. Coast Guard, a tetrafluoroethylene-
fluorocarbon (TFE-fluorocarbon) polymer net, were both suitable methods of collection
material for chemical forensic analyses.
The third article, with researchers from the Forest Service, USGS, and Oregon State
University, focuses on the distribution of both anadromous (steelhead) and resident (rain-
bow) trout in northwestern California. They found a widespread distribution of fish that had
resident mothers, suggesting the importance of preserving freshwater conditions that are
suitable for resident trout, notably maintaining stream flows throughout the dry season. This
information is especially relevant and timely given the state’s current drought-conditions.
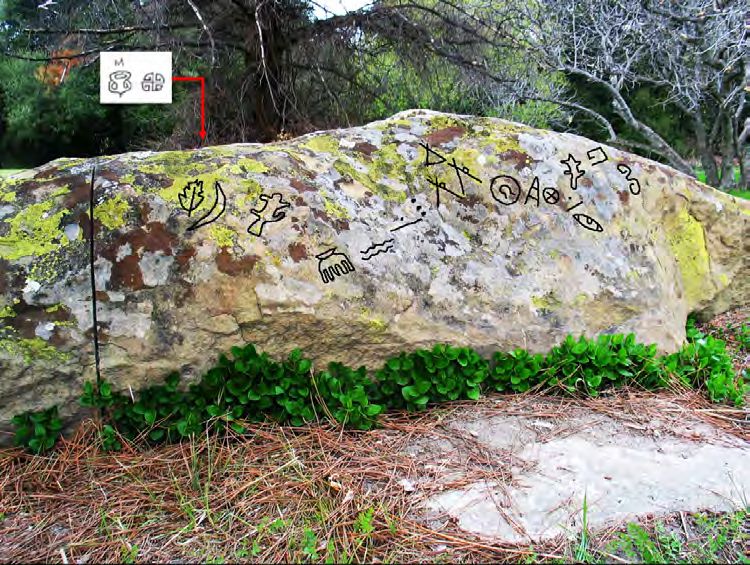
Next up, a very interesting article that used Western Message Petroglyphs—a type
of picture-writing from the late 1800s/early 1900s, likely used by non-Native Americans
with a knowledge of Native American symbols—found in the San Francisco Bay Area to
demonstrate the likely presence of a beaver lodge in the area of Alameda Creek in the late
1800s. This record was possibly the last one before beavers were locally extirpated as a
result of the fur trade.
The last article, again by CDFW researchers from the Wildlife Branch, compares
a commonly used method for surveys of herpetofauna (reptiles and amphibians), visual
encounter surveys (VES) with cover boards, to a more novel method which combines a
drift fence with camera traps. They determined that the drift fence/camera trap technique
outperformed the VES detecting significantly more herp species—as well as a number of
other small animals, including small mammals, birds, and invertebrates. Again, as with the
first article, many will be pleased to find that a newer method using modern technology
can replace the extremely time-intensive method of on-the-ground species surveys—we
Spring 2021                          NOTES FROM THE EDITOR                                55

can get substantially more data with considerably less time and effort, a win-win situation
for wildlife researchers.
       The issue concludes with a book review of George B. Schaller’s Into Wild Mongolia
by Dr. Vernon Bleich (former editor of this journal) and a tribute in memoriam of Andrew
M. Pauli, a long-time wildlife biologist for the Department.
       Earlier this summer, we were finally able to complete the special issue on CESA (Cali-
fornia Endangered Species Act), which, with 27 articles, marked the largest issue the Journal
has ever published (473 pages!)—and an issue that I personally am extremely proud of; my
special issue guest editorial team put in a huge amount of work to get the issue completed,
and it shows! And keep your eyes out for our final special issue of the year which will cover
the topic of Human-Wildlife Interactions.

Ange Darnell Baker, PhD
Editor-in-Chief
California Fish and Wildlife Journal
California Fish and Wildlife 107(2):56-70; 2021                    www.doi.org/10.51492/cfwj.107.5

FULL RESEARCH ARTICLE

Advancing bird survey efforts through novel recorder
technology and automated species identification
MATTHEW TOENIES1* AND LINDSEY N. RICH1
1
 California Department of Fish and Wildlife, Wildlife Branch, 1010 Riverside Parkway,
West Sacramento, CA 95605, USA

* Corresponding Author: matthew.toenies@wildlife.ca.gov

                Recent advances in acoustic recorder technology and automated
          species identification hold great promise for avian monitoring efforts.
          Assessing how these innovations compare to existing recorder models and
          traditional species identification techniques is vital to understanding their
          utility to researchers and managers. We carried out field trials in Mon-
          terey County, California, to compare bird detection among four acoustic
          recorder models (AudioMoth, Swift Recorder, and Wildlife Acoustics
          SM3BAT and SM Mini) and concurrent point counts, and to assess the
          ability of the artificial neural network BirdNET to correctly identify bird
          species from AudioMoth recordings. We found that the lowest-cost unit
          (AudioMoth) performed comparably to higher-cost units and that on aver-
          age, species detections were higher for three of the five recorder models
          (range 9.8 to 14.0) than for point counts (12.8). In our assessment of
          BirdNET, we developed a subsetting process that enabled us to achieve
          a high rate of correctly identified species (96%). Using longer recordings
          from a single recorder model, BirdNET identified a mean of 8.5 verified
          species per recording and a mean of 16.4 verified species per location over
          a 5-day period (more than point counts conducted in similar habitats). We
          demonstrate that a combination of long recordings from low-cost recorders
          and a conservative method for subsetting automated identifications from
          BirdNET presents a process for sampling avian community composition
          with low misidentification rates and limited need for human vetting. These
          low-cost and automated tools may greatly improve efforts to survey bird
          communities and their ecosystems, and consequently, efforts to conserve
          threatened indigenous biodiversity.

               Los recientes avances en la tecnología de grabación acústica y en
          la identificación automatizada de especies son muy prometedores para
          los esfuerzos de monitoreo aviar. Evaluar cómo estas innovaciones se
          comparan con los modelos de grabadora existentes y las técnicas tradicio-
          nales de identificación de especies es vital para entender su utilidad para
          investigadores y gerentes. Realizamos ensayos de campo en el condado
Spring 2021         NOVEL RECORDERS AND AUTOMATED BIRD IDENTIFICATION                     57

          de Monterey, California, para comparar la detección de aves entre cuatro
          modelos de grabadora acústica (AudioMoth, Swift Recorder y Wildlife
          Acoustics SM3BAT y SM Mini) y conteos por puntos simultáneos, y
          para evaluar la capacidad de la red neuronal artificial BirdNET en iden-
          tificar correctamente las especies de aves de las grabaciones AudioMoth.
          Encontramos que la unidad de menor costo (AudioMoth) funcionaba de
          manera equiparable a unidades de mayor costo y que, en promedio, las
          detecciones de especies eran más altas para la mayoría de los grabadoras
          (rango 9.8 a 14.0) que para los conteos por puntos (12.8). En nuestra
          evaluación de BirdNET, desarrollamos un proceso de subconjuntos que
          nos permitió alcanzar una alta tasa de especies correctamente identifica-
          das (96%). BirdNET identificó una media de 8.5 especies verificadas por
          registro y una media de 16.4 especies verificadas por ubicación (más que
          conteos por puntos realizados en hábitats similares). Demostramos que
          una combinación de grabaciones de larga duración con grabadoras de bajo
          costo y un método conservador para el subconjunto de identificaciones
          automatizadas de BirdNET presentan un proceso para tomar muestras de
          la composición de la comunidad aviar con bajas tasas de identificación
          errónea y necesidad limitada de verificación humana. Estas herramientas
          automatizadas y de bajo costo pueden facilitar en gran medida esfuerzos
          en examinar las comunidades de aves y sus ecosistemas y, en consecuen-
          cia, los esfuerzos para conservar la biodiversidad indígena amenazada.

Key words: acoustic monitoring, ARU, AudioMoth, autoclassification, BirdNET, birds,
point count, species identification
__________________________________________________________________________

       Acoustic monitoring is a non-invasive approach for surveying wildlife that uses remote
acoustic technologies to record sounds emitted by vocalizing species (Blumstein et al. 2011).
These autonomously triggered tools, also known as autonomous recording units (ARUs),
hold many advantages over more traditional approaches like direct observations (e.g., point
counts), given they allow scientists to collect information 24 hours per day and on multiple
species from multiple taxa, all while minimizing the impacts of observer disturbance and
bias during data collection (Brandes 2008; Heinicke et al. 2015; Sebastián-González et al.
2018; Shonfield and Bayne 2017). Further, all acoustic recordings can be permanently stored,
allowing them to function as digital archives that can be revisited when new questions or
technologies emerge (Chambert et al. 2018). Arrays of fixed acoustic sensors have been
used to sample ecosystems (e.g., soundscapes in temperate forests and rainforests [Sethi et
al. 2020]), taxonomic groups (Brandes 2008; Ribeiro et al. 2018; Walters et al. 2012; Wood
et al. 2019), and individual species (Campos-Cerqueira and Aide 2016; Heinicke et al.
2015). They have also been used to help address questions regarding, for example, species
distributions (Campos-Cerqueira and Aide 2016), spatial and temporal dynamics (Bader et
al. 2015), phenology (Furnas and McGrann 2018), and spatial variation in habitat quality
(Sethi et al. 2020).
       Despite the many advantages of acoustic monitoring, there are also several potential
limitations. First, differences between acoustic recorders and traditional survey methods
58                             CALIFORNIA FISH AND WILDLIFE                        Vol. 107, No. 2

may complicate comparisons of data from acoustic recorders to results from established
long-term population monitoring programs employing point counts. For example, while
acoustic recorders tend to perform equally to humans conducting point counts in estimat-
ing bird species richness (Darras et al. 2018), they tend to underperform in estimating bird
density or require a secondary source of information (Stevenson et al. 2015). Research
focused on estimating avian density from acoustic recordings is a rapidly growing field,
however, which has had success and will likely have even greater success as automated and
open-source sound localization software is developed (Blumstein et al. 2011; Sebastián-
González et al. 2018; Perez-Granados et al. 2019; Rhinehart et al. 2020; Stevenson et al.
2021). Additionally, researchers have successfully integrated avian survey data from point
counts and acoustic recorders and have given specific recommendations on sampling birds
with acoustic recorders to achieve results comparable to those from point counts (Darras et
al. 2018). For example, Stewart et al. (2020) used statistical offsets, or correction factors,
to integrate data from point counts and ARUs.
       A second potential limitation is the high cost of acoustic recorders, which can restrict
their usage in many contexts (Hill et al. 2019; Rhinehart et al. 2020). Wildlife Acoustics
Recorders (Wildlife Acoustics, Maynard, MA, USA) can cost upwards of $1,000, for ex-
ample, meaning a project with 100 survey locations would need a minimum budget of over
$100,000. Recently, however, low-cost alternatives like the AudioMoth (Open Acoustic
Devices 2020) have been developed. The AudioMoth is a full-spectrum recorder that fits
in the palm of a hand and has a cost of approximately 60 USD per unit (Hill et al. 2019).
AudioMoths have proven successful for a variety of wildlife monitoring and conservation
projects (Prince et al. 2019) but for a full understanding of their utility, need to be directly
compared to other acoustic recorder models.
       A final challenge associated with acoustic monitoring is the terabytes of sound files
that can be produced, within which the sound of interest must be located and correctly
identified to species (Chambert et al. 2018; Wrege et al. 2017). Accomplishing the latter
by manually reviewing the spectrograms of all recordings requires an immense amount of
effort (Campos-Cerqueira and Aide 2016). Thus, many researchers now rely on custom
designed algorithms or commercially available sound analysis software to automate species
identification (Brandes 2008; Gibb et al. 2019; Heinicke et al. 2015; Kalan et al. 2015).
One recently developed tool is BirdNET, an artificial neural network that can automatically
identify over 900 bird species (Kahl 2020). In an initial assessment of 225 recordings,
BirdNET was found to have an overall accuracy (i.e., correctly identified vocalizing bird
species) of 91.5% (Arif et al. 2020). Additional assessments of the accuracy of BirdNET
are needed, however, given it is an extremely new and evolving tool.
       The goal of our study is to help address these research gaps by assessing the ef-
ficacy of several acoustic recorder models in detecting birds and one sound analysis tool
in identifying birds. Specifically, we 1) compared species-level detection rates among the
acoustic recorder models and concurrent point counts; and 2) evaluated BirdNET’s ability
to correctly identify bird species from acoustic recordings. Understanding the optimal way
to collect and process acoustic recordings of birds will help inform the design and feasibil-
ity of future large-scale bird monitoring efforts and enable managers to combat challenges
associated with acoustic monitoring head-on.
Spring 2021 NOVEL RECORDERS AND AUTOMATED BIRD IDENTIFICATION 59
METHODS
Study Area
We conducted fieldwork within the Hastings Natural History Reservation in Monterey
County, California, USA (36.380, -121.564). This reserve covers 950 ha, and vegetation
at the study area is primarily oak (Quercus sp.) woodland and chaparral (Griffon 1990).
Mean annual temperature is 13.4 °C, and mean annual precipitation is 522 mm (McMahon
et al. 2015).
Field Methods
Comparison among acoustic recorder models and point counts.—At each of three
survey locations, we installed five acoustic recorders between 24 June and 26 June 2020:
one Song Meter SM3BAT (Wildlife Acoustics), one Song Meter Mini Acoustic Recorder
(Wildlife Acoustics), one Swift Recorder (Cornell Lab of Ornithology Bioacoustics Re-
search Program), and two AudioMoths (Open Acoustic Devices) that were programmed
with different acoustic settings (Table 1). We attached recorders to securely placed T-posts
approximately 2 m above the ground. While recorders did not all face the same direction,
recorder directionality should not have led to any bias in the mean number of species detected
by any one recorder type compared to the others. We programmed all acoustic recorders
to record from 0500 to 0800 Pacific Daylight Time (PDT), capturing peak hours of avian
vocal activity.
Table 1. Means and standard deviations for numbers of bird species identified using six methods employed during
the same four survey events: field-based surveys (point counts) and five acoustic recorder types. Also included are
the recorder settings used and the cost per unit of each recorder. We collected all data at Hastings Natural History
Reservation in Monterey County, CA, USA, 2020.
Survey method Mean (SD) species Gain (dB) Sample rate Cost per unit
identified (kHz) (USD)
Swift Recorder 9.8 (1.5) 38 48 250.00
AudioMoth 1 11.8 (1.5) 27.2 48 59.99
Point count 12.8 (1.5) NA NA NA
AudioMoth 2 13.3 (1.7) 32 32 59.99
Song Meter Mini 13.5 (1.7) 24 48 499.00
Song Meter SM3BAT 14.0 (2.2) 24 48 1,265.00
An observer trained in the aural and visual identification of California birds conducted
a concurrent 6-minute point count survey at each of the recorder locations between 0600
and 0800 PDT. We followed methods outlined in McLaren et al. (2019), where we collected
information on every individual bird detected, including the species identification, minute
of first detection, and estimated distance from observer. We repeated surveys (recordings
and point counts) at one of the locations on a second date, for a total of four survey events
at the three survey locations.60 CALIFORNIA FISH AND WILDLIFE Vol. 107, No. 2
Assessment of BirdNET performance.—We deployed ten additional AudioMoths to
evaluate BirdNET’s ability to correctly identify bird species. Specifically, we installed a
single AudioMoth approximately 2 m above the ground at each of ten locations spaced by
a minimum of 500 m. We placed AudioMoths inside small, resealable plastic bags along
with desiccant bags to protect them from moisture. We programmed AudioMoths (hardware
version 1.1.0) using firmware version 1.4.0 and set them to record with a gain of Medium
(30.6 dB), a sample rate of 48 kHz, and a recording period from 2000 to 0630 PDT (10.5
hr) for five consecutive days between 16 June and 26 June. Thus, we used fifty recordings
for this analysis (five recordings from each of ten locations).
Data Processing and Analyses
Comparison among acoustic recorder models and point counts.—From each record-
ing, we selected the 6-minute time span corresponding to the 6-minute point count for that
date and location. We listened to each recording once, identifying the species audible in
the recording. We calculated means and standard deviations for the numbers of bird spe-
cies detected by the human observer (both from point counts and from recordings). We
performed all data summaries and analyses in RStudio (RStudio 1.3.1073, www.rstudio.
com, accessed 17 Aug 2020).
Assessment of BirdNET performance.—To evaluate BirdNET’s ability to correctly
identify bird species from acoustic recordings, we processed the 10.5-hour AudioMoth
recordings using BirdNET (version available at https://github.com/kahst/BirdNET) run
through Python version 3.8.2 in Ubuntu 20.04.1. We supplied BirdNET with the week of
the year, latitude, and longitude corresponding to the recording location. We left all other
BirdNET settings as defaults. To limit the number of false positive species records (i.e.,
instances when BirdNET identified species in a recording that were not actually audible),
we used several parameters to subset species detections from BirdNET. First, we removed
species that only had a single detection across all five recordings for the location since these
were more likely to represent misidentifications or species flying over but not occupying
the location. Second, we subsetted BirdNET output based on two parameters that it assigns
for every identification: 1) confidence, indicating the degree of confidence BirdNET has in
each species identification (on a scale where 0 represents lowest confidence and 1 represents
highest confidence); and 2) rank, which indicates the species with the highest confidence
value when BirdNET identifies multiple possible species. We chose to only include detec-
tions if BirdNET assigned them a Rank of 1 and a Confidence value of 0.95 or higher so
that we would retain only the highest confidence detections. Finally, we excluded purported
detections of diurnal species if they were detected during the nighttime (2100 to 0430 PDT).
We did this to correct for BirdNET’s tendency to produce high-confidence false positive
detections at higher rates during this period (often due to apparent misidentifications of
rustling vegetation or vocalizations from nocturnal animals). We believe that excluding
these purported detections reduced false positive identifications without compromising our
ability to detect these species because any diurnal species acoustically active at a location
should be more active outside nighttime hours.
Following the subsetting process, we listened to select portions of the sound files to
confirm whether the species BirdNET identified were audible in each recording. We did not
listen to all 10.5 hours of each recording, but rather skipped to the times of the recording forSpring 2021 NOVEL RECORDERS AND AUTOMATED BIRD IDENTIFICATION 61
which BirdNET had produced detections. We calculated the mean and standard deviation for
the number of species identified per recording, including the number of species identified
but not confirmed to be audible by the human observer (false positives) and the number of
species identified and confirmed to be audible (true positives). We also calculated the mean
and standard deviation for the number of species identified (including true and false posi-
tives) at the survey location level, by determining the cumulative total number of species
identified across the five recordings from each location.
RESULTS
Comparison of Acoustic Recorder Models
We identified 26 bird species across the concurrent point counts and recordings (Table
2). Steller’s Jay (Cyanocitta stelleri, n = 24) and warbling vireo (Vireo gilvus, n = 24)
were detected by all methods during all survey events. We identified two species on point
counts but not on recordings: white-breasted nuthatch (Sitta carolinensis) and house wren
(Troglodytes aedon), although we detected calls from an unidentified wren species on all
recordings. We identified three species on recordings but not on point counts: Black-headed
grosbeak (Pheucticus melanocephalus), bushtit (Psaltriparus minimus), and house finch
(Haemorhous mexicanus). The highest mean number of species was identified via the Song
Meter SM3BAT and the lowest via the Swift Recorder (Table 1). While the mean number
of species identified during point counts was higher than that of two recorders, we found
that on average, AudioMoths (with higher gain and lower sampling rate programming) and
both Wildlife Acoustics recorders resulted in higher mean numbers of species identifications
than point counts (Table 1).
Assessment of BirdNET Performance
Across the ten locations, BirdNET identified 42 species that we confirmed to be audible
in the 10.5-hr AudioMoth recordings (Appendix I). The species identified from the most
recordings were Pacific-slope flycatcher (Empidonax difficilis, n = 25), California scrub-
jay (Aphelocoma californica, n = 24), and California towhee (Melozone crissalis, n = 24).
The mean number of species detected by BirdNET and subsequently confirmed was 8.5 per
recording (range 3–15, SD = 3.5). The mean number of false positive species records was
0.3 per recording (range 0–2, SD = 0.6), which equated to a false positive (misidentifica-
tion) rate of 3.8% of species records. Cumulative species totals from the five recordings at
each location showed that BirdNET correctly identified a mean of 16.4 species per location
(range 8–23, SD = 5.3; Table 3) and misidentified 1.6 species per location (range 0–3, SD
= 1.0; Table 3).
For two species identified by BirdNET, we removed detections from our results because
we could not distinguish sounds to the species level. These species were chestnut-backed
chickadee (Poecile rufescens), detected in 5 recordings, where call notes were indistin-
guishable from those of oak titmouse (Baeolophus inornatus), and white-crowned sparrow
(Zonotrichia leucophrys), with a single unidentifiable call note from one recording. BirdNET
identified six species that were not detected by the human observer in any recording, with
five of these misidentified in a single recording each (Appendix II).62 CALIFORNIA FISH AND WILDLIFE Vol. 107, No. 2
Table 2. Bird species identified using six methods employed at the same locations and times: field-based surveys
(point counts) and five acoustic recorder types. For each method, we list the number of surveys (n = 4) during
which the species was identified. We collected all data at Hastings Natural History Reservation in Monterey
County, CA, USA, 2020.
Species Swift Audio- Audio- Song Meter Song Meter Point
Recorder Moth 1 Moth 2 Mini SM3BAT count
acorn woodpecker 2 3 4 4 4 4
American robin 1 1 2 3 4 2
band-tailed pigeon 0 0 2 2 3 2
black-headed grosbeak 1 1 1 1 1 0
Bullock’s oriole 1 1 1 1 1 1
bushtit 0 0 1 1 0 0
California towhee 2 2 2 2 2 2
hairy woodpecker 0 1 1 1 1 1
house finch 0 0 1 0 0 0
house wren 0 0 0 0 0 1
Hutton’s vireo 2 4 4 4 3 2
lesser goldfinch 1 1 1 1 1 2
mourning dove 2 3 2 3 3 2
northern flicker 2 2 2 2 2 2
Nuttall’s woodpecker 1 0 0 0 1 1
oak titmouse 3 4 4 4 4 4
Pacific-slope flycatcher 3 3 3 2 3 3
purple finch 0 2 3 4 3 3
red-shouldered hawk 0 0 0 0 1 1
song sparrow 3 2 3 3 3 2
spotted towhee 2 3 2 2 2 3
Steller’s jay 4 4 4 4 4 4
warbling vireo 4 4 4 4 4 4
western bluebird 1 1 1 1 1 1
white-breasted nuthatch 0 0 0 0 0 1
wrentit 2 3 3 3 3 3
Total 39 47 53 54 56 51
DISCUSSION
The use of passive acoustic monitoring methods in terrestrial systems has been in-
creasing exponentially since the 1990s (Sugai et al. 2019). Balancing the trade-off between
high-quality recordings and costs is vital for researchers and managers considering these
methods. In our comparison of four acoustic recorder models and concurrent point counts,
we found that the lowest-cost units, AudioMoths, performed comparably to higher-costSpring 2021 NOVEL RECORDERS AND AUTOMATED BIRD IDENTIFICATION 63
Table 3. Cumulative numbers of bird species identified by BirdNET, an artificial neural network, from
AudioMoth acoustic recordings from ten locations in Hastings Natural History Reservation, Monterey
County, CA, USA, 2020. Numbers represent cumulative totals across five 10.5-hr recordings (52.5
total hours) taken at each location. True positive species are those that a human observer confirmed
to be audible in recordings, while false positive species are those that the observer could not confirm.
Site ID True positive species False positive species
1 17 2
2 20 3
3 13 2
4 8 2
5 15 0
6 23 1
7 21 1
8 23 1
9 10 1
10 14 3
Mean 16.4 1.6
units as measured by the number of species identified by a human listener. Specifically, we
found that Wildlife Acoustics SM3BAT and SM Mini, the highest cost recorders we tested,
had the highest quality recordings with means of 14 and 13.8 species detected, respectively,
compared to 13.3 for the AudioMoth. In some cases, however, the mean number of species
identified using AudioMoths exceeded that of the higher cost units, as well as point counts.
Researchers and managers with diverse project needs must decide if these small differences
in the mean numbers of species detected are worth an eight- to 21-fold increase in equipment
costs. For large-scale acoustic monitoring or assessment projects requiring many record-
ers, our results suggest that the low-cost AudioMoth can provide acoustic data of sufficient
quality to justify trade-offs demanded by factors such as budget constraints and the risk of
recorder loss or damage.
We recognize that the results of our comparison among acoustic recorders and point
counts are based upon a small sample size. It was also not possible to program all record-
ers with the exact same gain and sample rate settings, which would have provided a more
standardized comparison among recorder models. We encourage larger scale studies that
further examine the relative performance of acoustic recorder models, especially as new
models rapidly become available.
Like costs, the time required to process sound files (i.e., identifying vocalizing animals
to species) has been identified as a challenge associated with acoustic monitoring (Campos-
Cerqueira and Aide 2016; Chambert et al. 2018; Wrege et al. 2017). We found that by sub-
setting results from BirdNET, a freely available tool that automates species identifications,
we achieved a high rate of true positive species identifications and a misidentification rate
of less than 4%, which is lower than that reported for humans in other studies. For example,
Campbell and Francis (2011) found that across experienced observers listening to recordings,64 CALIFORNIA FISH AND WILDLIFE Vol. 107, No. 2
bird species reported by observers but not present on recordings accounted for a mean of
14% of reported species records. Farmer et al. (2012) also examined performance of humans
listening to recordings for bird species designated as common or rare and observers with
skills ranked from moderate to expert. Across those categories, they reported false positive
rates ranging from 6% to 22%. These results demonstrate BirdNET’s promise for providing
efficient, automated, and accurate bird identification, reducing reliance on human observers
with variable identification abilities.
The few sounds that BirdNET misidentified were generally sounds that a human
observer would also have difficulty identifying, such as confusing non-avian sounds and
brief call notes that are very similar among species. Examining BirdNET results can reveal
certain species that are more likely to be false positives. For example, BirdNET appeared to
misidentify rustling vegetation as calls of hooded oriole (Icterus cucullatus) on more than
one occasion. We recommend that researchers initially vet identifications from subsetted
data to establish study area-specific lists of problematic species that should be vetted (i.e.,
reviewed by a human observer to confirm or correct species identification), further limiting
the need to vet across all recordings and species.
It is important to note that we were unable to assess how our subsetting process af-
fected the proportion of false negatives (i.e., instances where our process failed to detect
species audible in the recordings). Our conservative approach, which produced a low rate of
misidentifications (false positives), likely also produced an elevated rate of missed species
(false negatives). However, based on the mean number of true positive species detected
per location (16.4), we are confident that our methods enabled BirdNET to produce both
low misidentification rates and rigorous samples of avian community composition match-
ing or exceeding those typically produced by more traditional methods. For example, the
mean number of confirmed species per location recorded by AudioMoths and identified
by BirdNET was higher than our mean number of species from point counts (12.8), which
were done in very similar habitats using the protocol of one of North America’s largest-scale
bird monitoring programs. In addition, the longer species lists from AudioMoths/BirdNET
often included species that traditional point count protocols have difficulty sampling, such
as nocturnal species (e.g., barn owl [Tyto alba] and great horned owl [Bubo virginianus]).
A growing body of research demonstrates that sound recording systems can match and
even outperform point counts in their ability to sample birds (Darras et al. 2018; Darras
et al. 2019; Wimmer et al. 2013), but to our knowledge this is the first published work to
document this comparison for the AudioMoth.
Our study also elucidated several approaches that will likely enhance the number
of true positive species detections produced by acoustic recorders and BirdNET. First,
we recorded for less than one hour after local sunrise, but recorders could be set to record
for more time, especially during the morning hours when avian acoustic activity peaks.
Second, logistical constraints prevented us from collecting recordings during the seasonal
peak of avian acoustic activity at our study area. Recording during the seasonal peaks of
acoustic activity for as many species as possible should increase the number of species that
are recorded and subsequently detected by BirdNET. Recording after this peak, as we did,
may also increase error in BirdNET by increasing detection of individuals likely to present
sound-based identification challenges, such as fledglings. On the other hand, researchers
should be cautious about recording early in the breeding season when migrating or un-
paired (nonbreeding) individuals are more likely to be present. Finally, we used a singleSpring 2021 NOVEL RECORDERS AND AUTOMATED BIRD IDENTIFICATION 65
conservative confidence threshold to subset detections across all species, eliminating the
majority of BirdNET’s detections, including all detections for several species in some of our
recordings. Approaches that use species-specific confidence thresholds may optimize the
balance between high true positive and low false negative identification rates. Kahl (2020)
provided optimal species-specific confidence thresholds in BirdNET, but we found that they
resulted in high numbers of false positive identifications from our recordings. BirdNET’s
utility for avian acoustic monitoring may benefit greatly from further exploration of optimal
species-specific confidence thresholds, especially if these thresholds are established for
specific geographic regions. Researchers may also consider establishing lower confidence
thresholds for species of special interest, which are often rare species that may be missed
by a single, conservative threshold.
The results of this study provide critical information to researchers and managers
considering the use of acoustic methods for surveying bird communities. By using a combi-
nation of long recordings from low-cost recorders and conservative subsetting of BirdNET’s
automated identifications, we have honed a process that shows great promise for sampling
avian community composition with low misidentification rates and limited need for human
vetting. Together, these tools may greatly improve efforts to survey bird communities and
their ecosystems, and consequently, efforts to conserve threatened indigenous biodiversity.
ACKNOWLEDGMENTS
This study was funded by the California Department of Fish and Wildlife. We thank
Dr. J. Hunter, Resident Reserve Director at Hastings Natural History Reservation, for her role
in facilitating fieldwork for this study. We also thank the following people for their time and
assistance in the use of BirdNET: J. Cole (The Institute for Bird Populations), Dr. S. Kahl
and Dr. H. Klinck (Center for Conservation Bioacoustics), and S. Peterson (University of
California, Berkeley). We thank M. Rodríguez (California Department of Fish and Wildlife)
and A. Blasco for providing a Spanish translation of this manuscript’s abstract. We thank the
two anonymous reviewers who provided thoughtful feedback on the manuscript. Finally, we
thank M. Boynton, N. Cornelius, Dr. B. Furnas, and E. Chappell (California Department of
Fish and Wildlife) for their assistance in facilitating this study and conducting fieldwork.
LITERATURE CITED
Arif, M., R. Hedley, and E. Bayne. 2020. Testing the accuracy of a birdNET, automatic bird
song classifier. University of Alberta, Alberta, Canada.
Bader, E., K. Jung, E. K. Kalso, R. A. Page, R. Rodriguez, and T. Sattler. 2015. Mobility
explains the response of aerial insectivorous bats to anthropogenic habitat change
in the Neotropics. Biological Conservation 186:97–106.
Blumstein, D. T., D. J. Mennill, P. Clemins, L. Girod, K. Yao, G. Patricelli, J. L. Deppe, A.
H. Krakauer, C. Clark, K. A. Cortopassi, and S. F. Hanser. 2011. Acoustic moni-
toring in terrestrial environments using microphone arrays: applications, techno-
logical considerations and prospectus. Journal of Applied Ecology 48:758–767.
Brandes, T. S. 2008. Automated sound recording and analysis techniques for bird surveys
and conservation. Bird Conservation International 18:S163–S173.
Brandt, A. J., and E. W. Seabloom. 2011. Regional and decadal patterns of native and exotic
plant coexistence in California grasslands. Ecological Applications 21:704–714.66 CALIFORNIA FISH AND WILDLIFE Vol. 107, No. 2
Campbell, M., and C. M. Francis. 2011. Using stereo-microphones to evaluate observ-
er variation in North American Breeding Bird Survey point counts. The Auk
128(2):303–312.
Campos-Cerqueira, M., and T. M. Aide. 2016. Improving distribution data of threatened
species by combining acoustic monitoring and occupancy modeling. Methods in
Ecology and Evolution 7:1340–1348.
Chambert, T., J. H. Waddle, D. A. Miller, S. C. Walls, and J. D. Nichols. 2018. A new
framework for analysing automated acoustic species detection data: Occupancy
estimation and optimization of recordings post‐processing. Methods in Ecology
and Evolution 9:560–570.
Darras, K., P. Batáry, B. Furnas, A. Celis‐Murillo, S. L. Van Wilgenburg, Y. A. Mulyani,
and T. Tscharntke. 2018. Comparing the sampling performance of sound record-
ers versus point counts in bird surveys: a meta‐analysis. Journal of Applied Ecol-
ogy 55:2575–2586.
Darras, K., P. Batáry, B. J. Furnas, I. Grass, Y. A. Mulyani, and T. Tscharntke. 2019. Au-
tonomous sound recording outperforms human observation for sampling birds: a
systematic map and user guide. Ecological Applications 29(6):e01954.
Farmer, R.G., M. L. Leonard, and A. G. Horn. 2012. Observer effects and avian-call-count
survey quality: rare-species biases and overconfidence. The Auk 129(1):76–86.
Furnas, B. J., and M. C. McGrann. 2018. Using occupancy modeling to monitor dates of
peak vocal activity for passerines in California. The Condor 120:188–200.
Gibb, R., E. Browning, P. Glover-Kapfer, and K. E. Jones. 2019. Emerging opportunities
and challenges for passive acoustics in ecological assessment and monitoring.
Methods in Ecology and Evolution 10:169–185.
Griffin, J.R. 1990. Flora of Hastings Reservation, Carmel Valley, California. University of
California, Berkeley, CA, USA.
Heinicke, S., A. K. Kalan, O. J. Wagner, R. Mundry, H. Lukashevich, and H. S. Kühl.
2015. Assessing the performance of a semi‐automated acoustic monitoring sys-
tem for primates. Methods in Ecology and Evolution 6:753–763.
Hill, A. P., P. Prince, J. L. Snaddon, C. P. Doncaster, and A. Rogers. 2019. AudioMoth: A
low-cost acoustic device for monitoring biodiversity and the environment. Hard-
wareX 6:e00073.
Kahl, S. 2020. Identifying birds by sound: large-scale acoustic event recognition for avian
activity monitoring. Dissertation, Chemnitz University of Technology, Chemnitz,
Germany.
Kalan, A. K., R. Mundry, O. J. Wagner, S. Heinicke, C. Boesch, and H. S. Kühl. 2015.
Towards the automated detection and occupancy estimation of primates using
passive acoustic monitoring. Ecological Indicators 54:217–226.
McLaren, M. F., C. M. White, N. J. Van Lanen, J. J. Birek, J. M. Berven, and D. J. Hanni.
2019. Integrated Monitoring in Bird Conservation Regions (IMBCR): field proto-
col for spatially-balanced sampling of land bird populations. Unpublished report.
Bird Conservancy of the Rockies, Brighton, CO, USA.
McMahon, D.E., I. S. Pearse, W. D. Koenig, and E. L. Walters. 2015. Tree community
shifts and Acorn Woodpecker population increases over three decades in a Cali-
fornian oak woodland. Canadian Journal of Forest Research 45:1113–1120.
Pavlacky Jr, D.C., P. M. Lukacs, J. A. Blakesley, R. C. Skorkowsky, D. S. Klute, B. A.Spring 2021 NOVEL RECORDERS AND AUTOMATED BIRD IDENTIFICATION 67
Hahn, V. J. Dreitz, T. L. George, and D. J. Hanni. 2017. A statistically rigorous
sampling design to integrate avian monitoring and management within Bird Con-
servation Regions. PloS ONE 12(10):e0185924.
Pérez‐Granados, C., G. Bota, D. Giralt, A. Barrero, J. Gómez‐Catasús, D. Bustillo‐De La
Rosa, and J. Traba. 2019. Vocal activity rate index: a useful method to infer ter-
restrial bird abundance with acoustic monitoring. Ibis 161:901–907.
Prince, P., A. Hill, E. Piña Covarrubias, P. Doncaster, J. L. Snaddon, and A. Rogers. 2019.
Deploying acoustic detection algorithms on low-cost, open-source acoustic sen-
sors for environmental monitoring. Sensors 19:553.
Rhinehart, T. A., L. M. Chronister, T. Devlin, and J. Kitzes. Acoustic localization of terres-
trial wildlife: current practices and future opportunities. Ecology and Evolution
10(13):6794–6818.
Sebastián-González, E., R. J. Camp, A. M. Tanimoto, P. M. de Oliveira, B. B. Lima, T. A.
Marques, and P. J. Hart. 2018. Density estimation of sound-producing terrestrial
animals using single automatic acoustic recorders and distance sampling. Avian
Conservation and Ecology 13:7.
Sethi, S. S., N. S. Jones, B. D. Fulcher, L. Picinali, D. J. Clink, H. Klinck, C. D. L. Orme,
P. H. Wrege, and R. M. Ewers. 2020. Characterizing soundscapes across diverse
ecosystems using a universal acoustic feature set. Proceedings of the National
Academy of Sciences 117:17049–17055.
Shonfield, J., and E. M. Bayne. 2017. Autonomous recording units in avian ecological
research: current use and future applications. Avian Conservation and Ecology
12:14.
Stevenson, B. C., D. L. Borchers, R. Altwegg, R. J. Swift, D. M. Gillespie, and G. J.
Measey. 2015. A general framework for animal density estimation from acoustic
detections across a fixed microphone array. Methods in Ecology and Evolution
6:38–48.
Stevenson, B. C., P. van Dam‐Bates, C. K. Young, and J. Measey. 2021. A spatial capture‐
recapture model to estimate call rate and population density from passive acoustic
surveys. Methods in Ecology and Evolution 12:432–442.
Stewart, L., D. Tozer, J. McManus, L. Berrigan, and K. Drake. Integrating wetland bird
point count data from humans and acoustic recorders. 2020. Avian Conservation
and Ecology 15:2.
Sugai, L.S.M., T. S. F. Silva, J. W. Ribeiro Jr, and D. Llusia. 2019. Terrestrial passive
acoustic monitoring: review and perspectives. BioScience 69(1):15–25.
Ribeiro, J. W., T. Siqueira, G. L. Brejão, and E. F. Zipkin. 2018. Effects of agriculture and
topography on tropical amphibian species and communities. Ecological Applica-
tions 28:1554–1564.
Walters, C. L., R. Freeman, A. Collen, C. Dietz, M. B. Fenton, G. Jones, M. K. Obrist, S.
J. Puechmaille, T. Sattler, B. M. Siemers, S. Parsons, and K. E. Jones. 2012. A
continental-scale tool for acoustic identification of European bats. Journal of Ap-
plied Ecology 49:1064–1074.
Wimmer, J., M. Towsey, P. Roe, and I. Williamson. 2013. Sampling environmental
acoustic recordings to determine bird species richness. Ecological Applications
23(6):1419–1428.
Wood, C. M., V. D. Popescu, H. Klinck, J. J. Keane, R. J. Guiterrez, S. C. Sawyer, and M.68 CALIFORNIA FISH AND WILDLIFE Vol. 107, No. 2
Z. Peery. 2019. Detecting small changes in populations at landscape scales: a bio-
acoustics site-occupancy framework. Ecological Indicators 98:492–507.
Wrege, P. H., E. D. Rowland, S. Keen, and Y. Shiu. 2017. Acoustic monitoring for conser-
vation in tropical forests: examples from forest elephants. Methods in Ecology
and Evolution 8:1292–1301.
Submitted 12 February 2021
Accepted 26 March 2021
Associate Editors were J. Olson and G. MyersSpring 2021 NOVEL RECORDERS AND AUTOMATED BIRD IDENTIFICATION 69
APPENDIX I: BIRD SPECIES CORRECTLY IDENTIFIED BY BIRDNET
Common and scientific names of species correctly identified (verified by a human
observer) by the artificial neural network BirdNET following the authors’ subsetting process.
Also included is the number of recordings in which each species was detected and confirmed
by the observer (out of a total of 50 recordings).
Common name Scientific name Number of recordings
acorn woodpecker Melanerpes formicivorus 12
American crow Corvus brachyrhynchos 5
American kestrel Falco sparverius 1
American robin Turdus migratorius 2
ash-throated flycatcher Myiarchus cinerascens 15
band-tailed pigeon Patagioenas fasciata 5
barn owl Tyto alba 10
Bewick’s wren Thryomanes bewickii 10
black-headed grosbeak Pheucticus melanocephalus 10
black phoebe Sayornis nigricans 10
blue-gray gnatcatcher Polioptila caerulea 16
brown creeper Certhia americana 5
Bullock’s oriole Icterus bullockii 1
bushtit Psaltriparus minimus 20
California scrub-jay Aphelocoma californica 24
California thrasher Toxostoma redivivum 4
California towhee Melozone crissalis 24
Cooper’s hawk Accipiter cooperii 1
dark-eyed junco Junco hyemalis 15
great horned owl Bubo virginianus 10
hairy woodpecker Dryobates villosus 6
house finch Haemorhous mexicanus 3
Hutton’s vireo Vireo huttoni 6
lark sparrow Chondestes grammacus 1
Lawrence’s goldfinch Spinus lawrencei 3
lesser goldfinch Spinus psaltria 11
mourning dove Zenaida macroura 9
northern flicker Colaptes auratus 4
Nuttall’s woodpecker Dryobates nuttallii 7
oak titmouse Baeolophus inornatus 21
orange-crowned warbler Leiothlypis celata 1
Pacific-slope flycatcher Empidonax difficilis 25
purple finch Haemorhous purpureus 970 CALIFORNIA FISH AND WILDLIFE Vol. 107, No. 2
APPENDIX I continued
Common name Scientific name Number of recordings
red-shouldered hawk Buteo lineatus 3
red-tailed hawk Buteo jamaicensis 6
spotted towhee Pipilo maculatus 23
Steller’s jay Cyanocitta stelleri 23
violet-green swallow Tachycineta thalassina 18
warbling vireo Vireo gilvus 4
western bluebird Sialia Mexicana 5
white-breasted nuthatch Sitta carolinensis 13
wrentit Chamaea fasciata 24
APPENDIX II: BIRD SPECIES MISIDENTIFIED BY BIRDNET
Common and scientific names of species apparently misidentified by the artificial
neural network BirdNET following the authors’ subsetting process. Also included are the
number of recordings in which BirdNET was known to have misidentified the species, as
well as the apparent true source of the misidentified sound. Six of these species (in bold)
were not confirmed to be present in any of the recordings at the study area.
Apparent true sound N u m b e r o f
Common name Scientific name
source recordings
acorn woodpecker Melanerpes formicivorus Unknown 1
American avocet Recurvirostra americana Female wrentit 1
American coot Fulica americana Unknown 1
band-tailed pigeon Patagioenas fasciata great horned owl 1
band-tailed pigeon Patagioenas fasciata Unknown 1
belted kingfisher Megaceryle alcyon Unknown 1
Bewick’s wren Thryomanes bewickii blue-gray gnatcatcher 1
black phoebe Sayornis nigricans Unknown 1
Bullock’s oriole Icterus bullockii California thrasher call 1
downy woodpecker Dryobates pubescens Unknown 1
hooded oriole Icterus cucullatus Rustling vegetation 2
Lawrence’s goldfinch Spinus lawrencei California towhee call 1
lesser goldfinch Spinus psaltria Unknown 1
Savannah sparrow Passerculus sandwichensis Unknown bird call 1
white-breasted nuthatch Sitta carolinensis acorn woodpecker 1California Fish and Wildlife 107(2):71-76, 2021 www.doi.org/10.51492/cfwj.107.6
RESEARCH NOTE
Field Trial Comparing Two Materials for Marine Oil Sheen
Sampling
BRUCE M. JOAB1*, JAMES MCCALL1, MICHAEL J. ANDERSON1,
AND MICHAEL AMMANN2
1
California Department of Fish and Wildlife, Office of Spill Prevention and Response, 1010
Riverside Parkway, West Sacramento, CA 95605, USA
2
Chevron Corporation (retired), Chevron Petroleum Technology, 6001 Bollinger Canyon
Rd, San Ramon, CA 94583, USA
*Corresponding Author: bruce.joab@wildlife.ca.gov
The California Department of Fish and Wildlife (CDFW) uses fiberglass mate-
rial for forensic analysis of oil sheens, while the United States Coast Guard (USCG)
method uses a tetrafluoroetheylene-fluorocarbon (TFE-fluorocarbon) polymer net.
We performed a field trial of these two materials by sampling natural oil seeps, two
in Santa Monica Bay, and three sheen areas in the Santa Barbara Channel. Though
the fiberglass material did collect less mass on some trials, the forensic chemistry
results demonstrated that both materials were satisfactory for purposes of chemical
forensic analysis as each pair of the sampling materials yielded results that were
consistent with a common oil seep source.
Key words: fiberglass, fingerprint, oil, sheen, TFE-fluorocarbon polymer
_________________________________________________________________________
The current United States Coast Guard (USCG) method for the collection of petroleum
sheens from a water surface utilizes a tetrafluoroetheylene-fluorocarbon (TFE-fluorocarbon
polymer), also known as Teflon®, net (Greimann et al. 1995; Plourde et al. 1995). The TFE-
fluorocarbon polymer net approach was published in 1995 by USCG staff who sought to
improve upon the American Society for Testing and Materials (ASTM) standard practice
for Sampling Waterborne Oils (ASTM method D4489) that uses the decanting method
and the TFE-fluorocarbon polymer strip adsorption techniques. Their research determined
that the TFE-fluorocarbon polymer net captured a greater mass of sheen material than the
TFE-fluorocarbon strips. A greater mass of sheen helps improve analyte detection and the
resolving power of the subsequent chemical analysis to fingerprint the source of petroleum
hydrocarbons collected. They also compared nylon net to TFE-fluorocarbon polymer net and
found that the TFE-fluorocarbon polymer net performed better by a factor of three in captur-
ing sheen (Plourde et al. 1995; Greimann et al. 1995). At that time, the TFE-fluorocarbon
polymer net cost $25; the current market price is $54.
The California Department of Fish and Wildlife (CDFW) Office of Spill Prevention
and Response (OSPR) has, since the early 1990s, used a different but still non-reactive72 CALIFORNIA FISH AND WILDLIFE Vol. 107, No. 2
material to collect petroleum sheen samples from water. The kits supplied to CDFW law
enforcement and field staff contain 3”x12” strips of fiberglass, with four strips per jar. The
total material cost of these four strips of fiberglass is approximately $2.18, including the
solvent rinse that is done on them in the laboratory prior to use. In the field, the strips are put
into contact with the sheen to have it adsorb to the fiberglass material, and then the strips are
packed into a certified pre-cleaned glass jar with a TFE-fluorocarbon-lined lid for shipment
to the lab where they are analyzed.
In 2012 and 2015, CDFW-OSPR had opportunities to collect environmental samples
near the Chevron El Segundo Refinery in a collaborative effort with Chevron staff. The
Chevron refinery is located on the Santa Monica Bay in El Segundo, California. There are
at least three known natural oil seeps in Santa Monica Bay that our team had interest in
sampling for the purposes of a forensic fingerprint analysis, with two of these seeps be-
ing known to frequently emit oil. Seeps in Santa Monica Bay have been reported to emit
an estimated 100 to 1000 tons (90,718 to 907,185 kg) of oil per year (Kvenvolden and
Cooper 2003). In 2015, we added three additional sampling sites at known oil seeps near
Santa Barbara California, to allow a more robust comparison of these two sheen sampling
materials. Natural oil seeps are common in the Santa Barbara area (Hornafius et al. 1999;
Kvenvolden and Cooper 2003; Lorenson et al. 2009). Our goal was to evaluate whether,
under field test conditions, the material used to collect the oil sheen affected the results of
the forensic analysis.
We obtained fiberglass materials from CDFW-OSPR (fiberglass strips and jar) supplies
and purchased TFE-fluorocarbon polymer nets. On 24 April 2012 and 28 January 2015, we
set out onto Santa Monica Bay aboard a Chevron owned vessel, and proceeded to Seep 1
where we encountered an oily sheen, and then to Seep 2 where we found another oily sheen
(see Table 1 for location coordinates). At each of these seeps, the TFE-fluorocarbon polymer
net was attached to a metal clip on the end of a wooden dowel rod approximately 1.2 m (4
ft) in length and swept through the sheen five times. Then the TFE-fluorocarbon polymer
net, now containing the oil sheen, was removed from the hoop and packed into a glass jar
with a TFE-fluorocarbon-lined lid. Similarly, the four fiberglass strips were attached to the
wooden rod in a similar manner and swept through the sheen five times, then removed from
the clip and packed into a glass jar with a TFE-fluorocarbon-lined lid. The sampling was
performed using both a TFE net and the fiberglass strips at the same location to maximize
the probability that the same area of sheen was being sampled with each material. The
sheens observed and sampled were a mixture of rainbow-colored sheen and silvery sheen,
indicating a variety of oil thicknesses present on the water surface. On 30 January 2015,
we sampled the Santa Barbara seeps in the same manner as the Santa Monica Bay locations
while onboard a CDFW patrol vessel. The Santa Barbara area locations are known as the
Platform A, Coal Oil Point, and Summerland seeps. The sample types and locations are
presented and described in Table 1.
We transported the Santa Monica and Santa Barbara sheen samples to the CDFW-
OSPR laboratory in Rancho Cordova, CA, for forensic analyses. All location names were
removed from the sampling documentation that was delivered to the laboratory with the
samples, obscuring the location-specific pairings of the fiberglass and TFE net samples to
laboratory staff.
Forensic analysis was performed using methods described in ASTM D5739, Standard
Practice for Oil Spill Source Identification by Gas Chromatography and Positive Ion Electron
Impact Low Resolution Mass Spectrometry (ASTM, 2006). Samples were extracted andYou can also read