Californias Advanced Clean Cars Midterm Review Appendix C: Zero Emission Vehicle and Plug-in Hybrid Electric Vehicle Technology Assessment
←
→
Page content transcription
If your browser does not render page correctly, please read the page content below
Californias
     Advanced Clean Cars
       Midterm Review

          Appendix C:
Zero Emission Vehicle and Plug-in
Hybrid Electric Vehicle Technology
           Assessment

           January 18, 2017
TABLE OF CONTENTS
I. Introduction and Vehicle Summary.......................................................................................... 1
   I. A. Past and Current Zero Emission Vehicle Models............................................................. 2
      I.A.1. Future Vehicles .......................................................................................................... 3
II. PEV Technology Status and Progress ................................................................................... 5
   II. A. Industry Targets for PEVs .............................................................................................. 5
   II. B. PEV Technology Trends ................................................................................................ 7
      II.B.1. 2016 Technical Assessment Report PEV Findings ................................................... 7
      II.B.2. Battery Pack Energy Capacity Increases .................................................................. 9
      II.B.3. Vehicle All Electric Range Increases........................................................................11
      II.B.4. Increased Platform and AWD Capability ..................................................................12
      II.B.5. Current State of PEV Specific Technology ...............................................................16
      II.B.6. Energy Storage Technology- Batteries ....................................................................20
      II.B.7. Expected Developments in Energy Storage Technology..........................................29
      II.B.8. Potential Long-Term Developments in Energy Storage Technology ........................32
      II.B.9. Well-to-Wheel (WTW) and Cradle-to-Grave (C2G) Emissions .................................37
      II.B.10. Battery Recycling and Reuse .................................................................................39
      II.B.11. Non-Battery Components ......................................................................................40
      II.B.12. Non-Battery Components Expected Developments ...............................................47
      II.B.13. Other Expected Developments ..............................................................................52
      II.B.14. Potential Long-Term Developments in Non-Battery Components ..........................55
      II.B.15. Potential Long-Term Developments in Charging Technology.................................55
      II.B.16. Connected and Autonomous Vehicles (CAV) and Car Sharing ..............................56
   II. C. PEV Costs ....................................................................................................................58
      II.C.1. Battery Costs ...........................................................................................................58
      II.C.2. Non-Battery Costs ...................................................................................................62
      II.C.3. Rolled Up PEV Costs...............................................................................................63
III. FCEV Technology Status and Trends ..................................................................................63
   III. A. Available FCEV Models: ...............................................................................................64
   III. B. FCEV’s Anticipated Role in Transport Sector: ..............................................................67
   III. C. FCEV Basic Technology Components: ........................................................................67
   III. D. FCEV Technology Trends: ...........................................................................................68
   III. E. FCEV Cost Trends: ......................................................................................................73
IV. References ..........................................................................................................................77

                                                                 C - ii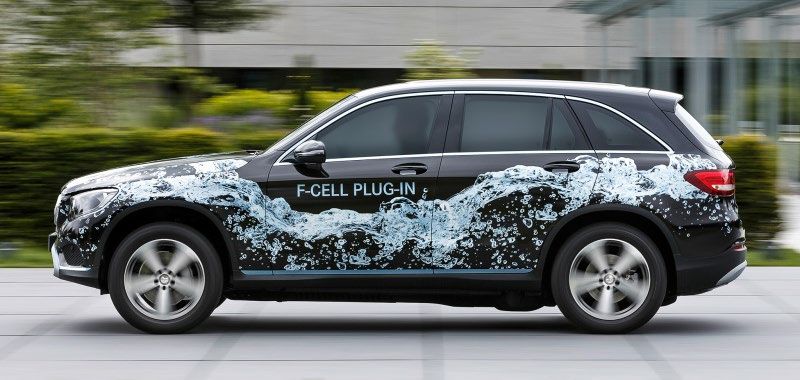
LIST OF FIGURES
Figure 1 - Aggregate TZEV and ZEV Models by Model Year ..................................................... 3
Figure 2 - BEV Battery Pack Growth by Model Year .................................................................10
Figure 3 - PHEV Battery Pack Growth by Model Year ...............................................................11
Figure 4 - U.S. DOE Chart Comparing PEVs and Conventional Vehicle Ranges for 2016 Model
Year ..........................................................................................................................................12
Figure 5 - 2018 to 2021MY Unique ZEVs by Size, Type, and Range ........................................15
Figure 6 - Electric Motor Positions in HEVs ...............................................................................17
Figure 7 - Chevrolet Volt (Gen 2) Electric Powertrain ................................................................17
Figure 8 - Chevrolet Bolt EV Electric Powertrain .......................................................................17
Figure 9 - Tesla Model S Rear Drive Unit Assembly .................................................................18
Figure 10 - Volvo XC90 T8 Powertrain Cutaway .......................................................................19
Figure 11 - Cylindrical lithium-ion battery ..................................................................................21
Figure 12 - Cross Section of a Prismatic Cell ............................................................................22
Figure 13 - AESC Battery Module for Nissan Leaf with 24kWh Battery Pack ............................23
Figure 14 - SK Innovation Battery Cell Used in Kia Soul EV .....................................................23
Figure 15 - Idealized Lithium Ion Battery ...................................................................................24
Figure 16 - Comparison of Idealized Conventional Battery to Idealized Solid State Battery.......33
Figure 17 - Well to Wheel Greenhouse Gas Emissions for 2035 Mid-Size Car, gCO2-equivalent
per mile (U.S. DOE) ..................................................................................................................39
Figure 18 - Price History for Neodymium and Dysprosium Rare Earth Materials .......................43
Figure 19 - Toyota Production PCU (left) and SiC Prototype PCU (right) ..................................52
Figure 20 - Estimated ranges of operational energy impacts of vehicle automation through
different mechanisms ................................................................................................................57
Figure 21 - Range of projected battery pack cost reductions, $/kWh (2014)..............................60
Figure 22 - BEV200 Battery Pack Costs, 2013 ..........................................................................61
Figure 23 - PHEV40 Battery Pack Costs, 2013 .........................................................................62
Figure 24 - FCEV Models Available in California now –Toyota, Hyundai, Honda ......................65
Figure 25 - General Motors Demonstration Military All-wheel Drive Four-door Pickup Truck .....65
Figure 26 - Schematic of Components Included in a Fuel Cell System .....................................68
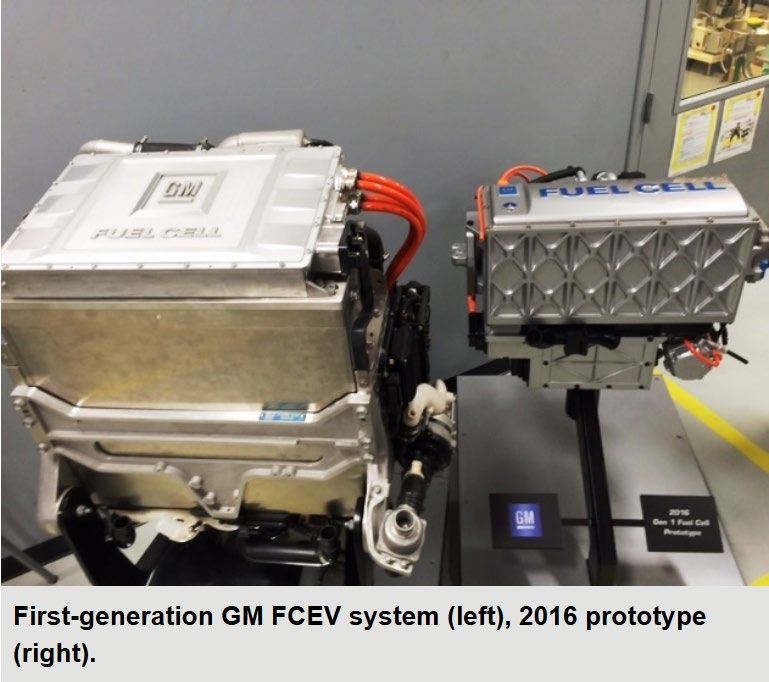
Figure 27 - General Motors FCEV System Size Improvements Depicted Over a Ten-Year Period
.................................................................................................................................................69
Figure 28 - Conceptual Image of Conformable Tubes for Compressed Hydrogen Gas On-board
Storage .....................................................................................................................................71
Figure 29 - 2015 Status of Hydrogen Storage Technologies (Does not represent eventual
potential) ...................................................................................................................................72
Figure 30 - Preproduction Image of Model Year 2018 Mercedes GLC FCPEV .........................73
Figure 31 - Percent Split between Fuel Cell System Components for Low and
High Volume Production Levels ................................................................................................74
Figure 32 - History of U.S. DOE Fuel Cell Cost Projections for 500,000 Production Units per
Year ..........................................................................................................................................75
Figure 33 - Fuel Cell System Cost Projections by Year of Projection and Production Units per
Year ..........................................................................................................................................76
C - iii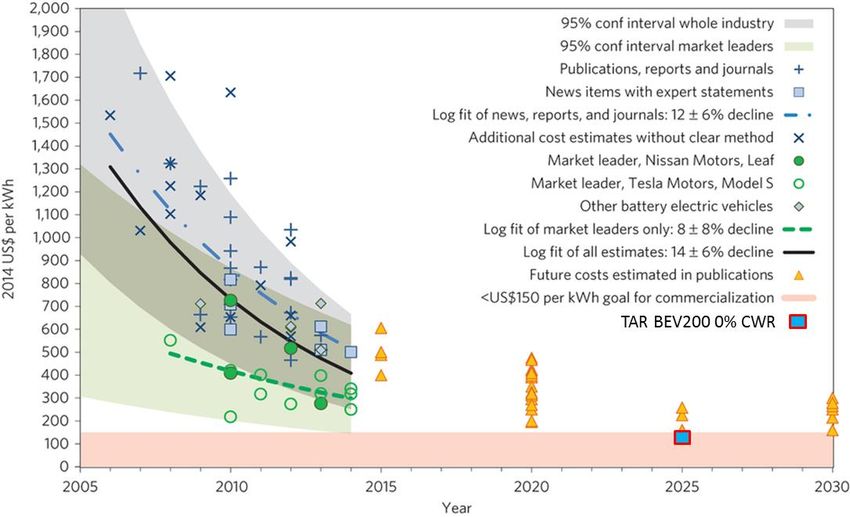
LIST OF TABLES

Table 1 - U.S. DOE EV Everywhere Grand Challenge 2022 Targets ......................................... 6
Table 2 - U.S. DRIVE 2015 and 2020 Targets for Electrified Components, ................................ 7
Table 3 - Battery Thermal Management Systems of Available MY16 and Available/Announced
MY17 Models, ...........................................................................................................................28
Table 4 - Electric Machine Type for MY16 and Known Expected MY17 ZEVs and TZEVs, .......42
Table 5 - INL OBC Testing Results of Several Vehicles ............................................................47
Table 6- SAE TIR J2954 and Future Potential Power Levels ....................................................54
Table 7 - Incremental battery pack (and system) costs used in 2012 ACC rulemaking (2009) ..59
Table 8 - Incremental Vehicle Costs (2025 ZEV compared to 2016 ICE vehicle, 2013).............63
Table 9 - Technology Status and U.S. DOE Targets for Automotive Fuel Cell and Onboard
Hydrogen Storage Systems ......................................................................................................64
Table 10 - Past, Current and Future FCEV Models Available in California ................................66
Table 11 - Summary of Hydrogen Storage Targets for Performance and Cost with Status of
Various Technologies................................................................................................................76

                                                                 C - iv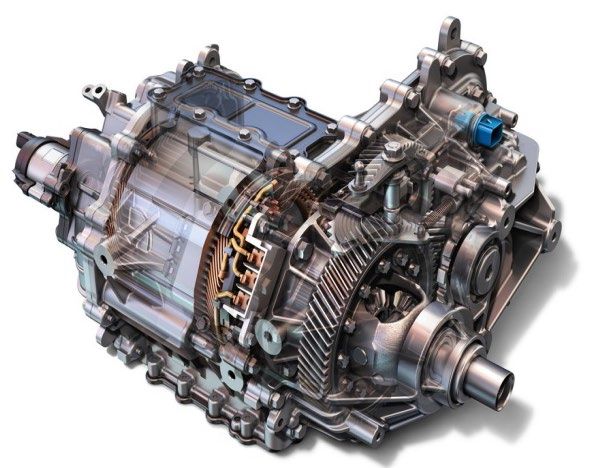
I. Introduction and Vehicle Summary
When developing the Advanced Clean Cars (ACC) rulemaking in 2011 for 2018 and subsequent
model years, Air Resources Board (ARB or the Board) staff had limited knowledge of how the
market would develop. Details of future vehicles including upcoming Ford and BMW products
were slim and based mostly from press releases at the time. Since the adoption of the ACC
regulations, zero emission vehicle (ZEV, which includes battery electric vehicles, or BEV, and
fuel cell electric vehicles, or FCEV) and plug-in hybrid electric vehicle (PHEV) technology has
progressed quickly. This has led to introductions (and announcements) of vehicles with longer
ranges and more efficient and capable drivetrains far earlier than expected.

The 2010 Joint Agency Draft Technical Assessment Report (2010 TAR) projected ZEV
technology and costs, using the Argonne National Labs (ANL) Battery Pack and Costing tool
(BaTPaC), and were considered at the time to be aggressive assumptions, even for the 2025
model year.1 However, indications from other sources and updated work from the 2016 Joint
Agency Draft Technical Assessment Report (2016 TAR) 2 shows that those 2010 projections
were somewhat conservative. With batteries being a large share of the cost of PHEVs and
BEVs, those cost reductions are enabling longer range and more capable versions of those
vehicles, earlier than was originally projected. Updated information on FCEV costs was also
included in the 2016 TAR; however, FCEVs were not included in the greenhouse gas fleet
modeling due to limited sales and higher incremental costs in that timeframe.

Despite impressive cost reductions in batteries, ZEVs and PHEVs are projected to have
significant cost premiums relative to future conventional internal combustion engine (ICE)
technology. The 2016 TAR projects an incremental cost of $6,500 to $14,200 for PHEV40 3 and
BEV200s 4 over an equivalent ICE vehicle in the 2025 model year. While these incremental
costs compare similarly to those projected by the 2010 TAR, they represent updated ZEV
technology packages. Given market offerings and battery cost reductions, the PHEV20 5 and
BEV150 6 packages modeled in the 2010 TAR were updated to PHEV40 and BEV200 packages
for the 2016 TAR resulting in an increase in battery content (and associated cost even with the
reduced battery prices). For the non-battery components of the PHEV and BEV packages, the
costs in the 2016 TAR are largely identical to what was assumed in the 2010 TAR and originally
derived from a teardown study of a 2010 Ford Fusion Hybrid conducted by FEV Group (FEV)
under contract with the United States Environmental Protection Agency (U.S. EPA). To update

1 EPA 2010. U.S. Environmental Protection Agency, U.S. National Highway Traffic Safety Administration, California
Air Resources Board. “Interim Joint Technical Assessment report: Light-Duty Vehicle Greenhouse Gas Emission
Standards and Corporate Average Fuel Economy Standards for Model Years 2017-2025.” September 2010.
https://www.epa.gov/sites/production/files/2016-10/documents/ldv-ghg-tar.pdf
2 EPA, 2016. U.S. Environmental Protection Agency, U.S. National Highway Traffic Safety Administration, California

Air Resources Board, "Draft Technical Assessment Report: Midterm Evaluation of Light-Duty Vehicle Greenhouse
Gas Emission Standards and Corporate Average Fuel Economy Standards for Model Years 2022-2025," July, 2016.
https://www3.epa.gov/otaq/climate/documents/mte/420d16900.pdf
3 PHEV40 means a 40 mile all electric range (label) PHEV (non-blended)
4 BEV200 means a 200 mile all electric range (label) BEV
5 PHEV20 means a 20 mile all electric range (label) PHEV (blended)
6 BEV150 means a 150 mile all electric range (label) BEV

                                                      C-1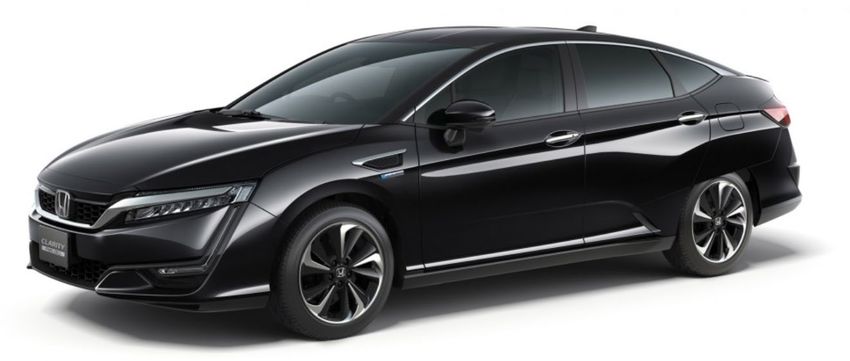
these component costs to be reflective of technology improvements since 2010, ARB has a
teardown contract currently underway on recently introduced PHEVs and BEVs.

This appendix provides an assessment of the progress of BEV, PHEV, and FCEV technology
since the 2012 adoption of the ACC regulations. Section II presents staff’s assessment of plug-
in electric vehicle (PEV) technologies, which includes BEVs and PHEVs, and components
related to these vehicles. Section III includes staff’s assessment of FCEV technology.

I. A. Past and Current Zero Emission Vehicle Models
The ZEV market has seen a significant increase in available models since the Nissan Leaf and
Chevrolet Volt 2010 market introductions. Currently, the market has increased from one 7 to 25
unique vehicle offerings as of January 2017. Table 1 in Appendix B shows the past and
currently available ZEVs and PHEVs.

BEV technology has progressed quickly since the market introduction of the Nissan Leaf in
2010. The Leaf has increased in range by 45% since its first model year. The Tesla Model S
has received several increases in range and the addition of a second motor for an all-wheel
drive (AWD) version since its market introduction in 2012. The most recent iteration of the
Model S is rated at 315 miles of label range8. Tesla's Model X came to market at the end of
2015 with AWD, seating for seven passengers, and towing capability. BMW i3 now has an
option for a bigger battery pack with even more range. General Motors released its Chevrolet
Bolt EV [electric vehicle] on the market at the end of 2016, with 238 miles label range. Several
other manufacturers have announced longer range mass market BEVs, with notable examples
including the next generation Nissan Leaf, the Tesla Model 3, and a small Ford sport utility
vehicle (SUV).

PHEV technology also continues to evolve as manufacturers introduce different architectures
and all electric capabilities as they respond to feedback from consumers indicating they want
more electric range from the technology. 9 General Motors’ second generation Chevrolet Volt
was released in late 2015 with 53 miles EPA label all electric range (AER) 10; an improvement of
15 miles of range over the previous generation. The Volt represents best-in-class technology in
terms of range for a PHEV and has been well received by many automotive critics. 11 Vehicle
manufacturers have also started to implement PHEV technology on platforms beyond the small
and mid-size passenger car segments. Chrysler plans to offer the Pacifica 8-passenger mini-

7 One model from a manufacturer subject to the ZEV regulation in 2010
8 DOE, 2016 U.S. Department of Energy. "Tesla Model S P100D Fuel Economy Online Label”
http://www.fueleconomy.gov/feg/Find.do?action=sbs&id=38172
9 See Appendix B, Section VII for a description of the CVRP Ownership Survey results
10 EPA label range represents the approximate number of miles that can be travelled in combined city and highway

driving, and is based on the UDDS cycle plus several others that represent higher speeds and accelerations as well
as colder and hotter weather conditions. To determine PEV range, the vehicle completes a 2-cycle (UDDS) and
multiplies the value by 0.7. Values in this document will be EPA label range, unless otherwise noted.
11 Voelcker, 2016a. J. Voelcker. "Green Car Reports," 16 January 2016.

http://www.greencarreports.com/news/1101422_chevrolet-volt-green-car-reports-best-car-to-buy-2016.

                                                       C-2
van with a 16kWh battery pack by the end of this year. 12 Volvo currently offers its XC90 7-
passenger SUV with an AWD drivetrain and 13 miles label equivalent AER (EAER). 13 Several
other manufacturers have also announced plans to offer PHEV options in many of their current
and future models.

At the time of the ACC rulemaking in 2012, there were no light-duty mass-produced fuel cell
vehicles available on the market. That has changed with introduction of the Hyundai Tucson
Fuel Cell in 2015 model year. It was subsequently followed by the releases of the Toyota Mirai
and Honda Clarity Fuel Cell. 14 As noted in Appendix D, more than 25 retail hydrogen fueling
stations are now open and increases in FCEV deployment are expected over the next several
years.

 I.A.1. Future Vehicles
Figure 1 below shows the aggregate number of expected ZEV and PHEV models through the
2021 model year, based on information provided by the manufacturers to ARB as well as public
announcements. The figure shows significant growth from 24 vehicle offerings in model year
2016 to approximately 80 vehicle offerings expected by 2021.

Figure 1 - Aggregate TZEV and ZEV Models by Model Year

                             90
     # of Models Available

                             80
                             70
                             60
                             50
                             40                                                                 ZEV
                             30                                                                 TZEV
                             20
                             10
                              0
                                  2011 2012 2013 2014 2015 2016 2017 2018 2019 2020 2021
                                                         Model Year

Additional expansion of vehicle model offerings is also expected after 2021, but less certainty is
known as manufacturers have not yet solidified plans for those years. However, several
manufacturers have announced longer term, broad reaching electrification plans that will affect
model years 2022 to 2025, and beyond. Audi, at the 2015 Los Angeles International Auto Show,

12 FCA, 2016. Fiat Chrysler, "All-new 2017 Chrysler Pacifica Maintains Segment Leadership for FCA US with
Upgraded Gas-Powered Model and First Hybrid Minivan,"
http://media.fcanorthamerica.com/newsrelease.do?id=17218&mid=722. [Accessed 22 August 2016].
13 DOE, 2016a. U.S. Department of Energy. "Volvo XC90 T8 Fuel Economy Online Label”

http://www.fueleconomy.gov/feg/PowerSearch.do?action=noform&path=1&year1=2016&year2=2017&make=Volvo&
model=XC90%20AWD%20PHEV&srchtyp=ymm.
14 Honda, 2016a. American Honda Motor Company, “2017 Honda Clarity Fuel Cell”

http://automobiles.honda.com/clarity [Accessed 28 October 2016]

                                                            C-3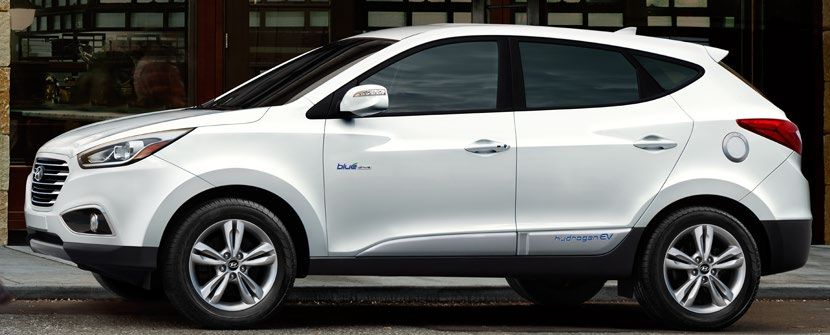
announced that it is committed to achieving 25% of U.S. sales from electric vehicles by 2025. 15
Audi will likely need to develop several more electrified models across its product line to reach
such sales goals. In December of 2015, Ford announced that it would be investing $4.5 billion
into electrified vehicle solutions. 16 Part of that plan involves adding 13 new electrified vehicle
nameplates by 2020, which amounts to more than 40% of the company’s global nameplates.
Volvo also announced that it has a target to sell one million electrified cars by 2025 which will
utilize Volvo’s two new modular architectures. 17 While Volvo’s specific model plans have not
been announced, its 2025 target will likely require many more electrified models than what is
available today.

Similar announcements have also come from Daimler, Honda, VW, and the Hyundai Motor
Group. In June of 2016, Daimler announced that it would be investing seven billion euros in
‘green’ technology over the following two years. 18 Daimler subsequently announced the creation
of an all new Mercedes-Benz sub-brand “EQ”, which will be dedicated to bringing all-electric
vehicles to market. 19 Honda’s CEO announced in February of 2016 that the company will strive
to have two-thirds of the overall sales come from electrified vehicles by 2030. 20 VW announced
a new group strategy name “TOGETHER – Strategy 2025” that includes a major electrification
initiative with more than 30 new electric vehicles (including Audi) by 2025 and annual sales
between two and three million units. 21 The Hyundai Motor Group in April of 2016 announced a
new electrification plan that includes 26 new models by 2020. In reference to the
announcement, the senior vice president of Hyundai Motor Group’s Eco Technology Center said
“This is the basement that we will build upon.” 22

15 Audi, 2015. Audi of America, “Audi declares at least 25% of U.S. sales will come from electric vehicles by 2025,”
18 November 2015. https://www.audiusa.com/newsroom/news/press-releases/2015/11/audi-at-least-25-percent-u-s-
sales-to-come-from-electric-2025. [Accessed 8 November 2016]
16 Ford, 2015. Ford Motor Company, “Ford investing $4.5 billion in electrified vehicle solutions, reimagining how to

create future vehicle user experiences,” 10 December 2015.
https://media.ford.com/content/fordmedia/fna/us/en/news/2015/12/10/ford-investing-4-5-billion-in-electrified-vehicle-
solutions.html [ Accessed 8 November 2016]
17 Volvo, 2016a. Volvo Car Corporation, “Volvo Cars announces new target of 1 million electrified cars sold by 2025,”

https://www.media.volvocars.com/global/en-gb/media/pressreleases/189874/volvo-cars-announces-new-target-of-1-
million-electrified-cars-sold-by-2025. [Accessed 8 November 2016]
18 Daimler, 2016a. Daimler AG, “Daimler invests massively in green powertrain technologies: All Mercedes-Benz

model series will be electrified,” 13 June 2016. http://media.daimler.com/marsMediaSite/ko/en/11108480. [Accessed
8 November 2016]
19 Daimler, 2016b Daimler AG, “Next step in electric offensive: Mercedes-Benz to build first electric car of the new EQ

product brand in its Bremen plant,” 27 October 2016. http://media.daimler.com/marsMediaSite/ko/en/14353750.
[Accessed 8 November 2016]
20 Honda, 2016b. Honda Motor Co., Ltd. “Summary of Honda CEO Speech on February 24, 2016,“ 24 February 2016.

http://world.honda.com/news/2016/c160224aeng.html
21 VW, 2016. The Volkswagen Group, “New Group strategy adopted: Volkswagen Group to become a world-leading

provider of sustainable mobility,” 6 June 2016.
http://www.volkswagenag.com/content/vwcorp/info_center/en/news/2016/06/2025.html [ Accessed 8 November 2016]
22 Greimel, 2016. Hans Greimel, Automotive News, “Hyundai-Kia's grand electrification plan,” 4 April 2016.

http://www.autonews.com/article/20160404/OEM05/304049949/hyundai-kias-grand-electrification-plan. [Accessed 8
November 2016]

                                                        C-4
II. PEV Technology Status and Progress
There have been several advancements in PEV technology that were not originally projected by
staff for the 2012 ACC rulemaking (and development of the Federal GHG standards). The 2010
TAR modeled the longest range BEV with up to 150 miles of range (on the EPA fuel economy
label) because, at the time, BEVs with 200 miles or more of range were expected to be too
expensive relative to a conventional vehicle to be feasible. Additionally, staff assumed in its
2011 ZEV regulation compliance scenario that all BEVs produced in compliance (from 2018
through 2025 model year) would have a 100 mile test cycle range 23 (approximately 70 mile
‘label range’), all PHEVs would have 22-40 miles of test cycle range (~14-30 mile label range),
and all FCEVs would have at least 350 miles of test cycle range (maxing out the number of
credits that could be earned within the program). 24 Since then, multiple manufacturers have
announced 200 mile (or more) label range BEVs and multiple PHEVs at various ranges, likely
due to decreased batteries costs and increased vehicle efficiency, further discussed in this
section.

II. A. Industry Targets for PEVs
The U.S. Department of Energy (U.S. DOE) and U.S. Driving Research and Innovation for
Vehicle efficiency and Energy sustainability (U.S. DRIVE) have both set goals for key PHEV,
BEV, and FCEV components which they see as critical milestones to advance the ZEV market.

In order to identify and address some of the challenges faced by the future ZEV market, the
U.S. DOE created the Electric Vehicle (EV) Everywhere Grand Challenge, announced by
President Obama in 2012. The effort identified several key areas that “can enable the purchase
cost combined with the operating cost of an all-electric vehicle with a 280-mile range to be
comparable to that of an internal combustion engine vehicle of similar size after five years of
ownership”. 25 To reach that goal, several targets were established as shown in Table 1. 26

23 Test cycle range means all electric range on the urban dynamometer drive schedule (UDDS).
24 ARB, 2011a. California Air Resources Board. Initial Statement of Reasons: 2012 Proposed Amendments To The
California Zero-Emission Vehicle Program Regulations. December 7, 2011.
http://www.arb.ca.gov/regact/2012/zev2012/zevisor.pdf
25 DOE, 2012a. U.S. Department of Energy, "About EV Everywhere," http://energy.gov/eere/eveverywhere/about-ev-

everywhere.
26 DOE, 2013a. U.S. Department of Energy, "EV Everywhere Grand Challenge Blueprint," U.S. Department of

Energy, January 13, 2013. https://energy.gov/eere/vehicles/downloads/ev-everywhere-grand-challenge-blueprint

                                                    C-5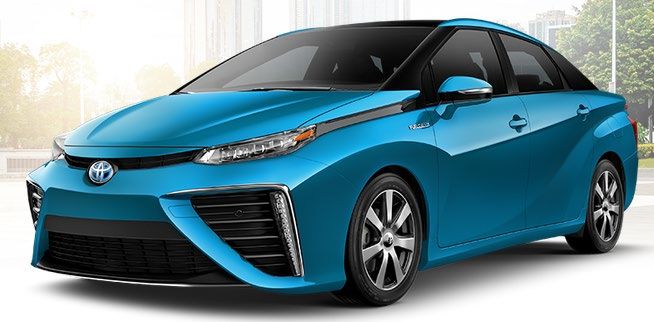
Table 1 - U.S. DOE EV Everywhere Grand Challenge 2022 Targets
                                                                           Electric Drive
                                                           Battery
                                                                              System

                                               Cost       $125/kWh              $8/kW

                      Energy           Volumetric         400 Wh/L                 -
                      Density         Gravimetric         250 Wh/kg                -

                      Power            Volumetric              -               4 kW/L
                      Density         Gravimetric          2 kW/kg            1.4 kW/kg
                                        Efficiency             -                 94%

Recently, the U.S. DOE has begun discussions of draft targets that reach beyond these 2022
targets. While there are minimal details available on the assumptions and methodology of the
new targets as they are not yet finalized, U.S. DOE representatives have publicly presented on
an aspirational draft target of $80/kWh by approximately 2030 to make BEVs more price
competitive with internal combustion engines. 27 Of note, these targets are not projections of
battery costs in a specific timeframe but rather cost targets that U.S. DOE has calculated that
would need to be achieved for increased price competitiveness of BEVs relative to internal
combustion engine vehicles. The agency expects to continue to engage with U.S. DOE as it
further updates targets that have helped prioritize and guide innovation in battery and electric
drive technology.

U.S. Driving Research and Innovation for Vehicle efficiency and Energy (DRIVE) 28 has also put
forth industry targets that align with the EV Everywhere targets. However, these additional
targets were established specifically for conventional hybrid electric vehicles (HEV), as ancillary
components (interconnects, fuses, etc.) account for a larger percentage of the total system cost,
mass, and volume. For BEVs and PHEVs where those ancillary components are a much
smaller part of total electrification system, the goals were focused on the components that make
up the largest share of the costs. The targets, which were also shown in the 2016 TAR29 and in
Table 2 below, are useful as benchmarks to assess industry’s progress on individual
components.

27 Sarkar, 2016. Sarkar, Ruben. U.S. Department of Energy. “The ZEV Imperative: Achieving >80% Decarbonization

of Transportation,” in FISITA World Automotive Summit, Palo Alto, 2016.
28 A private/public partnership managed by the U.S. Council for Automotive Research (USCAR) of which the U.S.

DOE is a member
29 EPA 2016.

                                                    C-6
Table 2 - U.S. DRIVE 2015 and 2020 Targets for Electrified Components 30,31
U.S. DRIVE Target (Lab
Year)
2015 2020
1.3 kW/kg 1.6 kW/kg
Electric Motor
$7/kW $4.7/kW
12 kW/kg 14.1 kW/kg
Power Electronics
$5/kW $3.30/kW
Motor and 1.2 kW/kg 1.4 kW/kg
Electronics
Combined $12/kW $8/kW
3 kW DC/DC 1.0 kW/kg 1.2 kW/kg
Converter $60/kW $50/kW
II. B. PEV Technology Trends
ZEV technology continues to change rapidly as the industry responds to evolving market
pressures, consumer demands, and California, U.S., and other global regulatory requirements.
Some manufacturers are only now beginning to release first generation ZEV products while
others are starting to place their second and third generation vehicles in the market. Those
vehicles utilize various technologies that continue to change. This portion of the ZEV technology
assessment will focus on batteries, electric motors, on-board chargers (OBC), power
electronics, and materials that make advancements in those systems possible. There have also
been several broader trends in ZEV technology taking place within the industry: battery packs
with increased, energy capacity, vehicle with more electric range, and expanding ZEV
technology onto various vehicle segments. All of those things are leading to a wider range of
models that offer customers more utility.
II.B.1. 2016 Technical Assessment Report PEV Findings
The 2016 TAR identified several new trends and reaffirmed several others that were part of the
2012 federal Final Rulemaking (FRM). 32 The first trend noted is that the current BEV market
appears to have bifurcated into two segments. The first is a non-luxury segment with prices
targeting mass-market segment offerings and an average 85 mile label AER, with significant
range increases to beyond 200 miles expected in the next few years. The second is a luxury
segment already offering well over a 200 mile label AER. Staff expects both segments to
continue to pursue range increases until the manufacturer determines it has found the
appropriate combination of range and price that appeals to the largest segment of consumers.
30 The goals were established for the 2015 and 2020 lab years (which are intended to approximate five years before
the component would be ready for commercialization and wide-scale mass production).
31 DRIVE, 2013. U.S. Driving Research and Innovation for Vehicle Efficiency and Energy Sustainability. "Electrical
and Electronics Technical Team Roadmap," June 2013.
https://www1.eere.energy.gov/vehiclesandfuels/pdfs/program/eett_roadmap_june2013.pdf
32 On August 28, 2012, EPA and NHTSA issued a joint Final Rulemaking to extend the National Program of
harmonized greenhouse gas and fuel economy standards to model year 2017 through 2025 passenger vehicles.
C-7Staff expects some manufacturers will likely offer various battery pack sizes on each model,
much like Tesla currently does for its Model S and Mitsubishi does for its i-MiEV (in Japan only).
The projection for the amount of range that the furthest BEVs travel on a single charge has
changed. The BEV150 category was replaced with BEV200s for the fleet analysis. While PHEV
with increased AER were considered to replace PHEV40s (2010 TAR assumption) in the
analysis, ultimately, the 2016 TAR analysis modeled PHEV40s due to industry trends and lack
of evidence average PHEV range would increase.
There has been an increase in the 20 mile EAER PHEV offerings for the 2015 and 2016 model
year in the luxury and performance oriented segments. Additionally, second generation PHEVs
that are now coming to market are offering more AER due in part to customer demands for a
more all-electric driving experience.
Electric motor sizing for both BEVs and PHEVs were revised to better reflect what industry is
doing. Manufacturers have been able to realize more accelerative performance out of lower
power electric motors than what the 2010 TAR modeled. Electric motors were originally
assumed to require similar nominal power as an ICE to achieve the same performance. Due to
the electric motors ability to make full torque off of idle, the model was revised to use electric
motors with lower nominal power ratings and still achieve equivalent vehicle performance.
Reductions in battery costs were realized due to several changes in inputs to the BatPaC model
along with other changes to how BEVs and PHEVs were modeled. Version 3.0 of the BatPaC
model was released late in 2015 with lowering of raw material input costs, adjustment of
cathode technologies, and several other changes. Changes to the vehicle modeling itself
included increased state of charge (SOC) windows for BEVs and PHEV40s, increased driveline
efficiency, and higher applied aerodynamic drag reductions among other things. Those changes
resulted in smaller and lower cost battery packs due to the reduced energy required to achieve
the same range, and a lower cost per kilowatt-hour (kWh).
Current and publicly announced near term PEV models span platforms from subcompact cars to
large cars, and small sport utility vehicles (SUV) to minivans confirming the technology is
available for a large portion of the market segments. Manufacturers are also using both shared
and dedicated platforms for their PEV offerings indicating there is not yet a clearly defined
superior approach. In some cases, use of a global platform allows commonality across models
and international markets for increased volumes while in other cases, a dedicated platform
allows for a higher level of optimization for the PEV technology.
Even with the advancements, PHEV and BEV models were still not projected to play a
significant role in the fleet in the 2016 TAR analysis. In that analysis, less than 6 percent of the
2025 fleet is expected to be comprised of ZEV or PHEV vehicles and the majority of those
vehicles were included in the reference fleet as necessary to meet the ZEV regulation in
California (and the Section 177 ZEV states) rather than projected as needed by the U.S. EPA’s
OMEGA model to meet the 2018 through 2025 model year greenhouse gas standards.
C-8Other findings noted in the 2016 TAR included acknowledgement that passenger cabin heating
and cooling needs as well as battery thermal management systems can have a significant
impact on BEV and PHEV energy efficiency and range. Some vehicles, such as the Nissan
Leaf, have switched to a heat-pump based heating, ventilation and air conditioning (HVAC)
system in place of the more commonplace resistive heating used on PEVs. This method can be
more efficient in energy management while satisfying cabin temperature needs. Some
manufacturers have also implemented features such as temperature preconditioning of the
cabin or battery while the vehicle is still plugged in and more targeted cabin heating systems
employing items like heated steering wheels and heated seats to meet driver demands for
comfort without expending as much energy to heat the entire cabin.
Direct current fast charging (DCFC) is increasing in availability and popularity, and can support
charging at much higher rates than Level 2 (up to 150 kW in some cases, subject to the
capability of the vehicle being charged). As range increases for PEVs, DCFC needs are growing
fast and may affect usage of Level 2 electric vehicle supply equipment (EVSE); however, there
is no universal standard for the DCFC connectors. Those connectors fall into three categories,
Society of Automotive Engineers (SAE) International Combo Connector, CHAdeMO and Tesla
superchargers 33.
II.B.2. Battery Pack Energy Capacity Increases
Battery pack capacities have increased in both BEVs and PHEVs, and will likely continue to do
so based on manufacturer announcements. Several manufacturers have announced updates of
existing BEVs that will include higher energy capacity battery packs. BEV and PHEV battery
pack growth by model year is graphically represented in Figure 2 and Figure 3, respectively.
II.B.2.i. Examples of Current and Future BEVs with Increased Battery Pack Energy
Capacity
• The 2011 Nissan Leaf was introduced with a 24kWh battery pack. For 2016 model year,
Nissan replaced it with a 30kWh battery pack utilizing the same exterior dimensions in
some of the trim level variants of the vehicle. 34
• The Chevrolet Spark EV currently has a battery pack with 19kWh of capacity. The Bolt
EV, which is expected to replace the Spark EV, will have 60kWh of energy capacity
when it goes on sale at the end of 2016. 35
• The Tesla Model S battery pack energy capacity options have steadily grown in size
since the introduction of the vehicle in 2012. The smaller 60 kWh option grew to 70 kWh
in 2015, and then a 75 kWh option was added for 2016. The largest of the initial battery
pack offerings (the 85kWh version) also grew to 90kWh in 2015, and a 100kWh version
33 More information on DCFC and other infrastructure developments can be found in Appendix D.
34 Loveday, 2015. E. Loveday, "Breaking; 30 kwh 2016 Nissan Leaf gets EPA range rating 107 miles," 19 October
2015. http://insideevs.com/breaking-30-kwh-2016-nissan-leaf-gets-epa-range-rating-107-miles/. [Accessed 15
October 2016].
35 Blanco, 2016. S. Blanco, "Chevy Bolt EV's battery shows big improvements over Spark's," 11 Janaury 2016.
http://www.autoblog.com/2016/01/11/chevy-bolt-volt-batteries-similar-different/. [Accessed 15 October 2016].
C-9was announced on August 23, 2016 which customers have already started taking
deliveries of 36.
• The 2017 model year BMW i3 will see an increase in its battery pack size from 22 kWh
(nominal) to 33 kWh (nominal) 37.
• Ford is expected to update the 2017 model year Focus BEV to be capable of at least a
100 mile label range, an upgrade from the 74 mile label range in the first generation
product. 38.
• An executive from the Volkswagen Group stated that its e-Golf will receive a battery
pack update from 24.2 kWh to 35.8 kWh for the 2017 model year 39.
Figure 2 - BEV Battery Pack Growth by Model Year 40
120
100
Pack size (kW-hr)
80
60
40
20
0
2010 2011 2012 2013 2014 2015 2016 2017
Introductory model year
II.B.2.ii. Examples of Current and Future PHEVs with Increased Battery Pack Energy
Capacity
• Chevrolet increased the size of the battery pack from 16 kWh in its first generation Volt
to 18.4 kWh for the second generation of the vehicle. 41
36 Tesla, 2016a. Tesla Motors. "New Tesla Model S Now the Quickest Production Car in the World," 23 August 2016.
https://www.tesla.com/blog/new-tesla-model-s-now-quickest-production-car-world. [Accessed 28 August 2016].
37 BMW, 2016a. BMW Group. "The new 2017 BMW i3 (94 Ah): More range paired to high-level dynamic
performance," 2 May 2016. https://www.press.bmwgroup.com/usa/article/detail/T0259560EN_US/the-new-2017-
bmw-i3-94-ah-:-more-range-paired-to-high-level-dynamic-performance?language=en_US. [Accessed 28 August
2016].
38 Voelcker, 2015. J. Voelcker, Green Car Reports. "Updated 2017 Ford Focus Electric: 100-Mile Range, DC Fast
Charging,", 10 December 2015. http://www.greencarreports.com/news/1101359_updated-2017-ford-focus-electric-
100-mile-range-dc-fast-charging#image=3. [Accessed 29 August 2016].
39 LeSage, 2016. J. LeSage, hybridCARS, "VW Exec Reveals ‘Real World’ Range of New e-Golf," 23 May 2016.
http://www.hybridcars.com/vw-exec-reveals-real-world-range-of-new-e-golf/. [Accessed 29 August 2016].
40 For vehicles that have been certified by EPA. Incorrect information obtained from
http://www.fueleconomy.gov/feg/download.shtml and supplemented by manufacturer
41 GM, 2016a. General Motors, "Chevrolet Volt - 2016,"
http://media.chevrolet.com/media/us/en/chevrolet/vehicles/volt/2016.html. [Accessed 15 October 2016].
C - 10• The soon to be released Prius Prime has a battery pack with an energy capacity that is
twice that of the older 2012 through 2015 model year Prius Plug-In Hybrid; 8.8kWh for
the Prime and 4.4kWh for the older Prius Plug-In Hybrid. 42
• The 2017 model year Porsche Panamera 4 E-Hybrid will have a 14.1kWh battery pack 43
up from 9.4kWh44 of the previous model year.
Figure 3 - PHEV Battery Pack Growth by Model Year
25
Calculated Battery Pack
20
Capacity (kWh)
15
10
5
0
2010 2011 2012 2013 2014 2015 2016 2017
Model Year introduction
II.B.3. Vehicle All Electric Range Increases
Vehicle AER has been steadily increasing since the 2012 ACC rulemaking due to the
aforementioned battery pack capacity increases, along with efficiency improvements made to
drivetrains and associated components. The first generation Chevrolet Volt is one example of
range improvements absent a battery change, as its AER increased from 35 miles to 38 miles
without any reported change in nominal battery energy capacity. 45 The Nissan Leaf (BEV) was
introduced for the 2011 model year with 73 miles label AER, which increased to 75 miles in
2013 model year, and to 84 for 2014 model year with no changes to the battery pack nominal
energy capacity. For the 2016 model year, the Leaf with the 30kWh battery pack received
another increase to 107 mile label AER. 46 Tesla’s Model S has received updates since its
introduction for the 2012 model year resulting in increases in range. Other than the increases in
42 PluginCars 2016, PluginCars.com “Toyota Prius Plug-In Hybrid (Prime) Review”, http://www.plugincars.com/toyota-
prius-plugin-hybrid [Accessed 27 October 2016].
43 Korzeniewski, 2016. Korzeniewski, Jeremy “Porsche Panamera 4 E-Hybrid has 462 hp and 516 lb-ft of torque” 8
September 2015. http://www.autoblog.com/2016/09/08/2018-porsche-panamera-4-e-hybrid/ [Accessed 26 October
2016].
44 Porsche, 2013. Porsche “New Plug-in Hybrid and Extended Wheelbase Variants Added to Revised Panamera
Range” 3 April 2013 http://press.porsche.com/news/release.php?id=776 [Accessed 26 October 2016]
45 DOE, 2016b. U.S. Department of Energy, “2011 and 2015MY Chevrolet Volts Compared
http://www.fueleconomy.gov/feg/Find.do?action=sbs&id=30980&id=35246. [Accessed 29 August 2016].
46 DOE, 2016c. U.S. Department of Energy, " 2011, 2013, 2014, and 2016MY (30kW-hr battery pack) Nissan Leafs
Compared," http://www.fueleconomy.gov/feg/Find.do?action=sbs&id=30979&id=33558&id=34699&id=37067.
[Accessed 29 August 2016].
C - 11battery pack energy capacity, the Model S has seen range increases resulting from a dual motor
AWD drivetrain option amongst other undisclosed efficiency updates. The single motor 90kWh
Model S variant was certified by U.S. EPA with 263 miles of range, while the dual motor variant
with the same (listed) battery pack capacity was certified at a range of 286 miles; an increase of
roughly 8.7% 47.
The U.S. DOE developed a chart, shown in Figure 4 which compares the median range of ZEVs
for 2016 model year. Since this figure was released, the maximum range number has changed
slightly for the 'All-Electric Vehicles', because Tesla announced its Model S P100D package for
2016 model year that is certified at 315 miles label AER, a significant increase from other Model
S vehicle packages.
Figure 4 - U.S. DOE Chart Comparing PEVs and Conventional Vehicle Ranges for 2016
Model Year 48
II.B.4. Increased Platform and AWD Capability
Industry is also expanding its PEV product offerings into vehicle size, type, and range segments
previously unoccupied by any BEV or PHEV. As mentioned previously Volvo introduced its 14
mile EAER XC90 T8 7 passenger AWD PHEV SUV in 2016 model year. Volvo will begin
offering that same AWD drivetrain in its S90 large luxury sedan for the 2017 model year with the
47 DOE, 2016d. U.S. Department of Energy 2016 “Tesla Model S (90 kW-hr battery pack) and 2016 Tesla Model S
AWD - 90D Compared,” http://www.fueleconomy.gov/feg/Find.do?action=sbs&id=37235&id=37240. [Accessed 29
August 2016].
48 DOE, 2016e. U.S. Department of Energy, "FACT #939: AUGUST 22, 2016 ALL-ELECTRIC VEHICLE RANGES
CAN EXCEED THOSE OF SOME GASOLINE VEHICLES," 22 August 2016. http://energy.gov/eere/vehicles/fact-
939-august-22-2016-all-electric-vehicle-ranges-can-exceed-those-some-gasoline. [Accessed 7 October 2016].
C - 12wagon version, the V90, to follow in late 2017 calendar year. 49,50 Mercedes-Benz introduced the
GLE550e 4matic 12 mile label AER PHEV AWD SUV in 2016 model year. BMW brought a
PHEV AWD SUV to market for the 2016MY with its X5 xDrive40e, but it is not currently eligible
for transitional ZEV (TZEV) credits because the engine is not certified to the required Low
Emission Vehicle (LEV) III super-low-emission vehicle (SULEV) 30 emission standard. 51 In
January 2017, Chrysler started delivering its 8-passenger Pacifica Hybrid, the first PHEV to be
released in the mini-van segment. 52 The Pacifica Hybrid has an EPA certified all-electric label
range of 33 miles and qualifies as a TZEV.
Figure 5 shows the number of available and expected ZEV and PHEV (TZEV only) models
through 2021. To begin, staff compiled an extensive list of all the currently available models
and all of the future models that are expected to be released using publically available news
articles. While staff looked at all articles that mentioned the release of potential future vehicles,
ultimately this analysis focused on only those vehicles featured in articles that referenced
information from an official OEM spokesperson or press release. This analysis was additionally
informed in part by confidential meetings with OEMs. In developing this list, staff assumed that
each vehicle model would be offered for at least six model years. The figure indicates that the
product offerings are expected in broader market segments than currently available and that
further increases in range are expected.
Staff was interested in determining model year of the vehicle, likely EPA size classification, and
total AER for all future available vehicles. Where this information was not available, an effort
was made to compare the vehicle to the current offerings in a manufacturer’s lineup or to
current best-selling ZEV or PHEV models, typically by using release year referenced to mean
model year. In cases where the article projected a release “late” in a calendar year, the next
calendar year was chosen as model year. For example, the Chevrolet Bolt EV was released in
late calendar year 2016 as a model year 2017 vehicle. Staff utilized the EPA Size
Classification 53 for vehicle size as this is information is available as a reference for all current
EPA certified vehicles and is a publically available metric. In most cases the stated vehicle
range was assumed to be the EPA label range.
The chart in Figure 5 shows all of the 2018 through 2021 model year vehicles staff expects to
be available to consumers based on vehicle technology type (e.g. BEV, BEVx, TZEV, and
49 Volvo, 2015. Volvo Car Corporation, "Volvo Cars Debuts the S90 Luxury Sedan," 2 December 2015.
https://www.media.volvocars.com/us/en-us/media/pressreleases/170061/volvo-cars-debuts-the-s90-luxury-sedan.
[Accessed 29 August 2016].
50 Volvo, 2016b. Volvo Car Corporation, "Volvo Cars reveals stylish and versatile new V90 wagon," 16 February
2016. https://www.media.volvocars.com/us/en-us/media/pressreleases/173662/volvo-cars-reveals-stylish-and-
versatile-new-v90-wagon. [Accessed 29 August 2016].
51 PHEVs are classified in two categories: transitional zero-emission vehicles (TZEV), which must meet super ultra-
low-emission vehicle (SULEV) exhaust emission standards, provide an extended warranty on emission control
systems, and have zero evaporative emissions in order to qualify for credits under California’s ZEV regulation, and
non-TZEV PHEVs, which do not qualify to earn credits.
52 FCA, 2017. Fiat Chrysler. Pacifica Hybrid (Webpage) http://www.chrysler.com/2017/pacifica/hybrid/index.html
[Accessed January 13, 2017]
53 DOE 2016f. U.S. Department of Energy. Fuel Economy Website, Frequently Asked Questions “How are vehicle
size classes defined?” https://www.fueleconomy.gov/feg/info.shtml Accessed November 1, 2016
C - 13FCEV), EPA size class, and projected vehicle range. The chart focuses on ZEVs and PHEVs
that are TZEV certified and are therefore qualified to be used toward ZEV compliance. The chart
is color coordinated based on vehicle technology. In cases where a given model will be
available with more than one vehicle range, as is the case with two of the currently available
BEV models, a vehicle icon will appear as slightly translucent. The icons are sized relative to the
key located on the left side of the chart that indicates the number of models expected in that
segment, range, and technology type. In order to reduce the size of the chart, the “Small Car”
size classification includes all vehicles that are expected to be classified as a Two-Seater,
Minicompact, Subcompact or Compact. Additionally, the Mid-Size Car classification includes
several models that are expected to fall within the passenger car segment but publicly available
details are insufficient to determine the EPA Size Class.
C - 14Figure 5 - 2018 to 2021MY Unique ZEVs by Size, Type, and Range
C - 15II.B.5. Current State of PEV Specific Technology
Understanding both battery and non-battery technology is critical to understanding the current
status of PEVs and where the technology may be headed. Key technologies include battery
cells and packs, battery management systems, drive motors, inverters, on-board chargers
(OBC), direct current to direct current (DC-DC) converters, PEV specific HVAC components,
and high voltage wiring and interconnects. While batteries account for the greatest portion of
vehicle cost, non-battery components are essential to the operation of the vehicles.
II.B.5.i. PHEV and BEV Cross-Over
In trying to understand economies of scale and applicability of advancements in individual
technologies, it is important to note where PHEVs and BEVs use the same and/or different
components. While PHEV and BEV powertrains use similar components, layouts can be quite
different. BEV electric machines tend to have a single speed gear reduction gear box
centralized between a vehicle’s axles. PHEV electric machines usually reside somewhere in the
powertrain system, generally with the ICE and its transmission. These basic differences in
layout can have an effect on the types and designs of motors, transaxles, battery cells, and
power electronics that are used in each technology. Additionally, PHEVs typically have lower
power OBC to support lower energy capacity battery packs.
II.B.5.ii. Powertrain Layout and Transaxle Configurations
Many of the differences between BEVs and PHEVs exist in their respective transaxle
architecture. All the BEVs on the market use single speed gear reduction transmissions to
transmit the electric machine power to the wheels. The designs tend to be relatively simple and
compact compared to PHEVs or even more conventional powertrain technologies. BEVs, at the
moment, locate the combined electric motor and gearbox at either the front or rear axle. In the
case of the dual-motor Tesla Model S, it uses an electric motor and gearbox combination at
both the front and rear axles.
PHEVs, in contrast, come in a variety of different formats and configurations. In the case of the
systems from Ford, General Motors, Toyota, and Chrysler, they have two electric motors that
are packaged in a transaxle assembly designed for a front-wheel drive vehicle (FWD). Other
systems being utilized include electric motors located between the engine and transmission (P1
or P2 location in Figure 6), at the axle (P4), or a combination of these locations. A simplified
diagram of the typical locations of electric motors in HEVs can be seen in Figure 6.
C - 16Figure 6 - Electric Motor Positions in HEVs 54
Shown in Figure 755 and Figure 8 56 are the Chevrolet Bolt EV powertrain and the second
generation Chevrolet Volt electric powertrain to highlight some of the differences. The Bolt EV,
like every currently available BEV, uses an electric motor attached to a single speed gearbox.
The Volt, has two electric motors coupled with two planetary gear sets and two clutches in a unit
that attaches to the vehicle’s ICE. There is additional complexity in the Volt powertrain
compared to that of the Bolt EV, both from a mechanical perspective and a controls perspective.
Figure 8 - Chevrolet Bolt EV Electric Figure 7 - Chevrolet Volt (Gen 2)
Powertrain Electric Powertrain
54 McKay, 2016. P. Brian McKay, "Benefits of a 48V P2 Mild Hybrid," in Advanced Clean Cars Symposium: The Road
Ahead, Diamond Bar, 2016.
https://www.arb.ca.gov/msprog/consumer_info/advanced_clean_cars/potential_efficiency_and_cost_benefits_of_48v
_systems_and_synergistic_technologies.pdf
55 GM, 2016b. General Motors, Inc. “Drive unit and battery at the heart of the Chevrolet Bolt EV” January 11, 2016.
http://media.chevrolet.com/media/us/en/chevrolet/news.detail.html/content/Pages/news/us/en/2016/Jan/naias/chevy/
0111-bolt-du.htmlu.html
56
Nagy, 2014a. Bob Nagy. Kelly Blue Book. “2016 Chevrolet Volt gets new Voltex powertrain” October 29, 2014.
http://www.kbb.com/car-news/all-the-latest/2016-chevrolet-volt-gets-new-voltec-powertrain/2000011318/
C - 17Two other examples of BEV and PHEV powertrain architecture and layout include the Tesla
Model S and Volvo XC90 T8, shown in Figure 9 and Figure 10, respectively. The Tesla Model S
rear drive unit includes an electric motor coupled to a single speed gear reduction transaxle
packaged with a drive motor inverter assembly. The Volvo XC90 T8 has a FWD 8-speed
transmission mated to the gasoline engine and equipped with a crank integrated starter
generator (CISG), and an electric rear drive unit in the P4 position that couples a motor, single
speed gearbox, and power and control electronics in a single package.
Figure 9 - Tesla Model S Rear Drive Unit Assembly57
57Hutchinson, 2013. L. Hutchinson, "Review: Tesla Motors’ all-electric Model S is fast—but is it a good car?," Ars
Technica, 27 October 2013. http://arstechnica.com/features/2013/10/review-tesla-model-s/3/. [Accessed 21 October
2016]
C - 18Figure 10 - Volvo XC90 T8 Powertrain Cutaway58
II.B.5.iii. Electric Machines
In most cases, both BEVs and PHEVs use permanent magnet electric machines. Induction
based electric machines are used in some BEVs, most notably current Tesla models, but rarely
in other current installations. The one exception is the upcoming Cadillac CT6 PHEV. It will have
one induction electric machine and one permanent magnet machine in its rear-wheel drive
(RWD) electric vehicle transmission (EVT). 59
While most electric machines in BEVs and PHEVs are of the permanent magnet variety, they
generally differ in design for many reasons. BEV electric machines are responsible for providing
all of the motive power for the vehicle. PHEV systems can be split into two different groups:
blended and non-blended. Blended PHEVs do not have an electric drive powertrain that is
capable of meeting all of the motive power requirements of the vehicle on electric power only.
Non-blended PHEVs, like the Chevrolet Volt, are capable of driving on electric power over the
entire range of driving conditions. Non-blended PHEVs require electric machine(s) that are
capable of delivering power levels roughly equal to that of the ICE.
With current power densities of electric machines and the size of single gear reduction
transaxles, BEV electric machines can be relatively powerful. PHEVs are generally more limited
by the space constraints available in a vehicle that also has a gasoline engine and conventional
transmission. This leads to differences in sizing and power densities of the motors. Additionally,
cooling electric machines in a PHEV when they are packaged in a transaxle that is connected to
an ICE can be more complicated due to the heat produced by the ICE.
58 Nagy, 2014b. B. Nagy, "2016 Volvo XC90 T8 Twin Engine hybrid shown," Kelley Blue Book, 8 July 2014
http://www.kbb.com/car-news/all-the-latest/2016-volvo-xc90-t8-twin-engine-hybrid-shown/2000010891/. [Accessed 21
October 2016]
59 Khan, 2016. Khan, A., Grewe, T., Liu, J., Anwar, M. et al., "The GM RWD PHEV Propulsion System for the Cadillac
CT6 Luxury Sedan," SAE Technical Paper 2016-01-1159, 2016, doi:10.4271/2016-01-1159.
C - 19You can also read