CAT STREET: Chronicle Archive of Tokyo Street-fashion
←
→
Page content transcription
If your browser does not render page correctly, please read the page content below
CAT STREET: Chronicle Archive of Tokyo Street-fashion

                                                                                       Satoshi Takahashi
                                                                                    Kanto Gakuin University
                                                                     1-50-1 Mutsuura-higashi, Kanazawa-ku, Yokohama, Japan
                                                                                        satotaka@kanto-gakuin.ac.jp
arXiv:2009.13395v1 [cs.CV] 28 Sep 2020

                                                          Keiko Yamaguchi                                                 Asuka Watanabe
                                                          Nagoya University                                       Kyoritsu Womens Junior College
                                                 Furo-cho, Chikusa-ku, Nagoya, Japan                        2-2-1 Hitotsubashi, Chiyoda-ku, Tokyo, Japan
                                                keiko.yamaguchi@soec.nagoya-u.ac.jp                                asuka watanabe@kyoritsu-wu.ac.jp

                                                                  Abstract                                      online stores. To achieve these objectives, many researchers
                                                                                                                created their own fashion image databases to determine
                                             The analysis of daily life fashion trends can help us              fashion trends, and annotated a variety of auxiliary informa-
                                         understand our societies and human cultures profoundly.                tion to fashion images, such as color, fabric, shape, texture,
                                         However, no appropriate database exists that includes im-              location, and search queries [28, 12, 15, 21, 25, 26, 1].
                                         ages illustrating what people wore in their daily lives over               The advantages of fashion image databases have contin-
                                         an extended period. In this study, we propose a new fashion            ued to attract attention not only for business improvement
                                         image archive, Chronicle Archive of Tokyo Street-fashion               but also for understanding our societies from a cultural per-
                                         (CAT STREET), to shed light on daily life fashion trends.              spective. In particular, the fashion style adopted in daily
                                         CAT STREET includes images showing what people wore                    life is an important aspect of culture. As noted by Lan-
                                         in their daily lives during the period 1970–2017, and these            cioni, fashion is a reflection of a societys goals and aspi-
                                         images contain timestamps and street location annotations.             rations [14]; people choose fashion styles within the social
                                         This novel database enables us to observe long-term daily              contexts in which they are embedded. The analysis of daily
                                         life fashion trends using quantitative methods. To evaluate            life fashion trends would provide a more in-depth under-
                                         the potential of our database, we corroborated the rules-              standing of our societies and human cultures.
                                         of-thumb for two fashion trend phenomena, namely how                       However, the fashion databases proposed in previous
                                         economic conditions affect fashion style share in the long             studies have several limitations in terms of approach to
                                         term and how fashion styles emerge in the street and diffuse           daily life fashion trends. First, the level of details of lo-
                                         from street to street. Our findings show that the Conserva-            cation annotation in existing databases is not sufficient to
                                         tive style trend, a type of luxury fashion style, is affected by       analyze daily life fashion trends. Fashion is a way to ex-
                                         economic conditions. We also introduce four cases of how               press oneself and is affected by a wide variety of social fac-
                                         fashion styles emerge in the street and diffuse from street            tors, such as culture, economic conditions, historical events,
                                         to street in fashion-conscious streets in Tokyo. Our study             and social position [14]. People belong to the social com-
                                         demonstrates CAT STREETs potential to promote under-                   munity, and some social communities have their own dis-
                                         standing of societies and human cultures through quanti-               tinct fashion styles. In addition, social communities have
                                         tative analysis of daily life fashion trends.                          their own territory. For instance, Shibuya Fashion is a fash-
                                                                                                                ion style for young ladies, originating from a famous fash-
                                                                                                                ion mall in Shibuya. The young ladies who are dressed
                                         1. Introduction                                                        in Shibuya Fashion frequent Shibuya, one of the famous
                                            Analysis of fashion trends is one of the hot topics in fash-        fashion-conscious streets in Japan. Hence, we need fash-
                                         ion research. Several studies in computer science have at-             ion image data with location annotations at the street level
                                         tempted to predict future fashion trends or evaluate long-             to focus on what people wear in their daily lives [11].
                                         term fashion trends [3, 27, 16, 5, 2, 20]. The motivation is               Second, most databases consist of recent fashion images
                                         mostly to predict the next fashion move for vendors produc-            in the last decade because they are obtained from the inter-
                                         tion plans or improvement in recommendation engines in                 net. However, the periods covered by these databases might

                                                                                                            1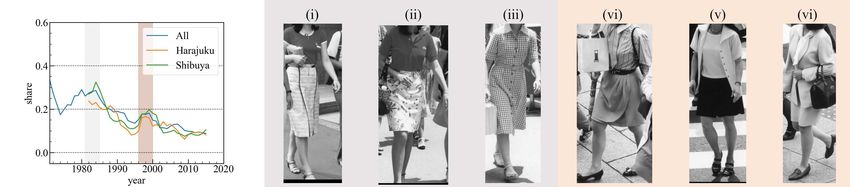
not be sufficiently long to determine the fashion trends. So-        notations for 14 body parts and clothing labels on superpixel
ciologists and anthropologists have found, by examining              regions. There are no location, timestamp, and fashion style
how fashion changes over extended periods, that fashion has          annotations.
decadal-to-centennial trends and cyclic patterns [13]. For               Subsequently, many fashion image databases with aux-
example, the hemline index, which is a well-known index to           iliary information have been created, such as Hipster
measure economic conditions, indicates a cyclic pattern in           Wars [12], DeepFashion [15], Fashion 144k [21], Fashion-
which the skirt length becomes shorter when the economic             Style14 [25], When Was That Made? [26], and Fashion Cul-
condition gets better [7]. This pattern was determined based         ture Database [1].
on observation of the skirt length in the 1920s and 30s. As              Hipster Wars, DeepFashion, and FashionStyle14 have
an exception to the fashion database in computer science,            fashion style labels as training data for fashion style cluster-
Vittayakorn et al. collected fashion images from 1900 to             ing. These fashion images were collected from Google Im-
2009 to investigate how vintage fashion influenced fashion           age Search [12], online shopping websites [15], and internet
show collections in the period 2000–2014 [26]. However,              crawlers [21]. Furthermore, Fashion 144k, When Was That
the images labeled according to decades do not seem to cap-          Made?, and Fashion Culture Database have location and/or
ture how people choose fashion styles in their lives. From           timestamp annotations. Fashion 144k has city level loca-
these previous findings and the limitations in several fields,       tion [25], When Was That Made? has decade labels such
it can be inferred that we need a fashion database in which          as 90s, 1954–1957, and 1920s [26], and Fashion Culture
images with more granular date labels cover a long period,           Database has city level location and time stamp [1].
at least a few decades, to determine the trends and cyclic               These fashion databases have limitations that need to be
patterns.                                                            overcome to shed light on daily life fashion trends. In this
    In this study, we propose a new fashion archive consist-         study, we define daily life fashion trends as trends of fash-
ing of long-term fashion images with street location annota-         ion styles that consumers adopt in their daily lives. We
tion to shed light on daily life fashion trends. Then, we cor-       need data on how and what consumers wear to capture their
roborated the rules-of-thumb for two fashion trend phenom-           fashion styles. Fashion photographs on the Internet, how-
ena, namely how economic conditions affect fashion style             ever, contain two types of fashion images: one type displays
share in a long time span and how fashion styles emerge in           clothes that consumers themselves choose to wear and the
the street and diffuse from street to street, to demonstrate         other type is taken by professional photographers to pro-
the potential of our database.                                       mote a clothing line. Previous studies built their databases
    This papers main contributions are as follows:                   by collecting fashion images from the Internet; hence, ex-
   • We propose a new fashion image archive, CAT                     isting databases do not reflect only the fashion styles chosen
      STREET, which includes images reflecting what                  by consumers. In addition, no database has both long-term
      women wore in their daily lives from 1970 to 2017.             timestamps and location information. Daily life fashion ex-
      It contains timestamps and street location annotations.        ists in the street [11, 18], and it changes over time and ex-
   • Our study demonstrates CAT STREETs potential to                 hibits some trends and cyclic patterns for an extended pe-
      promote understanding of our societies and human cul-          riod. Building a new fashion image database with more
      tures through the quantitative analysis of daily life          granular, long-term timestamps and location information
      fashion trends.                                                that reflects daily life fashion is required to analyze fash-
   • Our findings show that the Conservative style trend, a          ion from a cultural perspective.
      type of luxury fashion style, is affected by economic
      conditions.                                                    3. CAT STREET: Chronicle Archive of Tokyo
   • We introduce four cases to discuss how fashion styles               Street-fashion
      emerge in the street and then diffuse from street to
                                                                        We propose CAT STREET, a new fashion image archive
      street in fashion-conscious streets in Tokyo.
                                                                     that includes images reflecting what women wore in their
                                                                     daily lives from 1970 to 2017.
2. Related work
                                                                        We created CAT STREET using the following steps. We
    The methodologies and fashion image databases pro-               took street-fashion photographs once or twice a month in
posed in previous studies help us to understand what fashion         fashion-conscious streets such as Harajuku, Shibuya, and
is. Table 1 presents the best-known public databases from            Ginza in Tokyo from 1980 to the present. In addition, we
fashion studies in computer science.                                 used fashion photographs from a third-party organization
    Fashionista is a representative fashion image database in        taken in the 1970s at monthly intervals in the same fashion-
the early stage of fashion analysis using computer vision            conscious streets. Thence, by sorting images from the two
techniques [28]. The images in Fashionista were collected            data sources, we built a primary image database that has
from Chictopia.com, a fashion blog. They contain pose an-            timestamps from 1970 to 2017. The photos from the third-

                                                                 2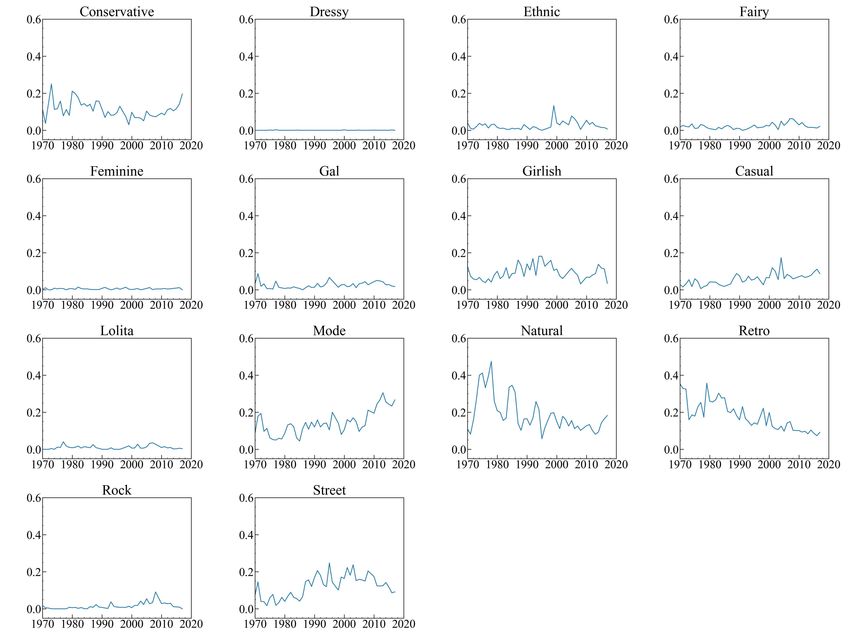
Database name               Number of images        Geographical information            Time stamp    Fashion style
           Fashionista [28]               158,235                                                                     No
          Hipster Wars [12]                1,893                                                                     Yes
          DeepFashion [15]                800,000                                                                    Yes
          Fashion 144k [21]               144,169                       City unit                                    Yes
         FashionStyle14 [25]               13,126                                                                    Yes
                                                                                                   1900–2009
     When Was That Made? [26]                100,000                                                                  No
                                                                                                   Decade unit
                                                                                                   2000–2015
     Fashion Culture Database [1]          76,532,219                   City unit                                     No
                                                                                                    Date unit
                                                                                                   1970–2017
    CAT STREET (Our Database)                 14,679                   Street unit                                    No
                                                                                                    Date unit

                                    Table 1. Popular fashion databases used in computer science.

                                             Figure 1. Data overview of CAT STREET.

party organization do not have information about which               whether CAT STREET met some requirements for a
photos were taken in which street, hence we annotated fash-          database to capture daily life fashion trends. First, CAT
ion images taken since 1980 with street tags.                        STREET comprises street-snap photographs in the fashion-
    Fashion styles are different for men and women. To fo-           conscious streets in Tokyo. It reflects the fashion style
cus on womens fashion trends in CAT STREET, we de-                   women choose in their real lives and does not include com-
tected the subjects gender and selected womens only im-              mercial fashion images for business purposes. Second, CAT
ages from the primary image database. Gender detection               STREET has necessary and sufficient annotations to track
was performed manually by two researchers, and the de-               fashion trends: monthly timestamps from 1970 to 2017 and
tection results were validated reciprocally. Some images in          street-level location tags. Images in the 1970s do not have
the 1970s are in monochrome; therefore, we gray-scaled all           street tags; however, they belong to the same population as
images to align the color tone for all ages of the image.            photos with street tags since 1980. Hence, we could use
    Street-fashion photographs contain a lot of noise that           all the images in CAT STREET when we analyze the over-
hinders the precise detection of fashion styles that people          all trends of daily life fashion in fashion-conscious streets
wear. To remove the noise, we performed the following im-            as a representative case in Japan. From these features, we
age pre-processing as the final step. We identified human            believe that CAT STREET has the potential to promote un-
bodies in the photographs using OpenPose [30] and clipped            derstanding of our societies and human cultures through the
them to cut out the background images as much as possi-              quantitative analysis of daily life fashion trends.
ble. Then, we trimmed the subjects head to focus on the
clothing items based on the head position, which is detected         4. Analysis of daily life fashion trends
using OpenPose. Figure 1 gives an overview of the data of
CAT STREET. The total number of images in the database                   In this section, we demonstrate CAT STREET’s poten-
is 14,679.                                                           tial to promote understanding of our societies through the
    At the end of the database creation process, we checked          following process.

                                                                 3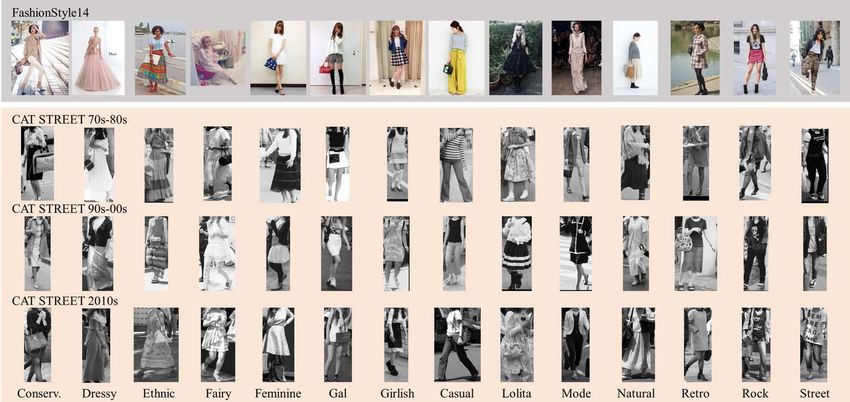
First, we created a fashion style clustering model us-             Figure 3 shows the average correlation coefficients of the
ing deep learning to analyze the fashion styles adopted in            five models for fashion styles. Most fashion styles have high
fashion images. Second, we applied the fashion clustering             correlation coefficients of over 0.8, and the unbiased stan-
model to CAT STREET and calculated the extent to which                dard errors are small. Some fashion styles, such as Dressy,
people adopt the fashion styles in each year. Finally, we             Feminine, and Gal styles, exhibit low correlations. These
demonstrated that CAT STREET enables us to corroborate                styles originally had low style shares, and hence low cor-
the rules-of-thumb for the fashion trend phenomena in our             relations this time. These results indicate that our fashion
society by linking social contexts to the long-term evolution         style clustering model is a robust instrument for reproduc-
of fashion style share. It also allows us to investigate how          ing the time-series patterns of style shares.
fashion styles emerge in the street and move from street to              Figure 4 shows the averages of five style shares for the
street.                                                               period 1970–2017 for each fashion style. Because there
                                                                      were no images for 1997 and 2009, we replaced the zeros
4.1. Fashion style clustering model                                   with the averages of the adjacent values and considered the
   To build a fashion style clustering model, we selected             three-year moving average.
FashionStyle14 [25] as the training dataset. It consists of
14 style classes, as shown in the first row of Figure 2.              4.3. How social factors affect fashion style share
Each class consists of approximately 1,000 images, and the                Social contexts prompt people to shape their social iden-
database consists of a total of 13,126 images. The fashion            tities [24] and choose adequate fashion styles to express
styles of FashionStyle14 were selected by an expert as be-            their identities. It is said that economic conditions have
ing representative of modern fashion trends in 2017. By               an impact on peoples daily clothes. Sometimes people
applying the fashion clustering model to CAT STREET, we               aspire to have a higher social status and are likely to
measured the share of each modern style in each year. We              purchase quality-guaranteed luxury items as a symbol of
also found the beginnings of the characteristic modern fash-          wealth [10, 17]. At the same time, these consumer behav-
ion, such as when the Fairy style came into fashion. Some             iors rely on the economic conditions in the society.
limitations of this approach will be discussed later.                     To demonstrate the capability of CAT STREET to link
   We trained four deep learning (DL) network structures              social contexts to the long-term evolution of fashion style
as options for our fashion clustering model, namely In-               share, we investigated how economic conditions affect the
ceptionResNetV2 [23], Xception [6], ResNet50 [9], and                 Conservative share, which includes luxury fashion brands
VGG19 [22]. We set weights trained on ImageNet [19] as                and items in the definition, as shown in Figure 5(a).
the initial weights and fine-tuned them on FashionStyle14                 With the Conservative time-series share of the five mod-
using the stochastic gradient descent algorithm at a learn-           els in CAT STREET as the dependent variable, we per-
ing rate of 10−4 . For fine-tuning, we applied k-fold cross-          formed a one-way analysis of variance (ANOVA) to eval-
validation with k set as 5.                                           uate the difference in the share level in the business-cycle
   Subsequently, InceptionResNetV2 yielded the highest                trough/peak period in the Japanese economy. We also used
F1-scores among the DL network structures for most fash-              the vector autoregression (VAR) model to test the Granger
ion styles. (The F1-scores are presented in Table 2). Its             causality between the averaged Conservative time-series
accuracy is 0.787, which is higher than the benchmark ac-             share and the gross domestic product (GDP) growth rate in
curacy of 0.72 established by ResNet50 trained on Fash-               Japan. To construct the VAR model, we used the averaged
ionStyle14 in the study by Takagi et al. [25]. Therefore,             Conservative time-series share from 1970 to 2008. The
we adopted the DL network structure InceptionResNetV2                 bankruptcy of Lehman Brothers occurred in 2008, and we
as the fashion style clustering model in this study.                  assumed that it would hurt the business of luxury brands [8]
                                                                      and change the business structure in the fashion industry.
4.2. Fashion styles in CAT STREET
                                                                          Figure 5(b) shows the results of the one-way ANOVA.
    We applied the fashion style clustering model to the im-          The average style shares of Conservative between the
ages in CAT STREET. Figure 2 shows sample images clas-                business-cycle trough and peak were significantly different
sified into each fashion style using the fashion style cluster-       (p < .05). This result indicates that the economic upturn
ing model.                                                            prompted consumers to choose Conservative.
    The fashion style clustering model consisted of five mod-             In terms of Akaike’s Information Criterion(AIC), we se-
els as we performed five-fold cross-validations when the DL           lected the VAR model with a lagged order of 2, and the
network structure was trained, and each model estimated the           F-test showed that the model was significant (p < .05).
style share for each image. To verify the clustering models           We also conducted the Granger-causality test, and it indi-
robustness in terms of reproducing style shares, we eval-             cated that the GDP growth rate Granger-causes the Conser-
uated the time-series correlations among the five models.             vative share. To verify the effect size and significance of the

                                                                  4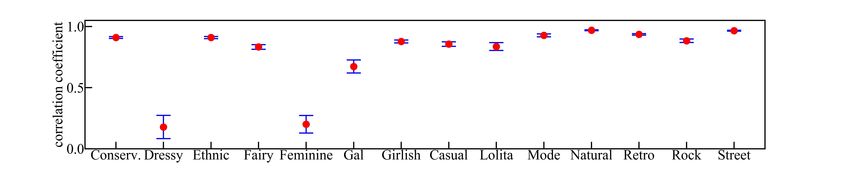
InceptionResNetV2        Xception      ResNet50     VGG19
                          Conservative              0.754              0.758         0.708        0.620
                             Dressy                 0.940              0.936         0.938        0.898
                             Ethnic                 0.812              0.806         0.747        0.668
                              Fairy                 0.901              0.887         0.876        0.814
                            Feminine                0.724              0.734         0.681        0.644
                               Gal                  0.782              0.779         0.757        0.710
                             Girlish                0.640              0.629         0.603        0.523
                             Casual                 0.665              0.667         0.619        0.563
                             Lolita                 0.949              0.942         0.933        0.886
                             Mode                   0.748              0.754         0.721        0.650
                             Natural                0.793              0.779         0.710        0.692
                              Retro                 0.701              0.700         0.644        0.590
                              Rock                  0.777              0.765         0.745        0.694
                             Street                 0.835              0.816         0.781        0.701
                          Weighted Avg.             0.786              0.781         0.747        0.689

                                       Table 2. F1-scores of fine-tuned network architectures.

Figure 2. Overview of FashionStyle14 [25] and sample images in CAT STREET classified into each fashion style using the fashion style
clustering model. Conserv. is abbreviation for Conservative.

GDP growth rate on the Conservative share, we performed              highly recognized, quality-guaranteed luxury brands as the
an analysis of the impulse response function (IRF) using             Conservative style [10, 17]. People who adopt this style
the estimated VAR model. Figure 5(c) plots the IRF of the            exhibit a sense of credibility because the style projects a
effect size of GDP growth rate over time and indicates a sig-        higher social status. The results in this section lead to the
nificant carry-over effect; the increase in the GDP prompted         conclusion that consumers are likely to adopt the Conserva-
consumers to choose the Conservative style after a two-year          tive style more when business conditions are booming, and
delay.                                                               this definition of style qualitatively justified our results. To
                                                                     our knowledge, no study has shown the link between daily
   The Conservative trend is originally represented by a             life fashion trends and social contexts quantitatively.
combination of clothing items that have traditional and old-
school aesthetics, and fashion experts often label items from

                                                                 5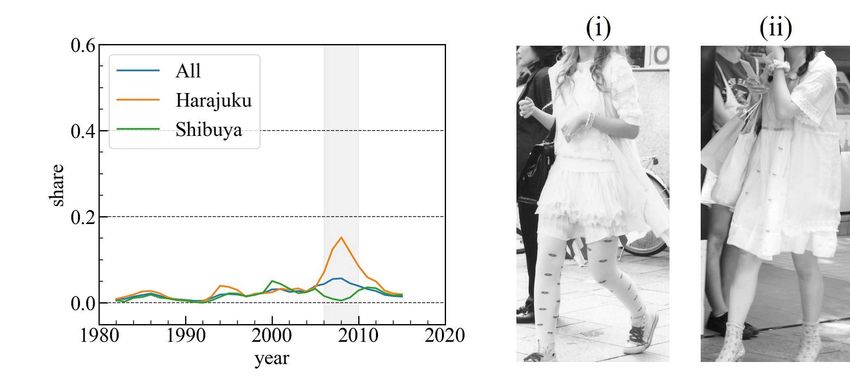
Figure 3. Average correlation coefficients among the five models for fashion styles. The error bars represent the unbiased standard error.
Conserv. is abbreviation for Conservative.

                                               Figure 4. Style shares of each fashion style.

4.4. How fashion styles emerge in the street and                            Geographically, Harajuku and Shibuya are very close
     diffuse from street to street                                      and only one station away from each other; however, they
                                                                        have different cultures and daily life fashion trends. We
   There are two representative fashion-conscious streets               compared two daily life fashion trends in the fashion-
in Tokyo: Harajuku and Shibuya. The fashion styles in                   conscious streets with CAT STREET to investigate how
Harajuku are famously compared with the fashion styles in               fashion styles emerge in the street and diffuse from street to
Shibuya. One of the representative fashion styles in Hara-              street. Figure 6 shows the average style shares of four spe-
juku is Harajuku Kawaii-kei fashion. This style empha-                  cific fashion styles, namely Ethnic, Fairy, Gal, and Retro,
sizes cuteness, and it is represented by the fashion style of a         and their signature images in each street.
Japanese pop singer, Kyary Pamyu Pamyu. In contrast, one
of the representative fashion styles in Shibuya is the Gal                The first case in Figure 6(a) shows an example of style
style. This style is a slightly sexy homegirl fashion [29].             emergence in one street. The Fairy emerged in the late

                                                                    6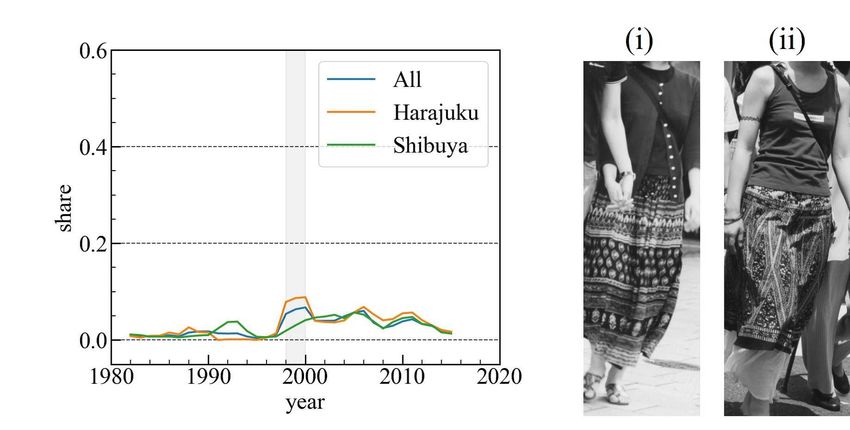
(a) (b) (c)
Figure 5. (a) Average style share for the Conservative style. The gray area indicates the recession periods in the Japanese business cycle.
(b) ANOVA of the Conservative share with economic condition. The error bars represent the standard deviation. (c) Impulse response
function for the effect of the GDP growth rate on the averaged Conservative time-series share over time. The dashed lines indicate the 95%
confidence limits.
(a) Fairy: style emersion in one street (b) Ethnic: style movement from street to street
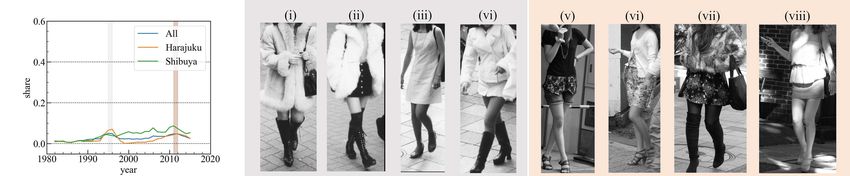
(c) Gal: different style movements in each street
(d) Retro: same style movement in both streets
Figure 6. Average style shares and mentionable figures for four styles: (a) Fairy, (b) Ethnic, (c) Gal, and (d) Retro. All images in (a) and
(b) were taken in Harajuku in 2008–2010 and 1999, respectively. For (c), the left four images were taken in Harajuku (i, ii) and Shibuya
(iii, iv) in 1995–1996, and the right four images were taken in Harajuku (v, vi) and Shibuya (vii, viii) in 2010–2012. For (d), the left three
images (i–iii) are one Retro taken in the early 1980s, and the right three images (iv–vi) are another Retro that came into fashion in the late
1990s.
7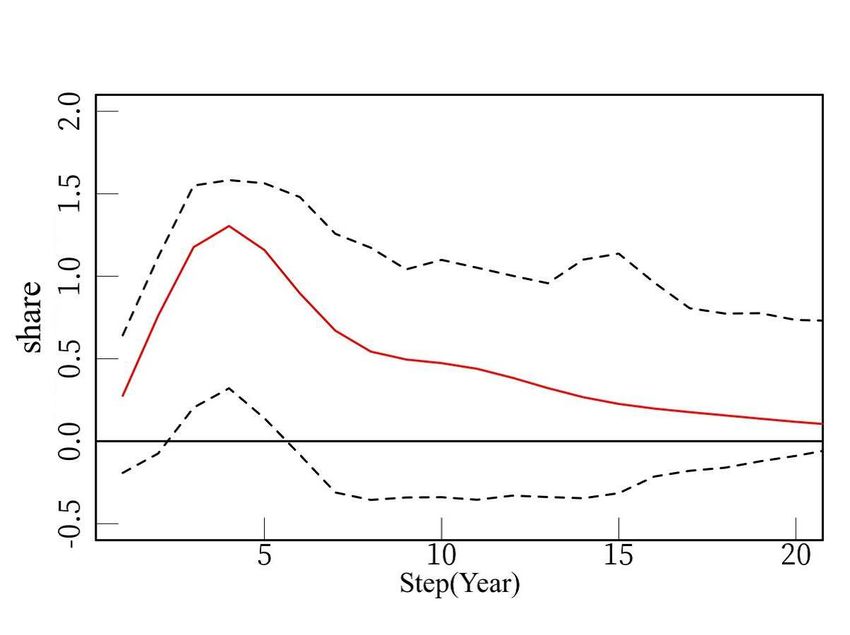
2000s in Harajuku and disappeared in the early 2010s. The            social contexts prompt this style movement from street to
Fairy comprises the fashion coordination of frilly dresses           street, we need to explore and link the existing knowledge
that reminds one of a fairy [29]. The Fairy style is also            in social science to these results.
called Harajuku Romantic style, which emerged around                    These demonstrations suggest that CAT STREET can
2010 [29]. This movement is shown in the style share in              generate novel research questions and hypotheses that are
Figure 6(a).                                                         lacking in existing approaches in the fashion research field
    The next case in Figure 6(b) shows an example of style           and previous fashion databases to promote a more in-depth
movement from street to street. Originally, the Ethnic style         understanding of our societies and human cultures through
is a fashion inspired by native costumes [4]. Previous stud-         quantitative analysis of daily life fashion trends.
ies on fashion revealed that the share of Ethnic was sparked
in the late 1990s by fancy goods stores located in the area          5. Conclusion
near Harajuku, which deal in exotic fashion items. Fig-
                                                                         In this paper, we proposed a new fashion image archive,
ure 6(b) shows that this social background explains the Eth-
                                                                     CAT STREET, to capture daily life fashion trends using
nics upward trend in the late 1990s in Harajuku. Lagging
                                                                     methodologies in computer science. CAT STREET com-
behind the trend in Harajuku, the Ethnic style in Shibuya
                                                                     prises fashion images illustrating what people wore in their
gradually became accepted and reached the same share level
                                                                     daily lives in the period 1970–2017, along with street-level
in the mid–2000s. However, to our knowledge, there is no
                                                                     geographical information. We demonstrated that two rules-
article or commentary that clarifies why the Ethnic style be-
                                                                     of-thumb for the fashion trend phenomena, namely how
came accepted in Harajuku earlier than in Shibuya, and how
                                                                     economic conditions affect fashion style shares and how
and the means through which the style spread from street to
                                                                     fashion styles emerge in the street and diffuse from street to
street.
                                                                     street, can be quantitatively validated using CAT STREET.
    The third case is the Gal style. The style is a slightly             Our work is not without limitations. We used the fash-
sexy homegirl fashion; an iconic fashion mall in Shibuya,            ion style category of FashionStyle14 [25], which is defined
SHIBUYA109, prompted this styles trend [29]. This trend,             by fashion experts and is considered to represent modern
known as maru-ky fashion, emerged in early 2000. Fig-                fashion. However, the definition does not cover all contem-
ure 6(c) shows an example of different style movements in            porary fashion styles and their substyles in a mutually ex-
each street. The Gal style came into fashion in 1995/1996            clusive and collectively exhaustive manner. Defining fash-
in Harajuku and Shibuya simultaneously. Namie Amuro,                 ion styles is a complicated task because some fashion styles
a Japanese pop singer, triggered this movement. She at-              emerge from consumers, and suppliers define others. We
tracted many young girls as a fashionista of this style. The         must refine the definition of fashion styles to capture daily
style remained in Shibuya, whereas it disappeared quickly            life fashion trends precisely.
and reemerged in Harajuku around 2012 with a slightly dif-               Furthermore, prior to building CAT STREET, only
ferent taste.                                                        printed photos were available for the period 1970–2009.
    The final case in Figure 6(d) shows an example of the            Consequently, the numbers of images for these decades
same style movement in both streets. The Retro style is an           are not equally distributed because only those images from
abbreviation of retrospective style [4, 29]. According to the        printed photos that have already undergone digitization are
style definition, the overall downward trend in both streets         currently present in the database. The remainder of the
in Figure 6(d) is plausible. Fashion revival is one of the           printed photos will be digitized and their corresponding im-
relevant fashion trend phenomena of Retro, and there are a           ages added to the database in future work.
wide variety of substyles representing fashion revivals un-              CAT STREET helps us to explore unresolved research
der Retro, such as 60s look, 70s look, and 80s look. In Fig-         questions by applying other quantitative analytical meth-
ure 6(d), slight bounces can be observed in the early 1980s          ods, such as unsupervised clustering, to extract fashion
and late 1990s, which suggest that some type of fashion re-          styles embedded in consumers daily lives. It can expand
vival occurred. We need more detailed style tags to fur-             the boundaries of fashion studies in computer science and
ther investigate which Retro substyles reemerged in the two          other fields.
bounces; this is one of our future research areas.
    We demonstrated how fashion styles emerge in the street          6. Acknowledgments
and diffuse from street to street by mining daily life fashion
                                                                       This work was supported by JSPS KAKENHI Grant
trends in the fashion-conscious streets using CAT STREET.
                                                                     Number 20K02153. We would like to thank Editage
Some movements in the trends are supported by social con-
                                                                     (www.editage.com) for English language editing.
texts reported in previous fashion studies. However, the so-
cial contexts for some trends, such as the Ethnic movement
from Harajuku to Shibuya, remain unclear. To clarify which

                                                                 8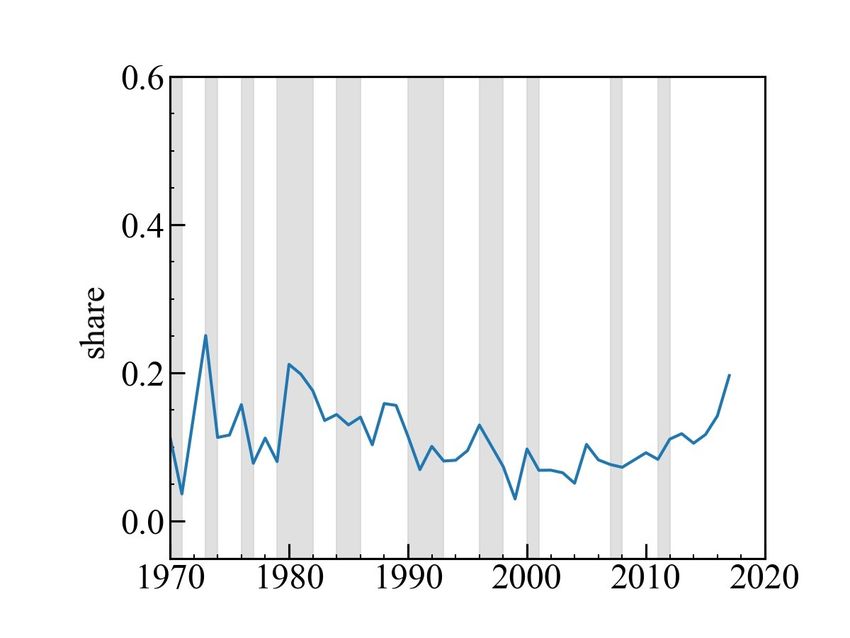
References                                                                 [17] A. Nia and J. L. Zaichkowsky. Do counterfeits devalue the
                                                                                ownership of luxury brands? Journal of Product & Brand
 [1] K. Abe, M. Minoguchi, T. Suzuki, T. Suzuki, N. Akimoto, Y.                 Management, 9(7):485–497, 2000.
     Qiu, R. Suzuki, K. Iwata, Y. Satoh, and H. Kataoka. Fashion
                                                                           [18] A. Rocamora and A. ONeill. Fashioning the street: Images
     culture database: Construction of database for world-wide
                                                                                of the street in the fashion media. Fashion as photograph:
     fashion analysis. In 2018 15th International Conference on
                                                                                Viewing and reviewing images of fashion, pages 185–199,
     Control, Automation, Robotics and Vision (ICARCV), pages
                                                                                2008.
     1721–1726, 2018.
                                                                           [19] O. Russakovsky, J. Deng, H. Su, J. Krause, S. Satheesh, S.
 [2] Z. Al-Halah and K. Grauman. From Paris to Berlin: Discov-                  Ma, Z. Huang, A. Karpathy, A. Khosla, M. Bernstein, A. C.
     ering fashion style influences around the world. In Proceed-               Berg, and L. Fei-Fei. Imagenet large scale visual recognition
     ings of the IEEE/CVF Conference on Computer Vision and                     challenge. International Journal of Computer Vision (IJCV),
     Pattern Recognition, pages 10136–10145, 2020.                              115(3):211–252, 2015.
 [3] Z. Al-Halah, R. Stiefelhagen, and K. Grauman. Fashion for-            [20] E. S. Silva, H. Hassani, D. Ø. Madsen , and L. Gee. Forecast-
     ward: Forecasting visual style in fashion. In Proceedings                  ing fashion consumer behaviour using google trends. Social
     of the IEEE International Conference on Computer Vision,                   Sciences, 8(4):1–23, 2019.
     pages 388–397, 2017.
                                                                           [21] E. Simo-Serra, S. Fidler, F. Moreno-Noguer, and R. Urta-
 [4] Bunka Gakuen Bunka Publishing Bureau and Bunka Gakuen                      sun. Neuroaesthetics in fashion: Modeling the perception of
     University Textbook Department, editors. Fashion Dictio-                   fashionability. In 2015 IEEE Conference on Computer Vision
     nary. Bunka gakuen Bunka Publishing Bureau, 1993.                          and Pattern Recognition (CVPR), pages 869–877, 2015.
 [5] K. Chen, K. Chen, P. Cong, W. H. Hsu, and J. Luo. Who are             [22] H. Simonyan and A. Zisserman. Very deep convolutional
     the devils wearing Prada in New York city? In Proceedings                  networks for large-scale image recognition. arXiv preprint
     of the 23rd ACM International Conference on Multimedia,                    arXiv:1409.1556, 2014.
     MM ’15, page 177180, New York, NY, USA, 2015. Associ-
                                                                           [23] C. Szegedy, S. Ioffe, V. Vanhoucke, and A. A. Alemi.
     ation for Computing Machinery.
                                                                                Inception-v4, inception-resnet and the impact of residual
 [6] F. Chollet. Xception: Deep learning with depthwise sepa-                   connections on learning. In Proceedings of the Thirty-First
     rable convolutions. In 2017 IEEE Conference on Computer                    AAAI Conference on Artificial Intelligence, AAAI’17, page
     Vision and Pattern Recognition (CVPR), pages 1800–1807,                    42784284. AAAI Press, 2017.
     2017.                                                                 [24] H. Tajfel. An integrative theory of intergroup-conflict. The
 [7] S. Dhanorkar. 8 unusual indicators to gauge economic health                social psychology of intergroup relations, 1979.
     around the world. The Economic Times, Apr 2015.                       [25] M. Takagi, E. Simo-Serra, S. Iizuka, and H. Ishikawa. What
 [8] N. Fujimura and L. Bauerova. Recession can’t slow Uniqlo.                  makes a style: Experimental analysis of fashion prediction.
     The Japan Times, Oct 2009.                                                 In 2017 IEEE International Conference on Computer Vision
 [9] K. He, X. Zhang, S. Ren, and J. Sun. Deep residual learning                Workshops (ICCVW), pages 2247–2253, 2017.
     for image recognition. In 2016 IEEE Conference on Com-                [26] S. Vittayakorn, A. C. Berg, and T. L. Berg. When was that
     puter Vision and Pattern Recognition (CVPR), pages 770–                    made? In 2017 IEEE Winter Conference on Applications of
     778, 2016.                                                                 Computer Vision (WACV), pages 715–724, 2017.
[10] C. S. Hemphill and J. Suk. The law, culture, and economics            [27] S. Vittayakorn, K. Yamaguchi, A. C. Berg, and T. L. Berg.
     of fashion. Stanford Law Review, 61, 2008.                                 Runway to realway: Visual analysis of fashion. In 2015
[11] Y. Kawamura. Japanese teens as producers of street fashion.                IEEE Winter Conference on Applications of Computer Vi-
     Current Sociology, 54(4):784–801, 2006.                                    sion, pages 951–958, 2015.
[12] M. H. Kiapour, K. Yamaguchi, A. C. Berg, and T. L. Berg.              [28] K. Yamaguchi, M. H. Kiapour, L. E. Ortiz, and T. L. Berg.
     Hipster wars: Discovering elements of fashion styles. In                   Parsing clothing in fashion photographs. In 2012 IEEE Con-
     European Conference on Computer Vision, pages 472–488.                     ference on Computer Vision and Pattern Recognition, pages
     Springer, 2014.                                                            3570–3577, 2012.
[13] A. L. Kroeber. On the principle of order in civilization as ex-       [29] S. Yoshimura. The Fashion Logos. Senken Shinbun Co.,
     emplified by changes of fashion. American Anthropologist,                  Ltd., 2019.
     21(3):235–263, 1919.                                                  [30] C. Zhe, H. Gines, S. Tomas, S. Wei, and Y. Sheikh. Open-
[14] R. A. Lancioni. A brief note on the history of fashion.                    pose: Realtime multi-person 2D pose estimation using part
     Journal of the Academy of Marketing Science, 1(2):128–131,                 affinity fields. CoRR, abs/1812.08008, 2018.
     1973.
[15] Z. Liu, P. Luo, S. Qiu, X. Wang, and X. Tang. Deepfashion:
     Powering robust clothes recognition and retrieval with rich
     annotations. In 2016 IEEE Conference on Computer Vision
     and Pattern Recognition (CVPR), pages 1096–1104, 2016.
[16] K. Matzen, K. Bala, and N. Snavely. Streetstyle: Exploring
     world-wide clothing styles from millions of photos. CoRR,
     abs/1706.01869, 2017.

                                                                       9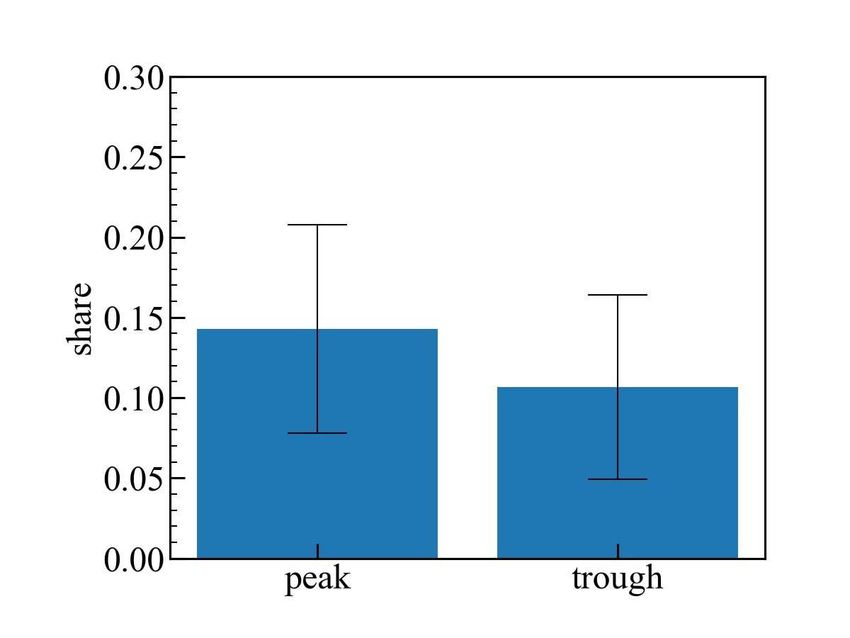
You can also read