CELL LINEAGE ANALYSIS IN HUMANS - From Department of Cell and Molecular Biology Karolinska Institutet, Stockholm, Sweden - KI Open Archive
←
→
Page content transcription
If your browser does not render page correctly, please read the page content below
From Department of Cell and Molecular Biology
      Karolinska Institutet, Stockholm, Sweden

CELL LINEAGE ANALYSIS IN HUMANS

                    Joanna Hård

                  Stockholm 2021
All previously published papers were reproduced with permission from the publisher.
Published by Karolinska Institutet.
Printed by Universitetsservice US-AB, 2021
© Joanna Hård, 2021
ISBN 978-91-8016-301-9

Cell lineage analysis in humans
THESIS FOR DOCTORAL DEGREE (Ph.D)

By

Joanna Hård

The thesis will be defended in public at Nils Ringertz, Floor 3, Biomedicum, Karolinska
Institutet, Solnavägen 9, 171 65 Solna. August 20th 2021.

Principal Supervisor:                          Opponent:
Professor Jonas Frisén                         Professor Johan Jakobsson
Karolinska Institutet                          Lund University
Department of Cell and Molecular Biology       Wallenberg Neuroscience Center
                                               Lund Stem Cell Center
Co-supervisor:
Professor Per-Olof Berggren                  Examination Board:
Karolinska Institutet                        Professor Karin Loré
Department of Molecular Medicine and Surgery Karolinska Institutet
                                             K2 Department of Medicine, Solna

                                               Professor Anna Wedell
                                               Karolinska Institutet
                                               Department of Molecular Medicine and Surgery

                                               Professor Henrik Boström
                                               Royal Institute of Technology, KTH
                                               Division of Software and Computer Systems
To my friends and family
ABSTRACT
Delineating a cell’s history, where it came from and what has happened to it, can provide
clues as to how tissues and organs are formed and function in the healthy state and in
disease. The gold standard for tracing the relationships between cells and their progeny, is
performed through prospective labeling with dyes or genetics tags. In this procedure,
individual cells are labeled in order to track their clonal progeny at a later time point. These
methodologies are, however, not applicable to study the composition of cell lineages in
humans. Recently, the development of technologies for single cell sequencing has opened
up the possibility to infer cell lineage relationships through the analysis of naturally
occurring somatic mutations. During normal cell division, some new random mutations
occur, forming an evolving barcode, which carries information about its developmental
relationship to other cells. As such, the history of a cell is written in its genome, and every
acquired mutation gets passed on to daughter cells. Shared somatic mutations may thus be
used to trace backward across cell lineages, and the life history of an organism.

The goal of this thesis is to explore the possibility of using genetic variation as cell lineage
marks to compute the evolutionary history of human cells as they divide. This work
involves the development of new experimental and analytical methods, and the application
of these to study the origins and lineage relationships of human cell populations. The
methods and results described here, are intended to provide a contribution towards future
applications for cell lineage tracing in man.
LIST OF SCIENTIFIC PAPERS

 I. Mikael Rydén*, Mehmet Uzunel*, Joanna Hård*, Erik Borgström, Jeff E
    Mold, Erik Arner, Niklas Mejhert, Daniel P Andersson, Yvonne Widlund,
    Moustapha Hassan, Christina V Jones, Kirsty L Spalding, Britt-Marie
    Svahn, Afshin Ahmadian, Jonas Frisén, Samuel Bernard, Jonas Mattsson,
    Peter Arner. Transplanted bone marrow derived cells contribute to human
    adipogenesis. Cell Metabolism. 2015;22(3):408-17.

II. Joanna Hård*, Ezeddin Al Hakim*, Marie Kindblom*, Åsa K. Björklund,
    Bengt Sennblad, Ilke Demirci, Marta Paterlini, Pedro Reu, Erik Borgström,
    Patrik L. Ståhl, Jakob Michaelsson, Jeff E. Mold and Jonas Frisén. Conbase:
    a software for unsupervised discovery of somatic mutations in single cells
    through read phasing. Genome Biology. 2019;20(1):68.

III. Joanna Hård, Jeff Mold, Carl-Johan Eriksson, Pietro Berkes, Åsa
     Björklund, Bengt Sennblad, Jack Kuipers, Katharina Jahn, Jakob
     Michaelsson, Jonas Frisén. Human memory and effector CD8 T cell
     development after vaccination. Manuscript.

    *
        Co-first authors
CONTENTS
1 Introduction............................................................................................................ 1
1.1 Life is composed of cellular hierarchies ........................................................ 1
1.2 Tracing lines of succession ........................................................................... 2
1.3 Towards lineage tracing in humans ............................................................... 5
1.3.1 Nuclear genomic mutations ............................................................... 6
1.3.2 Mitochondrial mutations .................................................................... 8
1.4 Single cell sequencing................................................................................. 10
1.4.1 Single cell DNA sequencing ............................................................ 10
1.4.2 Single cell RNA sequencing ............................................................ 12
1.5 Computational methods .............................................................................. 13
1.5.1 Alignment and variant calling .......................................................... 13
1.5.2 Mutation discovery in nuclear DNA ................................................ 14
1.5.3 Phylogenomics ................................................................................ 16
1.5.4 Cell lineage reconstruction based on mitochondrial mutations ......... 17
2 Present investigation ..............................................................................................19
2.1 General aims ............................................................................................... 19
2.2 Specific aims .............................................................................................. 19
2.3 Paper I ........................................................................................................ 20
2.4 Paper II ....................................................................................................... 22
2.5 Paper III...................................................................................................... 24
3 Summary and perspectives.....................................................................................27
4 Acknowledgement.................................................................................................29
5 References ............................................................................................................31
1LIST OF ABBREVIATIONS
CNV Copy number variation
DNA Deoxyribonucleic acid
L1 Long interspersed nuclear element 1
MDA Multiple displacement amplification
mtDNA Mitochondrial DNA
PCR Polymerase chain reaction
RNA Ribonucleic acid
scATACseq Single cell assay for transposase-accessible chromatin
high-throughput sequencing
scRNAseq Single cell RNA sequencing
SNV Single nucleotide variant
TCR T cell receptor
WGA Whole genome amplification
WTA Whole transcriptome amplification
21 INTRODUCTION
1.1 LIFE IS COMPOSED OF CELLULAR HIERARCHIES
Human life begins with a single fertilized egg cell which, upon numerous divisions gives
rise to daughter cells that differentiate and ultimately form an entire organism. All
information required for becoming a human being is stored within the genome of the
fertilized egg cell. The genome consist of a set of chromosomes made up of the organic
chemical deoxyribonucleic acid (DNA). DNA is inherited from the parents and will be
copied and passed on to daughter cells each time a cell divides. The hereditary information
in the DNA is encoded by a sequence consisting of combinations of four chemical bases,
that together with a sugar molecule and a phosphate form individual units called
nucleotides. The nucleotides are organized into two linear strands that together form a
double helix, and the molecules made by cells are encoded in the nucleotide sequence
within genes, which represent distinct regions of the genome. Signals within the cell and
from other cells, both spatially close as well as cells far away, will result in that genes are
transcribed into a similar type of molecule known as ribonucleic acid (RNA) which, in turn,
is translated into proteins that carry out the functions of the cell.
Minor differences between cells, manifested by complex networks of protein interactions,
will influence gene expression and make cells acquire characteristics that distinguish them
from others. This may be sufficient to set even neighboring cells into dramatically distinct
developmental paths. During the early stages of the embryo development, it is widely
believed that all cells retain the potential to become any cell type in the body. These are
multipotent stem cells, defined by their ability to self-renew as well as generating progeny
of different types (Gage 2000). One goal in developmental biology is to chart the structure
of this process, often depicted as a tree consisting of cell lineages that contribute to the
formation of tissues and organs (Laurenti and Gottgens 2018).
As development proceeds, the plasticity of stem cells gradually diminishes (Laurenti and
Gottgens 2018). During development, many organs are seeded with cells that later in life
will function as adult stem cells with a restricted ability to generate only the types of cells
that are specific for the tissue in which they reside. The role of adult stem cells is to
maintain tissue homeostasis, by replacing worn-out and damaged cells (Post and Clevers
2019). One goal in stem cell research and regenerative medicine involves the
characterization of cell lineages that are formed in the adult. It is essential to understand
how these complex processes are orchestrated since impaired tissue regeneration may result
in a variety of diseases for which there are limited or no currently available treatments,
including for example cancer, neurodegenerative disease, diabetes mellitus and traumatic
injuries. A major focus is directed towards the identification of cells with the capacity to
1replace others, including adult stem cells, since these may be targeted for enhancing the regenerative potential of the human body. For example, established therapies for stimulating blood cell production for the treatment of hematological malignancies are available (Richard and Schuster 2002). Future therapeutic applications for regenerative medicine may achieve cell replacement also in other organs (Spalding, Bhardwaj et al. 2005). An essential step towards reaching this goal involves the identification of the origins of new cells and characterization of the composition of cell lineages in humans. 1.2 TRACING LINES OF SUCCESSION The first description of cells dates back to 1665, from the book ‘Micrographia’ (Hooke 1665). Its author, Robert Hooke, examined cork and wood under a microscope and observed that the tissues were composed of structurally organized microscopical units which reminded him of the tiny rooms, or cellula, where monks lived. At the end of the 19th century, improved developments of light microscopy made it possible to obtain a more detailed view of the life of cells than what had previously been possible. By directly observing the behavior of cells as an organism develops, scientists discovered that new cells arise from pre-existing cells. By drawing maps of how one cell gives rise to two daughter cells, which in turn give rise to cell lineages, these early investigations demonstrated that cells had distinct fates and played specific roles in later development (Whitman 1887, Whitman 1887, Conklin 1905, Kretzschmar and Watt 2012). The realization that cell division results in cell lineages, which in turn contribute to the formation and maintenance of an organism, sparked an era of innovations aimed at providing tools to map the contribution of distinct lineages in tissues and to identify the cellular origins of these. Methods for cell lineage tracing aim to investigate the ancestry of cells that compose a multi-cellular organism. Cell lineage analysis can be facilitated by tracking a marker that distinguishes a cell lineage from other cells in a tissue. In the 1920s, embryologist Walter Vogt performed a pioneering experiment where a colored substrate was introduced into individual cells of a developing embryo of the frog species Xenopus (Buckingham and Meilhac 2011, Kretzschmar and Watt 2012). This was done by placing a tiny agar chip containing the dye on top of the developing embryo, and cells present directly below the chip absorbed the dye into their cytoplasm. When the labeled cells divided, the dye would be transmitted to the daughter cells, and Vogt could thus track the progeny of the cell which were originally labeled. Using this strategy, Vogt performed a series of experiments in which individual cell lineages were labeled and tracked, which allowed him to observe how the 32-cell blastula Xenopus embryo was formed (Hsu 2015). One drawback with this technique was that the dye was diluted with every cell division, resulting in that the signal was lost after a certain number of divisions. In the 1980s Sulston and colleagues managed to reconstruct a ‘fate map’ of the entire cell lineage of the nematode Caenorhabditis elegans, by manually 2
tracking and annotating dividing cells observed through a microscope (Sulston,
Schierenberg et al. 1983). While this experiment represents a milestone in the lineage
tracing field, direct observation is laborious and limited to small transparent organisms
(Garcia-Marques, Espinosa-Medina et al. 2021).

To trace the progeny of cells in species with a larger number of cells, transplantation was
used to generate chimeric animals. This enabled Spemann and Mangold to track donor cells
in differentially pigmented newt species (Garcia-Marques, Espinosa-Medina et al. 2021).
Another example involves the generation of chimeras of different species. In the 1970s,
Nicole Le Douarin generated chick-quail chimeras to study the migration patterns and
differentiation potential of neural crest cells. When transplanting quail cells into chicken
embryos, quail-derived cells will be integrated into the developing tissues of the host
chicken. Upon examination of the tissues by light microscopy, quail-derived cells could be
distinguished from chicken-derived cells by staining the tissue with Feulgen DNA dye,
which labels DNA in quail cells but not in chicken. The information obtained from these
analyses demonstrated a remarkable migratory capacity of neural crest cells (Le Douarin
1973, Le Douarin and Teillet 1973)

One of the most notable studies taking advantage of transplantation to trace cell lineage was
published by Weissmann and colleagues in 1988 (Spangrude, Heimfeld et al. 1988). In this
experiment, a specific population of bone marrow cells was isolated from a mouse. The
authors next set out to test whether the isolated cell population represented hematopoietic
stem cells. This was done by transplanting the isolated cells into recipient mice subjected to
lethal irradiation and observing whether the graft could produce blood cell progeny. Since
the transplanted cells were able to reconstitute all blood cell types and promote long-term
survival of recipient mice, the authors demonstrated that the isolated cell population should
comprise hematopoietic stem cells. This study demonstrates the definition of adult stem
cells, in their ability to self-renew and to generate progeny representing multiple cell types.
Their work also sparked a large number of studies that focus on identifying and
characterizing the role of stem cells in adult tissues (Spangrude, Heimfeld et al. 1988, Hsu
2015).

Related to the work on characterizing the plasticity of bone marrow-derived cells, Diane
Krause and colleagues were able to track the progeny of a single transplanted bone marrow-
derived cell from a male mouse through a series of transplantations into female recipient
mice (Krause, Theise et al. 2001). This was made possible since male cells can be
distinguished from female cells, based on the presence of a Y chromosome. Following
transplantation, the tissues of the recipient mice were examined by microscopy analysis. In
line with previous studies (Spangrude, Heimfeld et al. 1988), the transplanted female mice
harbored blood cells containing a Y chromosome, demonstrating a donor-derived origin of
these cells. Besides observing male donor-derived blood cells, the authors made the
surprising discovery that donor-derived male DNA was also present in many non-

                                                                                             3
hematopoietic tissues. The authors concluded that bone-marrow-derived cells have far more plasticity than previously thought, with an ability to differentiate into epithelial cells of diverse tissues, including for example the liver, lung, gastrointestinal tract, and skin (Krause, Theise et al. 2001). This finding would be of tremendous clinical importance, since it implies that the transplanted bone-marrow-derived cells were multipotent, with a capacity to give rise to many different cell types. Such cells could potentially be exploited to treat not only hematological malignancies but could also be targeted for the development of clinical treatments for genetic disease or tissue repair in non-hematopoietic organs (Krause, Theise et al. 2001). However, subsequent studies revealed an alternative explanation for the presence of donor- derived DNA in non-hematopoietic cells following transplantation. Through detailed genetic analysis, multiple research groups demonstrated that cells containing donor-derived DNA, as determined by the presence of a Y chromosome, also contained recipient DNA. It is today well established that bone marrow-derived cells contribute to non-hematopoietic tissues through a mechanism by which transplanted donor cells fuse with recipient cells (Anderson, Gage et al. 2001, Alvarez-Dolado, Pardal et al. 2003, Vassilopoulos, Wang et al. 2003, Wang, Willenbring et al. 2003, Weimann, Johansson et al. 2003, Johansson, Youssef et al. 2008, Berry and Rodeheffer 2013). This event results in cells harboring genetic material from both the donor and the recipient. The observation that transplanted bone marrow-derived may contribute to non-hematopoietic tissues by cell fusion rather than differentiation, highlights the limitation of transplantation to define stem cells. In addition, it is important to note that cell behavior may be different in the setting of transplantation and under homeostatic conditions (Watt and Jensen 2009, Sun, Ramos et al. 2014). However, transplantation remains useful for studying for example migratory behavior and differentiation potential when cells are moved into a different tissue environment, as well as the use of xenografts allowing for analysis of the behavior of human cells in experimental animals (Garcia-Marques, Espinosa-Medina et al. 2021). In some instances, transplantation may be the only option to study cell fate. In Paper I, we investigated if bone marrow- derived cells could form adipocytes in human study subjects that had previously undergone a bone marrow- or peripheral blood stem cell transplantation. This experimental setup was selected due to the lack of available methodologies to trace the cellular origins of adipocytes in humans. To distinguish between cell fusion events and differentiation, we investigated the presence of polymorphic markers in donor and recipient-derived DNA in individual adipocytes in transplant recipients. Since the 1990s, the rapid development of genetic tools has transformed lineage tracing methods. This enabled the introduction of inheritable markers into cells, including for example fluorescent proteins and genetic barcodes. The most widely used method for lineage tracing in experimental animals is the Cre-lox system (Orban, Chui et al. 1992, Blanpain and Fuchs 2006, Buckingham and Meilhac 2011, Hope and Bhatia 2011). This method relies on genetically modified mice, in which the expression of the DNA-cutting 4
enzyme Cre can be controlled by a promoter gene that is specifically expressed in a cell
type or tissue of interest. These experimental animals are subsequently crossed with other
experimental animals that carry a fluorescent reporter gene that is expressed after activation
by Cre. Since the expression of the reporter gene is inherited by daughter cells, this enables
the tracking of migration, proliferation, and differentiation of specific cell types in vivo.
The activity of Cre can furthermore be dynamically regulated by using external stimuli,
including for example the estrogen analog Tamoxifen, and the induction of labeling of cells
will only occur when Tamoxifen is applied (Metzger and Chambon 2001, Hsu 2015).

To increase the resolution in lineage tracing, ‘brainbow’ or ‘confetti’ mice were developed
(Livet, Weissman et al. 2007). In these mice, Cre activation induces expression of a random
set of fluorescent proteins which endows individual cells with different colors. This strategy
has, for example, been used to demonstrate that intestinal crypts are monoclonal and to
study developmental bias in mouse embryonic stem cells (Snippert, van der Flier et al.
2010, Tabansky, Lenarcic et al. 2013). Due to a restricted number of colors available to
label cells, and a limited number of lasers to detect the fluorescent signals, these
methodologies are limited by the number of founder cells that can be uniquely labeled.

To further increase the resolution of lineage tracing, contemporary methods take advantage
of recent advances in genome engineering technologies and single cell sequencing. This
allows for high throughput analyses of clonal dynamics within cell populations. This is
done by introducing genomic modifications in the DNA of individual cells, using genome-
editing technologies, such as the CRISPR–Cas9 system (Hsu, Lander et al. 2014). The
introduced mutations can subsequently be discovered in the individual cells by DNA
sequencing, which is the process of determining the order of nucleotides in the genetic
code. Since daughter cells inherit the genome of their ancestors, cell lineage relationships
can be reconstructed based on shared mutations.

1.3   TOWARDS LINEAGE TRACING IN HUMANS

Single cell sequencing has also opened up the possibility of inferring cell lineage
relationships in humans. This can be done through analysis of the inheritance patterns of
naturally occurring somatic mutations. Similar to the strategy of introducing mutations in
experimental animals as described above, naturally occurring somatic mutations label the
progeny of the cell in which it occurred (Figure 1).

Somatic mutations are alterations in the nucleotide sequence of the DNA, and may arise
from DNA damage repair, DNA replication and mitosis (Zhang and Vijg 2018). Somatic
variation may arise early in development or occur later in life. As such, somatic mutations
are distinguished from germline mutations, which are present in the DNA of every cell
since these were inherited from the parents. Somatic variation may vary from very large

                                                                                            5
chromosomal aberrations and copy number variation (CNV) to smaller insertions, deletions and substitutions of nucleotides in the genetic code (Zhang and Vijg 2018). Somatic variation is generally considered to be a hallmark of disease, including cancer (Negrini, Gorgoulis et al. 2010), and in aging (Lopez-Otin, Blasco et al. 2013, Zhang and Vijg 2018). However, mutations frequently arise in genomic regions which do not contain genes and may not have a functional effect on the cell (Woodworth, Girskis et al. 2017, Zhang and Vijg 2018). Importantly, since somatic mutations are passed on to daughter cells, the patterns of somatic mutations will mirror cells’ hierarchical relationships. Owing to advances in single cell genome sequencing, it is today possible to identify these natural lineage markers, and the genealogy of cells can be inferred by retrospectively deciphering the order of mutations that accumulate in cells as they divide (Lodato, Woodworth et al. 2015). Figure 1. Somatic mutations, depicted as a star, arise in the genome of individual cells and are passed on to daughter cells during cell division. The lineage relationships of cells can be inferred by tracking the inheritance patterns of such mutations. 1.3.1 Nuclear genomic mutations The first attempts to reconstruct cell lineage relationships based on somatic mutations were performed by two independent research groups that focused on areas of the genome with high mutation burden (Frumkin, Wasserstrom et al. 2005, Salipante and Horwitz 2006). These studies focused on microsatellites, which are repetitive stretches of DNA consisting of one or more base pairs that are repeated multiple times (Richard, Kerrest et al. 2008, Gulcher 2012). Due to the repetitive structure of microsatellites, these are prone to be altered when DNA is replicated prior to cell division. The errors result in an increase or decrease in length, which makes microsatellites variable between individuals and within individuals (Ellegren 2004). Owing to the instability of microsatellite repeats, these have been predicted to enable the reconstruction of the entire cell lineage tree of an organism by using computational methods for phylogenetic inference (Frumkin, Wasserstrom et al. 2005, Salipante and Horwitz 2006). 6
CNVs are genetic traits involving the number of copies of a particular genomic segment.
These may range from 1 kilobase to several megabases in size (Zhang and Vijg 2018).
CNVs are estimated to account for 12% of the human genome (Redon, Ishikawa et al.
2006). Interestingly, several groups have revealed extensive CNV between different cells in
the same individual, which must have arisen as somatic events post-fertilization
(Piotrowski, Bruder et al. 2008, Abyzov, Mariani et al. 2012, McConnell, Lindberg et al.
2013). CNV analysis in skin and brain has shown that a large proportion, 30-70% of skin
cells and neurons harbor at least one large somatic CNV (Woodworth, Girskis et al. 2017).
However, only a small number of CNVs have been found to be shared by multiple cells
(Woodworth, Girskis et al. 2017).

Endogenous retroelements are a type of genetic component with the capability to move, or
transpose. This occurs through a mechanism by which a DNA sequence is copied or cut out
and then pasted into another location in the genome (Goodier 2016). Since somatic
mobilization of retroelements, in particular long interspersed nuclear element 1 (L1), has
been observed in humans (Woodworth, Girskis et al. 2017, Faulkner and Billon 2018),
these could potentially be an interesting target for cell lineage reconstruction purposes.
However, while retrotransposons are estimated to constitute approximately 40% of the
human genome (Zhang and Vijg 2018), only a small number of these elements are actively
mobilizing (Woodworth, Girskis et al. 2017) . Using available technologies it appears
challenging to distinguish true L1 elements from false positives, leaving room for
controversy with regards to the precise rate of L1 mobility (Evrony, Cai et al. 2012, Upton,
Gerhardt et al. 2015).

Single nucleotide variants (SNVs) are substitutions of individual nucleotides in the genetic
code. SNVs are considered to be major drivers of evolution and a major source for disease-
causing mutations (Woodworth, Girskis et al. 2017). Since the vast majority of the genome
is non-coding, SNVs are frequently occurring in regions that may not have a functional
impact on the cell (Woodworth, Girskis et al. 2017). Estimations of the substitution rate
range from 2 to 10 mutations per division (Lynch 2010, Martincorena and Campbell 2015,
Woodworth, Girskis et al. 2017, Dou, Gold et al. 2018). Although the division rate of stem
cells in adult tissues has been difficult to estimate and may vary widely between tissues,
(Tomasetti and Vogelstein 2015), normal cells are expected to acquire hundreds to
thousands of SNVs (Martincorena and Campbell 2015). Given their abundance and often
neutral functionality, somatic SNVs represent a substantial source of genetic variation
which can be utilized for cell lineage reconstruction (Woodworth, Girskis et al. 2017).
Indeed, multiple reports have utilized somatic SNVs to reconstruct cell lineages in multiple
organs in both the mouse and in humans, including stomach, intestine, prostate, brain,
immune system, and liver (Behjati, Huch et al. 2014, Lodato, Woodworth et al. 2015,
Hazen, Faust et al. 2016, Woodworth, Girskis et al. 2017, Lee-Six, Obro et al. 2018,
Lodato, Rodin et al. 2018, Brunner, Roberts et al. 2019, Lee-Six, Olafsson et al. 2019).

                                                                                          7
While these initial attempts for lineage tracing in humans have relied on the detection of somatic variation in nuclear genomic DNA, these analyses typically require sequencing of the entire genome or the exome, which is the part of the genome containing genes. However, whole genome sequencing and exome sequencing remains costly and is difficult to apply at scale. In addition, single cell DNA sequencing data, is limited in that it does not provide information about the functions and identity of individual cells which, for example, can be obtained from gene expression analysis. 1.3.2 Mitochondrial mutations Multiple reports have demonstrated the utility of mitochondrial mutations as cell lineage marks in the last decade, including recent reports demonstrating the feasibility of identifying mitochondrial variation at the single cell level (Taylor, Barron et al. 2003, Teixeira, Nadarajan et al. 2013, Walther and Alison 2016, Salas, Wiencke et al. 2018, Ludwig, Lareau et al. 2019, Xu, Nuno et al. 2019). A major advantage with targeting mitochondrial variation for cell lineage analysis approaches is that these can be detected by existing methods for single cell sequencing which also records information about the functions and identities of individual cells defined by their gene expression and epigenomic profiles. Such methodologies for data generation include single cell assay for transposase- accessible chromatin high-throughput sequencing (scATACseq) and single cell RNA sequencing (scRNAseq) (Ludwig, Lareau et al. 2019). Mitochondria contain their own small genome, representing a 16.6kb-long circular DNA molecule that is transcribed in almost its entirety. The genes transcribed from the mitochondrial genome code for proteins that form the mitochondrial respiratory chain, which produces much of the chemical energy needed for the biochemical reactions occurring in a cell. Given the small genome size, it remains cost-effective to perform sequencing of mitochondrial DNA (mtDNA). Each cell has multiple copies of mtDNA, with estimates ranging from 100-1000s per cell (Ludwig, Lareau et al. 2019). Mutations arise in individual mtDNA molecules and accumulate throughout human life (Wallace 1992). The mutation rate in mitochondrial genome is estimated to be substantially higher than for nuclear genomic DNA (Payne and Chinnery 2015, Ludwig, Lareau et al. 2019). Over time, the proportion of mtDNA molecules that harbor a specific mutation may increase in individual cells. Mitochondrial mutations can reach high levels of heteroplasmy, which is the fraction of mutated mitochondrial genomes within a cell (Ludwig, Lareau et al. 2019). Such increase in heteroplasmy of a particular mutation has been proposed to be the result of the combination of random genetic drift, constant turnover of mtDNA that is independent of cell division, and vegetative segregation (Figure 2) (Elson, Samuels et al. 2001, Wallace and Chalkia 8
2013, Stewart and Chinnery 2015). Although, many mutations in mtDNA are expected to
have a neutral effect since cells can tolerate >80% heteroplasmy of pathogenic variants
before defects in the respiratory chains are detected (Stewart and Chinnery 2015).

Figure 2. Each cell has multiple mitochondria. Each mitochondrion has multiple mtDNA
molecules. Somatic mutations can arise in individual mtDNA and can reach high levels of
heteroplasmy over time. Mutated mtDNA is inherited by daughter cells during cell division.

                                                                                         9
1.4 SINGLE CELL SEQUENCING Identifying somatic mutations can be achieved by determining the order of nucleotides in the genetic code using DNA sequencing technologies, followed by computational analysis aiming to identify genomic locations where more than one nucleotide is observed. Since conventional methods for DNA sequencing are performed on a mixed population of cells, signals from rare somatic mutations will be concealed within the aggregated bulk data (Lahnemann, Koster et al. 2020). It is therefore very challenging to identify somatic mutations using such bulk sequencing approaches. To circumvent this issue, new technologies for single-cell sequencing attempts to obtain information about the genetic code in DNA or RNA from individual cells. The advantage of this approach is that somatic mutations present in only a subset of cells can be detected. 1.4.1 Single cell DNA sequencing The amount of DNA present in a single cell is far from sufficient for performing a sequencing experiment. To obtain sufficient genetic material, single cells can be expanded in culture until there are enough cells to perform standard bulk sequencing (Welch, Ley et al. 2012, Behjati, Huch et al. 2014, Blokzijl, de Ligt et al. 2016, Hazen, Faust et al. 2016). However, during the culturing process, new mutations arise which may be challenging to distinguish from biologically relevant mutations present only in the founder cell (Dou, Gold et al. 2018). In addition, it is not always possible to obtain clonal colonies from single cells, which may result in biased cell loss (Dou, Gold et al. 2018). Moreover, culturing is not applicable for many cell types, including terminally differentiated post-mitotic cells such as neurons. A recently developed method demonstrates clonal expansion of neurons by single- cell nuclear transfer (SCNT) into dividing cells (Mizutani, Oikawa et al. 2015). However, SCNT requires substantial manual work and has been proposed to be associated with additional selection biases (Dou, Gold et al. 2018). Another common approach to produce sufficient amounts of DNA for sequencing is to apply Whole Genome Amplification (WGA) which can generate micrograms of amplified DNA from the minute amounts of DNA present in a single cell. However, the WGA process introduces errors when the DNA is amplified. Such errors may be falsely interpreted as somatic mutations (Dou, Gold et al. 2018). Healthy, non-malignant cells are expected to be diploid, meaning that only two DNA molecules, - alleles -, exist at each locus. Every molecule that fails to be amplified inevitably leads to missing data. This effect, termed amplification bias, is represented by successful amplification in some genomic regions and failed amplification in other regions (Figure 3) (Dou, Gold et al. 2018, Lahnemann, Koster et al. 2020). Furthermore, amplification bias may lead to the scenario where only one of the two alleles was successfully amplified. This feature of single cell data, called allelic dropout, is particularly problematic since the failure to detect mutation 10
signals may result in false negative variant calls. Multiple methodologies for WGA exist,
each with a different error profile. It is important to recognize these differences, since
certain WGA technologies may be optimal depending on the research question and genetic
variation of interest (Lahnemann, Koster et al. 2020).

The polymerase chain reaction (PCR) is a widely used tool for amplifying specific regions
in the genome (Saiki, Scharf et al. 1985, Mullis and Faloona 1987). PCR works by first
heating the double-stranded DNA in order to obtain two single strands. Next, an enzyme
called DNA polymerase builds two new strands using the original strands as templates. The
initiation of DNA synthesis is determined by primers, which are short single-stranded
nucleic acid sequences that bind to different targets in the DNA. Based on PCR, the first
approach for amplifying the human genome was developed in the 1980s (Nelson, Ledbetter
et al. 1989, Czyz, Kirsch et al. 2015). Several types of methods for WGA based on PCR
have been developed since then (Telenius, Carter et al. 1992, Zhang, Cui et al. 1992,
Sermon, Lissens et al. 1996, Dietmaier, Hartmann et al. 1999, Langmore 2002). PCR-based
strategies for WGA rely on thermostable polymerases since the reaction is carried out under
increasing and decreasing temperatures, in a cycling manner. Therefore, PCR-based
strategies for WGA rely on thermostable polymerases, in order to remain stable during the
maximum temperature reached during PCR cycling. However, all thermostable
polymerases have relatively high error rates, which makes PCR-based approaches
suboptimal for SNV detection (Lahnemann, Koster et al. 2020). An advantage of PCR-
based approaches for WGS is that these achieve the most uniform coverage, and are
therefore suitable for CNV analysis (Woodworth, Girskis et al. 2017).

Multiple displacement amplification (MDA) is a non-PCR-based method for WGA (Dean,
Hosono et al. 2002). MDA can amplify the few femtograms of DNA found within a single
bacterium to microgram amounts of material that can be readily used for sequencing. In
MDA, DNA is amplified at a constant temperature using the enzyme phi29 DNA
polymerase which has a proofreading activity and therefore delivers 1000-fold higher
fidelity as compared to thermostable DNA polymerase (Tindall and Kunkel 1988, Esteban,
Salas et al. 1993). Given the high fidelity of phi29 DNA polymerase, MDA is the method
of choice for SNV calling (Woodworth, Girskis et al. 2017, Lahnemann, Koster et al.
2020), and was therefore used for WGA in Paper II in this thesis. One disadvantage with
MDA is that this method suffers from stronger amplification bias as compared to PCR-
based technologies (Picher, Budeus et al. 2016, Baumer, Fisch et al. 2018, Lahnemann,
Koster et al. 2020).

MALBAC utilizes quasi-linear pre-amplification to reduce the amplification bias. The
initial amplification depends on a set of primers consisting of a shared sequencing and a
variable sequence that can bind to DNA even at low temperatures. The DNA is used as a
template for a pre-amplification step that generates hairpin-shaped molecules, which are
subsequently amplified into large quantities of DNA. A conceptually similar technique is

                                                                                        11
the commercial application PicoPlex from Rubicon Genomics which was used for single cell WGA in Paper I in this thesis. 1.4.2 Single cell RNA sequencing The behavior and function of a cell are determined by the genes it expresses. As such, sequencing of the RNA in individual single cells can provide information about the current state of a cell. Moreover, this can enable the identification of subpopulations of cells with distinct biological functions, both in the healthy state and in disease (Sandberg 2014, Kolodziejczyk, Kim et al. 2015). In recent years, the development of technologies for scRNAseq has revolutionized biological research, and heterogeneity in cell populations can now be dissected in ways that was previously not possible. Smartseq (Ramskold, Luo et al. 2012) was developed at Karolinska Institutet for whole transcriptome amplification (WTA) and enables the detection of full-length transcripts. Further developments of this technology include smartseq2 (Picelli, Bjorklund et al. 2013) and smartseq3 (Hagemann-Jensen, Ziegenhain et al. 2020), which achieves improved sensitivity and full-length capture. Other methods for WTA include for example Quartz- Seq (Sasagawa, Nikaido et al. 2013) and CEL-seq (Hashimshony, Wagner et al. 2012). The main challenge in WTA is associated with handling the small amounts of RNA present in single cells. To simplify the preparation of transcriptome libraries, several methods based on microfluidics have been developed, including for example Drop-seq (Macosko, Basu et al. 2015) and inDrop (Klein, Mazutis et al. 2015), as well as platforms developed by vendors such as Chromium (10x Genomics), ddSEQ (Bio-Rad/Illumina), and Nadia (Dolomite) (Grun and van Oudenaarden 2015). Other challenges associated with scRNAseq library preparation include sample loss, amplification efficiency and amplification bias. (Kashima, Sakamoto et al. 2020). It is important to consider the differences between scRNAseq technologies in order to select suitable methods depending on the research questions addressed. A key distinction between different methods for scRNAseq is that some methods collect information about the full-length sequence of a transcript whereas others only amplify a set of nucleotides (Haque, Engel et al. 2017). While the latter strategy is sufficient for linking a transcript to a specific gene, full-length sequencing is preferable for mutation discovery. In Paper III, we set out to identify somatic mutations in transcripts originating from the mitochondrial genome, and we therefore used Smartseq2 which enables full-length sequencing (Picelli, Bjorklund et al. 2013). 12
1.5 COMPUTATIONAL METHODS
Both DNA and RNA sequencing is performed by determining, or reading, the order of
nucleotides in the genetic code. In the case of RNA sequencing, RNA molecules are first
converted into DNA molecules, termed cDNA, prior to sequencing (Mortazavi, Williams et
al. 2008). The preparation steps prior to sequencing begin with the extraction of nucleic
acids from cells. This is followed by fragmentation and the construction of a molecular
library consisting of DNA or cDNA fragments. During the sequencing process, molecules
from such libraries will be randomly sampled for sequencing. Each time a DNA molecule is
read by the sequencing machine, a digital copy, termed read, is generated (Osborne, Barnes
et al. 2001). The data in the read consists of the nucleotide sequence in the DNA fragment
that was sequenced.
1.5.1 Alignment and variant calling
The first step of the computational analysis of DNA sequencing data involves sorting the
reads according to the expected order of nucleotides in the human genome. This process,
termed alignment or mapping, can be compared to putting together a giant puzzle where a
vast number of reads are aligned back to the respective regions they likely originate from.
This is done with the help of a reference genome file consisting of approximately 3 billion
nucleotides, and is intended to be representative of the order of nucleotides in the human
genome.
The reference genome file was generated as a result of The Human Genome Project
(Lander, Linton et al. 2001). One driving goal of this effort was to develop a tool that could
aid in future analyses aimed at providing increased knowledge about the human genome
and to accelerate genomics research (Ballouz, Dobin et al. 2019). This has undeniably been
successful since the reference genome is an essential tool for many types of computational
analyses that involves human DNA sequencing data (Ballouz, Dobin et al. 2019). One of
the major discoveries related to this work concerns the extensive presence of repetitive
sequences throughout the human genome. The repetitiveness makes the sequencing
machines introduce errors when reads are generated, and assembling of sequencing reads
into the correct order becomes a computationally challenging problem (Treangen and
Salzberg 2011). Moreover, many genomic regions differ significantly across the human
population, resulting in ambiguities as to the precise location where reads belong in the
genome which, in turn, result in alignment artifacts (Li 2014). This is further complicated
by the fact that the vast majority of the human reference genome is based on DNA obtained
from a single individual and may contain sequences as well as lack sequences that are
present in other individuals (Ballouz, Dobin et al. 2019).
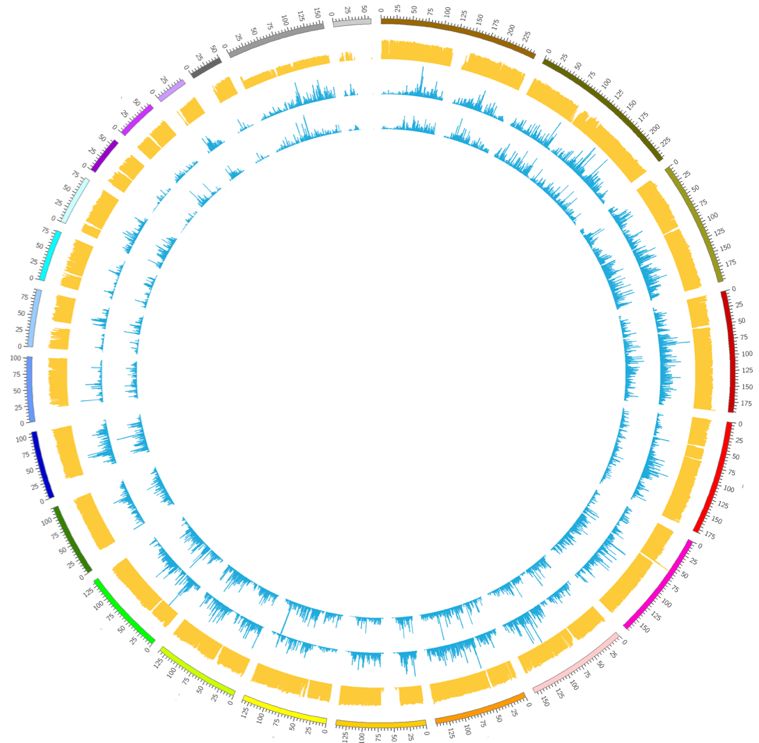
13Genetic variation is detected by variant calling algorithms that take aligned read data as input and outputs positions where there are polymorphisms, defined as genomic location where at least one nucleotide differs from a reference sequence. However, because sequencing data suffer from errors, which include both mistakes introduced during sequencing as well as alignment artifacts, variant calling is difficult and there is often considerable uncertainty associated with the results (Nielsen, Paul et al. 2011). It is crucial to account for this uncertainty in downstream analyses, such as the identification of rare mutations (Nielsen, Paul et al. 2011). 1.5.2 Mutation discovery in nuclear DNA Besides false positive variant calls arising from the sequencing process and alignment, there are a number of issues that are specific for single cell data. Ideally, single cell DNA sequencing data contains information about all types of genetic variation that can be exploited for retrospective cell lineage reconstruction, including for example genomic rearrangements, CNVs, insertions, deletions, and SNVs. However, the extensive amplification of single cell genomes that is required for sequencing, represents a major disturbing factor for identifying somatic mutations at the single cell level. WGA introduces amplification errors, amplification bias, allelic dropout and missing data (Woodworth, Girskis et al. 2017, Zhang and Vijg 2018). This presents serious challenges to computational analysis for the identification of somatic mutations (de Bourcy, Hou Y, Huang L, Estevez-Gomez). Figure 3. Circos plot showing sequencing read coverage in two MDA amplified single cell samples (blue tracks) and one unamplified bulk sample (yellow track). Each track represents a histogram showing the number of reads per genomic location, as indicated by the outer track representing individual chromosomes. The bulk sample displays even coverage across the genome. The single cells display uneven coverage across the genome. 14
In recent years, a number of new algorithms for tackling the unique features of single cell
DNA sequencing data have been developed.
The first SNV variant caller specific for single cell data is Monovar, which handles errors
and biases by leveraging sequencing information across the cell population (Zafar, Wang et
al. 2016). In this process, Monovar predicts the presence or absence of variants in
individual cells based on the posterior probability, which is a revised or updated mutation
probability after considering the mutation profiles in other cells.

Multiple tools take advantage of heterozygous germline SNVs to identify and account for
amplification bias. Germline variants are present in egg or sperm cells and are thus present
in all cells of an organism. Heterozygous loci are positions where the two alleles harbor
different nucleotides. Since the nucleotide differs in these loci, heterozygous germline
SNVs can be used to distinguish reads originating from either of the two alleles of a diploid
cell. SCcaller and SCAN-SNV account for local amplification bias by integrating data from
neighboring heterozygous variants (Dong, Zhang et al. 2017). This assumes that WGA, in
particular MDA, starts at random positions and amplifies long consecutive stretches of
DNA (Dong, Zhang et al. 2017). The degree of local amplification bias in a particular
genomic region can thus be predicted by considering the degree of bias in neighboring
heterozygous SNVs. In Paper II, we propose an approach based on directly linking putative
somatic SNVs to heterozygous germline SNVs. In genomics, this computational strategy is
called phasing, and is typically used to identify patterns of neighboring genetic variation
that is associated with health and disease (Tewhey, Bansal et al. 2011). We and others have
shown read-backed phasing with heterozygous germline SNVs enable increased detection
accuracy of somatic variant discovery and is particularly useful for data exhibiting high
rates of allelic dropout (Dou, Gold et al. 2018, Bohrson, Barton et al. 2019, Hard, Al Hakim
et al. 2019).

Computational tools exist for the analysis of large CNVs in single cells, including Ginkgo
and Aneufinder (Garvin, Aboukhalil et al. 2015, Bakker, Taudt et al. 2016). Ginkgo
analysis is performed directly via a web server, and computes CNV profiles by binning
reads into segments of the genome, followed by analysis of read density in these genomic
intervals (Garvin, Aboukhalil et al. 2015). Aneufinder also predicts CNVs based on
significant difference in read count data, although the statistical methods to predict CNV
profiles differ between Ginkgo and Aneufinder (Bakker, Taudt et al. 2016). In comparative
analyses, Aneufinder and Ginkgo have been shown to generate concordant results in terms
of CNV calls, although Aneufinder achieves better sensitivity for small CNV events while
Ginkgo is more robust for noise in the data (Bakker, Taudt et al. 2016).

                                                                                          15
1.5.3 Phylogenomics The inheritance patterns of somatic variation in single cells can be used to infer the somatic diversification of different lineages of single cells. However, substantial computational challenges are associated with single cell data, which requires the development of new analytical frameworks to model the evolution that occurs within one human being. Such models of evolution may be described by a simple representation of the presence or absence of mutation events, which can be obtained by computational methods for single cell variant calling as described above (Lahnemann, Koster et al. 2020). To dissect clonal relationships, a number of clustering approaches have been developed which aim to identify groups of cells that share somatic mutations (Gawad, Koh et al. 2014, Roth, McPherson et al. 2016). Advantages with clustering methods is that these are easy to implement and fast to execute. One disadvantage with clustering-based approaches is that these rely on a simplified measure of distance considering only pairs of cells. As a consequence, the resulting tree represents a measure of the relatedness between cells but cannot be used for quantitative analysis. Moreover, while clustering methods are fast and straightforward, these may not perform well or fail completely for data that is burdened by errors and biases, which is often the case for single cell data (Kuipers, Jahn et al. 2017). A different direction taken for predicting clonal relationships is based on phylogenetic inference which considers the underlying mechanisms of the evolutionary process as well as technical aspects of the data (Kuipers, Jahn et al. 2017, Lahnemann, Koster et al. 2020). These include probabilistic approaches that select trees based on how well they explain the observed data (Kuipers, Jahn et al. 2017). Traditionally, phylogenetics is used to reconstruct the evolutionary history of species and many methods for phylogenetic inference exist (Kapli, Yang et al. 2020). These methods evaluate observed traits, for example inherited mutations, and outputs a phylogeny, also known as a phylogenetic tree (Lahnemann, Koster et al. 2020). The tips of the tree diagram are called leaves or taxa, and represent the end, or present, of an evolutionary lineage (Yang and Rannala 2012). Such lineage is represented by the branches in the tree, whereas internal nodes represent lineage splitting events (de Queiroz 2013). When applying phylogenetic inference to visualize the clonal evolution of single cells, the leaves represent single cell samples, and the internal nodes represent the hypothetical common ancestors. Tools for single cell phylogenetic inference include OncoNEM (Ross and Markowetz 2016) and SCITE (Jahn, Kuipers et al. 2016), which take binary input of presence or absence of mutations to compute the tree. These methods can handle multiple types of errors, including false negatives, false positives and missing data, assuming that it is more likely to observe false negatives than false positives (Lahnemann, Koster et al. 2020). Both OncoNEM and SCITE assume that data follows the infinite sites model, meaning that a mutation is expected to occur only once. (Kimura 1969). Approaches that allow for violations of the 16
infinite sites assumptions include SiFit (Zafar, Tzen et al. 2019) and SPhyR (El-Kebir
2018). Leveraging the dependency structure among cells in a dataset can also be powerful
for distinguishing true mutations from false positives (Lahnemann, Koster et al. 2020). This
approach has been taken by a number of tools for variant calling and simultaneous
reconstruction of cell lineage trees, including SciCloneFit and sciΦ (Singer, Kuipers et al.
2018, Zafar, Navin et al. 2019).

The key challenges for single cell phylogenetics methods include the design of models that
are biologically realistic while being able to scale for datasets with an increasing number of
cells and an increasing number of somatic mutation sites (Lahnemann, Koster et al. 2020).
The space of possible phylogenetic trees grows extremely fast with the number of cells and
mutations. Since probabilistic approaches need to search for a solution globally in this
space, the computational problem quickly becomes intractable. Indeed, this is a common
theme for probabilistic methods and a manifold of methods for approximate inference
exists, each with different trade-offs (Bishop 2011). Taken together, while adding data from
more cells will improve the resolution of phylogenetics analysis, probabilistic models for
phylogenetic inference would still face the challenge of computational tractability, even
when the data is perfect given the (super-)exponentially growing search space of possible
trees (Lahnemann, Koster et al. 2020).

1.5.4 Cell lineage reconstruction based on mitochondrial mutations

Mitochondrial mutations are increasingly recognized as lineage markers for reconstructing
clonal structures and have the advantage that these can be detected in scRNAseq and
scATACseq data (Lareau, Ludwig et al. 2021). Such analyses can potentially decipher cell
lineage relationships and simultaneously reveal cell identities. However, it is challenging to
distinguish true mtDNA variation from amplification and sequencing errors introduced
during library preparation steps (Kwok, Qiao et al. 2021). As a consequence, uninformative
and noisy mtDNA variant calls may confound clonal inference and biological
interpretation. While methods designed for somatic mutation discovery in nuclear genomic
DNA can rely on assumptions regarding a diploid context, this is violated in the
mitochondrial genome since multiple copies of mtDNA exist per cell and mutations may
exist in any fraction between one of these mtDNA copies or all (Kwok, Qiao et al. 2021).
The failure to sequence mtDNA copies that harbor variants may consequently lead to false
negatives. The number of mtDNA copies per cell varies greatly between cell types and
tissues, but the mechanisms by which mtDNA copy number is monitored and controlled are
not well understood (O'Hara, Tedone et al. 2019). These uncertainties may ambiguate
modeling the process of mtDNA mutations and the increasing level of heteroplasmy.

Very few computational methods are available for detecting genetic variation in mtDNA
across single cell sequencing assays, in particular, for analyzing mitochondrial mutations in

                                                                                           17
scRNAseq data (Kwok, Qiao et al. 2021, Miller, Lareau et al. 2021). Methods published in peer-reviewed journals include EMBLEM and mgatk, which rely on allele frequencies to detect somatic variants in mtDNA (Xu, Nuno et al. 2019, Lareau, Ludwig et al. 2021). This is done by considering the fraction of reads supporting more than one nucleotide. These methods were primarily designed for scATAC-seq, but may not be as robust for scRNAseq (Lareau, Ludwig et al. 2021). With regards to inference of clonal relationships based on detected mitochondrial mutations, available methods report a binary representation of presence or absence of mutations, or through agglomerative hierarchical clustering to group cells that share mtDNA variants. Binary representation of presence and absence of mutations is limited in that perceived absence of mutation may be the result of a false negative from mutated alleles, for example due to low read coverage over variant loci. Another disadvantage of using agglomerative hierarchical clustering is the difficulty to determine the number of meaningful clusters of related cells. Moreover, this approach reports one binary tree, and does not account for alternative trees which may also explain the data. While an ideal tree construction algorithm would include also internal nodes, such algorithms are currently not available (Ludwig, Lareau et al. 2019). In Paper III, we address these issues by developing a probabilistic approach for tree construction, which uses a greedy search to iteratively add internal mutation nodes to create a tree with the highest likelihood. This allows us to evaluate the tree using the full set of cells, rather than being restricted to a pair-wise comparison. 18
2 PRESENT INVESTIGATION

2.1 GENERAL AIMS
This thesis has used single cell DNA and RNA sequencing to detect and utilize genetic
variation for retrospective lineage reconstruction of human cell populations.

2.2 SPECIFIC AIMS
Paper I:
To investigate if bone marrow-derived stem cells can form adipocytes in bone marrow or
peripheral blood stem cell transplant recipients.

Paper II:
To develop a computational method for the identification of somatic mutations which can
be used to infer cell lineage relationships of human cell populations.

Paper III:
To develop a computational method for cell lineage reconstruction and simultaneous gene
expression profiling, and to apply this method to investigate human memory and effector
CD8+ T cell development after vaccination

                                                                                     19
You can also read