Central Drive to the Paretic Ankle Plantarflexors Affects the Relationship Between Propulsion and Walking Speed After Stroke
←
→
Page content transcription
If your browser does not render page correctly, please read the page content below
RESEARCH ARTICLES
Central Drive to the Paretic Ankle Plantarflexors
Affects the Relationship Between Propulsion and
Walking Speed After Stroke
Downloaded from https://journals.lww.com/jnpt by foM14ZkUbAC9zOOlWJIGBaLiZCyEWx2okcfGljsIRBVZqoggJtnvTSqYCxZ9opEHvhWAVIXwFJkaBbxmlFsrjQO3AIZ8Na/EK7sEbdErNKytyJniOvzDpzh3Pk+82GWQ on 02/25/2020
Louis N. Awad, PT, DPT, PhD, HaoYuan Hsiao, PhD, and Stuart A. Binder-Macleod, PT, PhD
Background and Purpose: The ankle plantarflexor muscles are the Video Abstract available for more insights from the authors (see the
primary generators of propulsion during walking. Impaired paretic Video, Supplemental Digital Content 1, available at: http://links.lww.
com/JNPT/A298).
plantarflexion is a key contributor to interlimb propulsion asym-
metry after stroke. Poststroke muscle weakness may be the result Key words: activation, diagnosis, electrical stimulation, gait,
of a reduced force-generating capacity, reduced central drive, or a neuromuscular
combination of these impairments. This study sought to elucidate
the relationship between the neuromuscular function of the paretic (JNPT 2020;44: 42–48)
plantarflexor muscles and propulsion deficits across individuals with
different walking speeds. INTRODUCTION
Methods: For 40 individuals poststroke, we used instrumented gait
analysis and dynamometry coupled with supramaximal electrostimu-
lation to study the interplay between limb kinematics, the neuromus-
S ymmetrical propulsive force generation from the individ-
ual limbs is a hallmark feature of healthy bipedal loco-
motion that contributes to an economical and stable gait.1
cular function of the paretic plantarflexors (ie, strength capacity and In contrast, asymmetrical propulsion is characteristic of post-
central drive), propulsion, and walking speed. stroke hemiparesis2 and is associated with impaired walking
Results: The strength capacity of the paretic plantarflexors was not function.3,4 Poststroke neuromotor impairments are heteroge-
independently related to paretic propulsion. Reduced central drive to neous and the propulsive force generated by each limb depends
the paretic plantarflexors independently contributed to paretic propul- on both kinematics and kinetics.5,6 Prior work has shown that
sion deficits. An interaction between walking speed and plantarflexor the ankle plantarflexor muscles are the primary generators of
central drive was observed. Individuals with slower speeds and lower propulsive power during walking7 and that the trailing limb
paretic plantarflexor central drive presented with the largest propul- angle plays an important role in translating ankle plantarflex-
sion impairments. Some study participants with low paretic plan- ion torque into propulsion (Figure 1A).5,8 However, little is
tarflexor central drive presented with similarly fast speeds as those known about how the nature of plantarflexor muscle weakness
with near-normal central drive by leveraging a compensatory reliance affects propulsion in persons with stroke.
on nonparetic propulsion. The final model accounted for 86% of the During clinical testing, the maximum force that a patient
variance in paretic propulsion (R2 = 0.86, F = 33.10, P < 0.001). produces voluntarily is often used to measure their strength;
Discussion and Conclusions: Individuals poststroke have latent however, poststroke weakness may be the result of different
paretic plantarflexion strength that they are not able to voluntarily underlying deficits.9-12 For example, a muscle that produces
access. The magnitude of central drive deficit is a strong indicator of low voluntary forces may have reduced strength capacity (eg,
propulsion impairment in both slow and fast walkers. reduced physiologic cross-sectional area due to muscle at-
rophy), reduced central drive (ie, latent capacity to produce
higher forces), or a combination of these deficits. More specif-
Department of Physical Therapy and Athletic Training, Boston University, ically, strength capacity refers to the force produced by a fully
Massachusetts (L.N.A.); Wyss Institute for Biologically Inspired Engineer-
ing, Harvard University, Cambridge, Massachusetts (L.N.A.); Department activated muscle, and central drive is a measure of strength that
of Kinesiology and Health Education, University of Texas at Austin (H.H.); relates a muscle’s maximum voluntary force to its strength ca-
and Department of Physical Therapy, University of Delaware, Newark pacity and therefore reflects the percentage of the strength
(S.A.B.-M.) capacity that can be voluntarily generated by an individual. By
Supported by NIH grants R01NR010786 and 1KL2TR001411.
combining dynamometry with neuromuscular electrostimula-
The authors declare no conflict of interest.
Supplemental digital content is available for this article. Direct URL citation tion, the extent and nature of poststroke muscle weakness can
appears in the printed text and is provided in the HTML and PDF versions be assessed (Figure 1B).11,13
of this article on the journal’s Web site (www.jnpt.org). Personalizing propulsion-targeting interventions14-16 to
Correspondence: Louis N. Awad, PT, DPT, PhD, Boston University, 635 the needs of individual patients is necessary for the advance
Commonwealth Ave, Rm 546A, Boston, MA 02215 (louawad@bu.edu).
Copyright C 2020 Academy of Neurologic Physical Therapy, APTA.
of poststroke gait rehabilitaiton17 and likely requires iden-
ISSN: 1557-0576/20/4401-0042 tifying the nature of their ankle plantarflexion weakness.
DOI: 10.1097/NPT.0000000000000299 The objective of this study was to evaluate the interplay
42 JNPT r Volume 44, January 2020
Copyright © 2020 Academy of Neurologic Physical Therapy, APTA. Unauthorized reproduction of this article is prohibited.JNPT r Volume 44, January 2020 Central Drive to the Paretic Ankle Plantarflexors
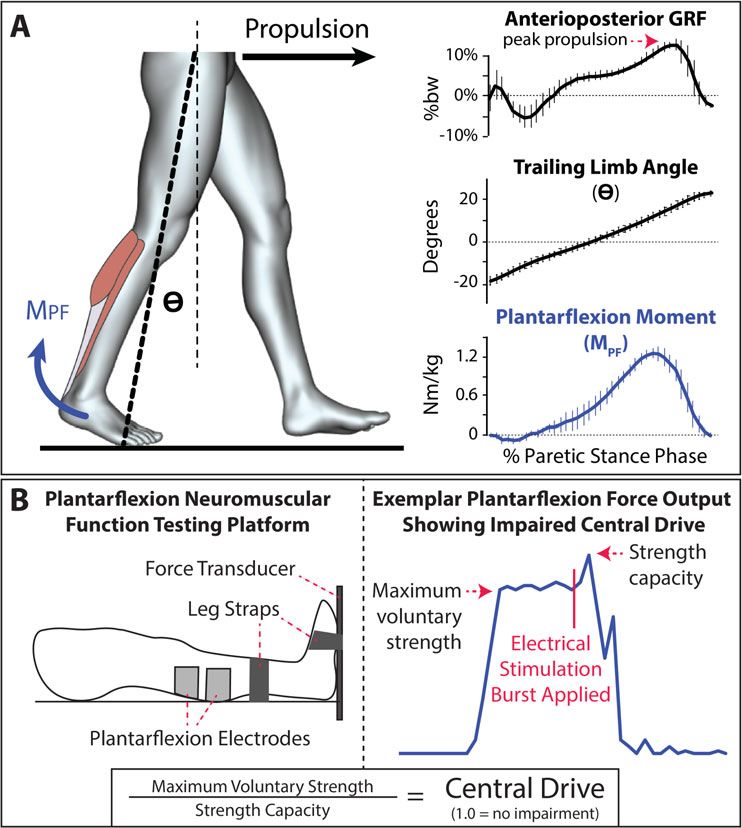
Figure 1. (A) Propulsion is produced when an ankle plantarflexion moment (MPF ) is generated and when the limb is oriented
behind the body (θ). (B) Combining isometric strength testing with muscle electrostimulation allows assessment of both a
muscle’s maximum voluntary strength and strength capacity. The ratio of these force measurements is used to compute central
drive.
between the paretic trailing limb angle, the neuromuscular motion to position the ankle in a neutral position with the knee
function of the ankle plantarflexor muscles, and paretic limb fully extended, and passive hip extension range of motion to
propulsion across speed-based subsets of community-dwelling extend the hip at least 10◦ . Individuals were excluded from
people poststroke. We hypothesized that, beyond deficits in participating if they had a history of multiple strokes, cere-
trailing limb angle and plantarflexion strength capacity, an bellar stroke, lower extremity joint replacement, bone or joint
impaired central drive to the paretic plantarflexors would pri- problems that limited their ability to walk, neglect or hemi-
marily underlie paretic limb propulsion deficits after stroke. anopia, unexplained dizziness during the past 6 months, or
chest pain or shortness of breath without exertion. All partici-
METHODS pants provided written informed consent to participate in this
study. All study procedures were approved by the University
Participants of Delaware’s Institutional Review Board.
Forty individuals with chronic stroke (>6 months after
stroke) participated in this study. Inclusion criteria were a sin- Measuring Limb Propulsion During Walking
gle cortical or subcortical stroke, sufficient cognitive function Kinetic and kinematic data were collected via an 8-
to follow instructions and communicate with the investigators, camera motion analysis system (Motion Analysis Corp,
the ability to walk for 4 minutes without orthotic support or Santa Rosa, California) as participants walked at their usual
the assistance of another individual, passive ankle range of self-selected walking speed on a split-belt treadmill (Bertec
C 2020 Academy of Neurologic Physical Therapy, APTA 43
Copyright © 2020 Academy of Neurologic Physical Therapy, APTA. Unauthorized reproduction of this article is prohibited.Awad et al JNPT r Volume 44, January 2020
Corp, Columbus, Ohio) instrumented with 2 independent 6 ment was then applied to the strength capacity calculation to
degree of freedom force plates capturing at 1080 Hz. Usual improve the accuracy and reliability for low levels of volitional
walking speed was determined over ground using a 10-m walk force production.11,13 Central drive to the plantarflexors was
test. Before data collection, participants completed a 1-minute calculated as the ratio of these strength measures:
treadmill acclimation bout. Treadmill walking speed was re-
duced if the participants felt that their overground usual walk- Central Drive = Maximum V oluntar y Str ength /
ing speed was not a comfortable treadmill walking speed. Pre- Str ength Capacit y [2]
vious work has described in detail the gait analysis setup.15,18
Participants wore an overhead support harness with no body A central drive value less than 1.0 indicates a deficit in
weight support and used a handrail if needed for safety. Kine- voluntary access to the full force-generating ability of the
matic and kinetic data were filtered using a bidirectional muscle, and thus a deficit in the central drive to the muscle.
fourth-order Butterworth low-pass filter at 6 and 30 Hz, respec-
tively. Propulsive force was determined as the maximum ante- Statistical Analyses
rior ground reaction force during stance phase,3,19 and propul- All analyses were conducted using commercial statis-
sion asymmetry was computed as previously described.14 The tical software (SPSS version 24, IBM Corp, Armonk, New
trailing limb angle was computed using kinematic data as pre- York). Alpha was set to 0.05. Means ± standard error are
viously described.3 All motion analysis data were processed reported for all variables. Between-limb differences in ankle
using commercial software (Visual 3D version 5.0, C-Motion plantarflexor strength capacity, maximum voluntary strength,
Inc, Germantown, Maryland). Variables were averaged across and central drive were assessed using independent t tests. Mod-
strides within the 30-second trial. erated regression was then used to assess the relationship be-
tween paretic propulsion, walking speed, trailing limb angle,
Muscle Performance Testing and each of the ankle plantarflexor measurements. Maximum
The burst superimposition test was used to assess the voluntary strength was found to be highly correlated with both
maximum voluntary strength, strength capacity, and cen- strength capacity (r = 0.777) and central drive (r = 0.833),
tral drive of the paretic ankle plantarflexor muscles (Figure whereas central drive and strength capacity were not correlated
1B).11,13 Participants lay supine on a dynamometer (KIN- (r = 0.359). Similarly, walking speed and trailing limb angle
COM III, Chattecx Corp, Chattanooga, Tennessee) with the were found to be highly correlated (r = 0.860).
paretic knee fully extended and the ankle in a neutral position. To avoid model multicollinearity and overfit, maximum
The foot and shank were secured in place by Velcro straps and voluntary strength and trailing limb angle were excluded
shoulder restraints were used to ensure that all generated force from the final model, which evaluated the relationship be-
was captured by the transducer and not reduced due to body tween paretic propulsion and walking speed, central drive, and
displacement. Electrical pulses were delivered using a neuro- strength capacity. All regression assumptions were assessed,
muscular electrical stimulator (Grass S8800, Grass Technolo- and centered variables were used to further minimize multi-
gies, Warwick, Rhode Island) with an SIU8T stimulus isolation collinearity. Significant moderation (indicated by a significant
unit. Two self-adhesive surface electrodes (Versa-Stim 3 × interaction) was plotted within ±1 standard deviation of the
5 , CONMED Corp, New York) were placed over the ankle moderator variables20,21 and further examined for measure-
plantarflexors, one proximally and the other on the distal por- ments of paretic and nonparetic limb propulsion and propul-
tion of the muscle belly of the calf. The cathode was placed sion symmetry across subgroups identified by stratifying study
over the widest portion of the muscle belly, covering both the participants based on the moderators.22,23
medial and lateral heads of the gastrocnemius. The anode was
placed over the distal portion of the gastrocnemius muscle RESULTS
belly. Custom software (LabView 5.1, National Instruments, Paretic limb data were available for all 40 participants.
Austin, Texas) was used to control electrical pulse delivery. Due to technical issues during data collection, nonparetic limb
An initial maximal single pulse (600 μs, 135 V) was data were available for only 39 participants. Study participants
delivered to the resting muscle. Two seconds after the ini- walked, on average, 0.69 ± 0.05 m/s and generated 12.74 ±
tial pulse, participants were encouraged to maximally contract 0.86% body weight (%bw) of nonparetic limb propulsion and
their ankle plantarflexors to allow measurement of their max- 8.54 ± 0.82%bw of paretic limb propulsion during walking—a
imum voluntary strength. A maximal electrical stimulation 33% difference in propulsion across limbs (P = 0.001). Study
burst (600-μs pulse duration, 100-ms train duration, 135 V, participants’ maximum voluntary plantarflexion strength was,
100-Hz train) was delivered 5 seconds following the first pulse on average, 384 ± 27 Newtons (N) of plantarflexion force
when the participants achieved their volitional maximum. The produced with their nonparetic limbs and 231 ± 25 N of plan-
following equation was used to calculate each person’s strength tarflexion force produced with their paretic limbs—a 40% dif-
capacity, or the force produced with full muscle activation: ference in plantarflexion force across limbs (P < 0.001). The
strength capacity of the nonparetic plantarflexors was, on av-
Str ength Capacit y = Maximum V oluntar y For ce erage, 538 ± 23 N, whereas the strength capacity of the paretic
+Fstim [1] plantarflexors was, on average, 433 ± 25 N—a 19% difference
in strength capacity across limbs (P = 0.003) (Figure 2A).
where Fstim is the additional force produced by the muscle Central drive to the nonparetic ankle plantarflexors was mea-
after the applied burst of electrical stimulation. A cubic adjust- sured to be 70 ± 3%. In contrast, central drive to the paretic
44
C 2020 Academy of Neurologic Physical Therapy, APTA
Copyright © 2020 Academy of Neurologic Physical Therapy, APTA. Unauthorized reproduction of this article is prohibited.JNPT r Volume 44, January 2020 Central Drive to the Paretic Ankle Plantarflexors
Figure 2. (A) Maximum plantarflexion force produced voluntarily and with a superimposed burst of electrical stimulation for
the paretic and nonparetic plantarflexors of 40 people poststroke. (B) Deficits in central drive to the paretic and nonparetic
plantarflexors, computed as the ratio of maximum voluntary strength and strength capacity. Error bars are the standard error.
*P < 0.05.
ankle plantarflexors was measured to be only 51 ± 4%. Be-
tween limbs, the paretic plantarflexors had a 27% lower central
drive (Figure 2B).
A regression model including only walking speed ac-
counted for 71% of the variance in paretic limb propulsion ob-
served across participants. The addition of ankle plantarflexor
muscle function measurements to the model increased the vari-
ance explained to 86% (Table 1). Independent of the effect of
a slower walking speed (β = −2.123, P < 0.001), deficits in
paretic plantarflexor central drive (β = 0.035, P < 0.001) in-
Figure 3. Relationship between paretic limb propulsion and
dependently contributed to deficits in paretic limb propulsion. walking speed is moderated by the central drive to the paretic
In contrast, deficits in paretic plantarflexor strength capacity plantarflexors. Simple slopes are calculated using ±1 standard
were not independently related to deficits in paretic propulsion deviation of the moderator variables—walking speed and
(β = −0.004, P = 0.051). An interaction between walking central drive to the paretic plantarflexors.
speed and paretic plantarflexor central drive was observed
(β = 0.187, P = 0.007). Examination of the interaction re-
vealed that, in study participants walking at speeds faster than identified the 20 slowest versus 20 fastest participants, then fur-
0.40 m/s, those with a higher central drive to the paretic ankle ther dichotomized the groups based on paretic plantarflexor
plantarflexor muscles presented with markedly more paretic central drive impairment. This 2-step subgrouping resulted
limb propulsion (∼15%bw) than individuals walking at the in four (n = 10) subgroups (see Table 2) and revealed that
same speeds but with less central drive to the paretic plan- fast participants (ie, 0.99 ± 0.04 m/s) with a high central
tarflexor muscles (∼10%bw). Regardless of central drive im- drive to the paretic ankle plantarflexor muscles (ie, 77 ± 2%)
pairment, slow walking speed was associated with the lowest presented with substantially higher paretic limb propulsion
levels of paretic propulsion (∼5%bw) (Figure 3). and low propulsion asymmetry than each of the other sub-
To further explore the interaction between walking speed groups (Figure 4A). In contrast, slow participants (ie, 0.37 ±
and paretic plantarflexor central drive impairment, we exam- 0.06 m/s) with a low central drive to the paretic ankle
ined differences in limb propulsion ability across subsets of plantarflexor muscles (ie, 26 ± 3%) presented with the highest
individuals stratified based on these 2 variables. In brief, we propulsion asymmetry (Figure 4B).
Table 1. Models of Paretic Limb Propulsive Force During Walking After Stroke
Model Statistics Predictor Statistics
Model R2 F P Predictors β P
Speed (includes only speed) 0.71 93.51Awad et al JNPT r Volume 44, January 2020
Table 2. Differences in Propulsive Ability for Walking Speed and Plantarflexor Central Drive Subgroupsa
Limb Propulsion, %bw
Walking Central Propulsion
Subgroup Speed, m/s Drive, % P NP Asymmetry, %
Fast-high 0.99 ± 0.04 77 ± 2 14.58 ± 1.07 15.79 ± 1.74 − 4 ± 14
Fast-low 0.93 ± 0.08 40 ± 3 9.41 ± 1.11 15.08 ± 1.97 32 ± 7
Slow-high 0.48 ± 0.07 60 ± 5 6.13 ± 1.21 9.93 ± 1.14 35 ± 13
Slow-low 0.37 ± 0.06 26 ± 3 4.05 ± 0.85 10.17 ± 1.14 60 ± 7
Abbreviations: NP, nonparetic; P, paretic; %bw, % body weight.
a
Mean ± standard error are reported for each variable.
DISCUSSION Beyond deficits in plantarflexion strength capacity, a
A compensatory reliance on the nonparetic limb to reduced central drive to the paretic plantarflexors explains
generate forward propulsion is a hallmark characteristic of (i) deficits in paretic propulsion during hemiparetic walking
poststroke hemiparesis that is associated with slow walking and (ii) the compensatory reliance on the nonparetic limb
speeds2,4,24 and a high energy cost of walking.14,20,25 An for propulsion, especially in fast walkers. Individuals in the
increase in propulsion symmetry driven by an increase in chronic phase of stroke recovery appear to have untapped
propulsion output from the paretic limb is an essential re- potential for plantarflexion force generation that may be ex-
habilitation goal for gait restoration after stroke,15,24 yet an ploitable during gait training to retrain more physiological
elusive objective due to our limited understanding of the neu- walking patterns. Indeed, our previous work shows that 12
romuscular deficits underlying propulsion deficits across the weeks of gait training with the addition of functional electrical
heterogeneous poststroke population. This study elucidates stimulation (FES) to the paretic plantarflexor muscles can fa-
the relationship between the neuromuscular function of the cilitate therapeutic increases in paretic plantarflexion moments
paretic ankle plantarflexor muscles—the primary generators of during walking, whereas gait training without FES does not re-
positive power during walking7 —and deficits in paretic propul- sult in an increase in paretic plantarflexion moments.6 Further
sion across study participants with different walking speeds. development and study of interventions that can help people
poststroke fully access the force-generating potential of their
ankle plantarflexor muscles is warranted. Moreover, the de-
velopment and clinical translation of diagnostic tools that can
assess the extent and nature of ankle plantarflexor dysfunc-
tion, as well as monitor changes resulting from intervention,
is needed.
Independent of differences in walking speed across study
participants, a reduced central drive to the paretic ankle plan-
tarflexors was found to be an independent contributor to paretic
propulsion deficits, whereas plantarflexor strength capacity
was not. Our observation of deficits in paretic plantarflexor
central drive being associated with increased propulsion asym-
metry in both slow and fast walkers further highlights the
importance of considering central drive when prescribing in-
terventions for the heterogeneous poststroke population. That
is, being able to more fully activate the paretic ankle plan-
tarflexor muscles during isometric strength testing is indica-
tive of being able to generate more symmetrical propulsive
forces from the lower limbs during walking. Taken together,
these findings suggest that the combination of dynamometry
with neuromuscular electrical stimulation has the potential to
play an important role in examining the nature of clinically
assessed plantarflexor muscle weakness. Given that central
drive deficits are present in other muscle groups that play cru-
cial roles during different functional movements (eg, the knee
extensors26 and elbow flexors27 ), examining the relationship
between the neuromuscular function (ie, strength capacity and
Figure 4. (A) Paretic limb propulsion and (B) interlimb central drive) of these muscles and their respective functional
propulsion asymmetry ratio for four (n = 10) subgroups movements could provide important diagnostic information
created by stratifying study participants based on their for the prescription of targeted interventions.
walking speed and central drive to the paretic plantarflexors. Interestingly, although deficits in paretic plantarflexor
Error bars are the standard error. central drive were associated with reduced paretic propulsion
46
C 2020 Academy of Neurologic Physical Therapy, APTA
Copyright © 2020 Academy of Neurologic Physical Therapy, APTA. Unauthorized reproduction of this article is prohibited.JNPT r Volume 44, January 2020 Central Drive to the Paretic Ankle Plantarflexors
during walking, some individuals with large central drive subsets to modulate their walking speeds. A follow-up study
deficits still achieved similarly fast walking speeds as those could investigate how different plantarflexion impairments in-
with near-normal paretic plantarflexor central drive. Indeed, fluence the ability to modulate walking speed, as well as other
the subset of fast participants who presented with low paretic clinically meaningful locomotor variables (eg, the energy cost
plantarflexor central drive appear to have been able to leverage of walking and gait stability).
a compensatory reliance on the nonparetic limb to meet
the propulsive demands of walking at a fast speed. That is, CONCLUSIONS
although reduced central drive to the paretic plantarflexor
The present study highlights the importance of cen-
muscles may be a primary impairment underlying paretic
tral drive to the paretic plantarflexor muscles to paretic limb
propulsion deficits, it does not necessarily result in reduced
propulsion. However, it is possible that some individuals post-
walking speed because fast walking speeds may be achieved
stroke may require a combination of interventions that increase
through nonparetic limb propulsion.2 However, as previ-
both strength capacity and central drive. Beyond suggesting
ously noted, increasing walking speed through asymmetric
that clinicians should consider the nature of their patient’s
locomotor strategies is associated with a high energy cost
muscle weakness when prescribing gait training interventions,
of walking.20
this research motivates the clinical translation of interventions
Clinically, muscle weakness is measured as the maxi-
that can target central drive (eg, neuromodulatory interven-
mum voluntary force; however, individuals with the same max-
tions, including FES) and innovative intervention studies to
imum voluntary force may have a very different balance in the
determine whether the differential targeting of central drive
underlying deficits (ie, reduced strength capacity vs reduced
versus strength capacity produces different outcomes.
central drive). With potentially different underlying deficits,
well-matched and targeted treatments are required. Indeed,
beyond more traditional muscle-strengthening approaches,28 REFERENCES
low voluntary plantarflexion force production can be increased 1. Kuo AD, Donelan JM. Dynamic principles of gait and their clinical im-
during task-specific gait training by facilitating access to la- plications. Phys Ther. 2010;90(2):157-174.
2. Hsiao H, Awad LN, Palmer JA, Higginson JS, Binder-Macleod SA. Con-
tent plantarflexion strength or supplementing low plantarflex- tribution of paretic and nonparetic limb peak propulsive forces to changes
ion strength capacity. For example, as noted previously, FES to in walking speed in individuals poststroke. Neurorehabil Neural Repair.
the ankle plantarflexor muscles during poststroke gait training 2016;30(8):743-752.
has been shown to improve paretic ankle plantarflexor moment 3. Awad LN, Binder-Macleod SA, Pohlig RT, Reisman DS. Paretic propul-
generation6 and paretic propulsion.15 sion and trailing limb angle are key determinants of long-distance walking
function after stroke. Neurorehabil Neural Repair. 2015;29(6):499-508.
4. Bowden MG, Balasubramanian CK, Behrman AL, Kautz SA. Validation
Limitations of a speed-based classification system using quantitative measures of walk-
Although muscle strength is the product of both mus- ing performance poststroke. Neurorehabil Neural Repair. 2008;22(6):672-
cle activation and the volume and contractile properties of the 675.
muscle fibers, this investigation did not include measurements 5. Hsiao H, Knarr BA, Higginson JS, Binder-Macleod SA. The relative
contribution of ankle moment and trailing limb angle to propulsive force
of the latter. Our finding that paretic plantarflexor strength during gait. Hum Mov Sci. 2015;39:212-221.
capacity was not an independent explanatory factor in our 6. Hsiao H, Knarr BA, Pohlig RT, Higginson JS, Binder-Macleod SA. Mech-
analyses when accounting for central drive deficits suggests anisms used to increase peak propulsive force following 12-weeks of gait
that poststroke changes in these properties are not primary de- training in individuals poststroke. J Biomech. 2016;49(3):388-395.
7. Zelik KE, Adamczyk PG. A unified perspective on ankle push-off in
terminants of impaired paretic propulsion; however, this study human walking. J Exp Biol. 2016;219(23):3676-3683.
cannot rule out these changes as potential contributing fac- 8. Hsiao H, Knarr BA, Higginson JS, Binder-Macleod SA. Mechanisms to
tors. Moreover, isometric muscle strength likely does not fully increase propulsive force for individuals poststroke. J Neuroeng Rehabil.
reflect the dynamic muscle function required during walking. 2015;12:40.
Measurements of muscle power may have proven to be more 9. Nadeau S, Gravel D, Arsenault AB, Bourbonnais D. Plantarflexor weak-
ness as a limiting factor of gait speed in stroke subjects and the compensat-
related to propulsion function. Another limitation of this study ing role of hip flexors. Clin Biomech (Bristol, Avon). 1999;14(2):125-135.
is that our method for measuring strength capacity assumes 10. Gray V, Rice CL, Garland SJ. Factors that influence muscle weakness fol-
that Fstim maximally activates the muscle’s residual force- lowing stroke and their clinical implications: a critical review. Physiother
generating capacity. It is possible that, for some individuals, Can. 2012;64(4):415-426.
11. Knarr BA, Higginson JS, Binder-MacLeod SA. Validation of an adjust-
higher levels of Fstim may have been required to measure ment equation for the burst superimposition technique in subjects post-
their true maximum force-generating capacity. stroke. Muscle Nerve. 2012;46(2):267-269.
A comprehensive report of differences in locomotor 12. Klein CS, Brooks D, Richardson D, McIlroy WE, Bayley MT. Voluntary
biomechanics (eg, hip, knee, and ankle kinetics and kinemat- activation failure contributes more to plantar flexor weakness than antag-
onist coactivation and muscle atrophy in chronic stroke survivors. J App
ics) across study participant subsets walking at different speeds
Physiol (1985). 2010;109(5):1337-1346.
and with different plantarflexion impairments was beyond the 13. Flynn S, Knarr BA, Perumal R, Kesar TM, Binder-MacLeod SA. Using
scope of this study. Such a detailed analysis would build on our submaximal contractions to predict the maximum force-generating ability
finding of a compensatory reliance on the nonparetic limb for of muscles. Muscle Nerve. 2012;45(6):849-858.
forward propulsion in specific subsets by revealing differences 14. Awad LN, Bae J, O’Donnell K, et al. A soft robotic exosuit improves
walking in patients after stroke. Sci Transl Med. 2017;9(400).
in inter- and intralimb gait strategies. Moreover, although this 15. Awad LN, Reisman DS, Kesar TM, Binder-Macleod SA. Targeting paretic
study accounts for differences in walking speed across partici- propulsion to improve poststroke walking function: a preliminary study.
pants, it cannot speak to the ability of individuals from different Arch Phys Med Rehabil. 2014;95(5):840-848.
C 2020 Academy of Neurologic Physical Therapy, APTA 47
Copyright © 2020 Academy of Neurologic Physical Therapy, APTA. Unauthorized reproduction of this article is prohibited.Awad et al JNPT r Volume 44, January 2020
16. Genthe K, Schenck C, Eicholtz S, Zajac-Cox L, Wolf S, Kesar TM. 22. Awad L, Reisman D, Binder-Macleod S. Distance-induced changes in
Effects of real-time gait biofeedback on paretic propulsion and gait walking speed after stroke: relationship to community walking activity. J
biomechanics in individuals post-stroke. Top Stroke Rehabil. 2018;25(3): Neurol Phys Ther. 2019;43(4);220-223.
186-193. 23. Awad LN, Reisman DS, Pohlig RT, Binder-Macleod SA. Identifying
17. Kwakkel G, Lannin NA, Borschmann K, et al. Standardized measurement candidates for targeted gait rehabilitation after stroke: better prediction
of sensorimotor recovery in stroke trials: consensus-based core recom- through biomechanics-informed characterization. J Neuroeng Rehabil.
mendations from the stroke recovery and rehabilitation roundtable. Neu- 2016;13(1):84.
rorehabil Neural Repair. 2017;31(9):784-792. 24. Roelker SA, Bowden MG, Kautz SA, Neptune RR. Paretic propulsion as
18. Reisman D, Kesar T, Perumal R, et al. Time course of functional and a measure of walking performance and functional motor recovery post-
biomechanical improvements during a gait training intervention in persons stroke: a review. Gait Posture. 2019;68:6-14.
with chronic stroke. J Neurol Phy Ther. 2013;37(4):159-165. 25. Allen JL, Kautz SA, Neptune RR. Step length asymmetry is representative
19. Hsiao H, Zabielski TM, Palmer JA, Higginson JS, Binder-Macleod SA. of compensatory mechanisms used in post-stroke hemiparetic walking.
Evaluation of measurements of propulsion used to reflect changes in Gait Posture. 2011;33(4):538-543.
walking speed in individuals poststroke. J Biomech. 2016;49(16):4107- 26. Miller M, Flansbjer UB, Lexell J. Voluntary activation of the knee ex-
4112. tensors in chronic poststroke subjects. Am J Phys Med Rehabil. 2009;
20. Awad LN, Palmer JA, Pohlig RT, Binder-Macleod SA, Reisman DS. Walk- 88(4):286-291.
ing speed and step length asymmetry modify the energy cost of walking 27. Li S, Liu J, Bhadane M, Zhou P, Rymer WZ. Activation deficit correlates
after stroke. Neurorehabil Neural Repair. 2015;29(5):416-423. with weakness in chronic stroke: evidence from evoked and voluntary
21. Cohen J, Cohen P, West SG, Aiken LS. Applied Multiple Regression/ EMG recordings. Clin Neurophysiol. 2014;125(12):2413-2417.
Correlation Analysis for the Behavioral Sciences. 3rd ed. Mahwah, NJ: 28. Wist S, Clivaz J, Sattelmayer M. Muscle strengthening for hemiparesis
Lawrence Erlbaum Associates, Publishers; 2003. after stroke: a meta-analysis. Ann Phys Rehabil Med. 2016;59(2):114-124.
48
C 2020 Academy of Neurologic Physical Therapy, APTA
Copyright © 2020 Academy of Neurologic Physical Therapy, APTA. Unauthorized reproduction of this article is prohibited.You can also read