A new method for measuring treadmill belt velocity fluctuations: effects of treadmill type, body mass and locomotion speed - Nature
←
→
Page content transcription
If your browser does not render page correctly, please read the page content below
www.nature.com/scientificreports
OPEN A new method for measuring
treadmill belt velocity fluctuations:
effects of treadmill type, body
mass and locomotion speed
Steffen Willwacher1,2,3*, Kai Daniel Oberländer4,5, Patrick Mai2, Daniela Mählich2,
Markus Kurz2,6, Till Koopmann2,7, Dominik Fohrmann2,4, Artur Kantarev2,8 &
Uwe Gustav Kersting2
Treadmills are essential to the study of human and animal locomotion as well as for applied
diagnostics in both sports and medicine. The quantification of relevant biomechanical and
physiological variables requires a precise regulation of treadmill belt velocity (TBV). Here, we present
a novel method for time-efficient tracking of TBV using standard 3D motion capture technology.
Further, we analyzed TBV fluctuations of four different treadmills as seven participants walked and ran
at target speeds ranging from 1.0 to 4.5 m/s. Using the novel method, we show that TBV regulation
differs between treadmill types, and that certain features of TBV regulation are affected by the
subjects’ body mass and their locomotion speed. With higher body mass, the TBV reductions in the
braking phase of stance became higher, even though this relationship differed between locomotion
speeds and treadmill type (significant body mass × speed × treadmill type interaction). Average belt
speeds varied between about 98 and 103% of the target speed. For three of the four treadmills, TBV
reduction during the stance phase of running was more intense (> 5% target speed) and occurred
earlier (before 50% of stance phase) unlike the typical overground center of mass velocity patterns
reported in the literature. Overall, the results of this study emphasize the importance of monitoring
TBV during locomotor research and applied diagnostics. We provide a novel method that is freely
accessible on Matlab’s file exchange server (“getBeltVelocity.m”) allowing TBV tracking to become
standard practice in locomotion research.
Treadmills are valuable tools for research on both human and animal locomotion as well as applied sport and
medical diagnostics. They enable the study of human and animal motion under controlled conditions while
requiring little laboratory space. Treadmills differ greatly in size, geometry, materials and actuation/control
systems.
When locomoting on treadmills, the total body center of mass of humans and animals remains almost
stationary in the horizontal direction relative to a global reference. However, horizontal velocity fluctuates rela-
tive to the moving reference frame of the treadmill belt. Treadmill belt velocity (TBV) fluctuation involves a
complex interplay of friction forces between the belt and supporting surface, the actuation of the belt, and the
control algorithms in powered t readmills1. Some more traditional powered treadmills rely on the inertia of the
drive train (flywheel, heavy rollers etc.) to minimize TBV fluctuations. While there is evidence suggesting TBV
fluctuation differs between different types of t readmills1, there has not been a systematic quantification of TBV
fluctuation across different treadmills.
In dry conditions, the force of friction (Ffr) is less than or equal to the product of the normal force (Fn) and
the coefficient of friction (µ)
1
Department of Mechanical and Process Engineering, Offenburg University of Applied Sciences, Badstraße 24,
77652 Offenburg, Germany. 2Institute of Biomechanics and Orthopaedics, German Sport University Cologne,
Cologne, Germany. 3School of Human Movement and Nutrition Sciences, The University of Queensland, St Lucia,
QLD, Australia. 4Motesque Inc., Cologne, Germany. 5Hochschule Fresenius, Cologne, Germany. 6Department of
Quality Technology & Mechanical Engineering, Mid Sweden University, Östersund, Sweden. 7Institute of Sport
Science, The University of Oldenburg, Oldenburg, Germany. 8Institute of Exercise Training and Sport Informatics,
German Sport University Cologne, Cologne, Germany. *email: steffen.willwacher@hs‑offenburg.de
Scientific Reports | (2021) 11:2244 | https://doi.org/10.1038/s41598-021-81951-9 1
Vol.:(0123456789)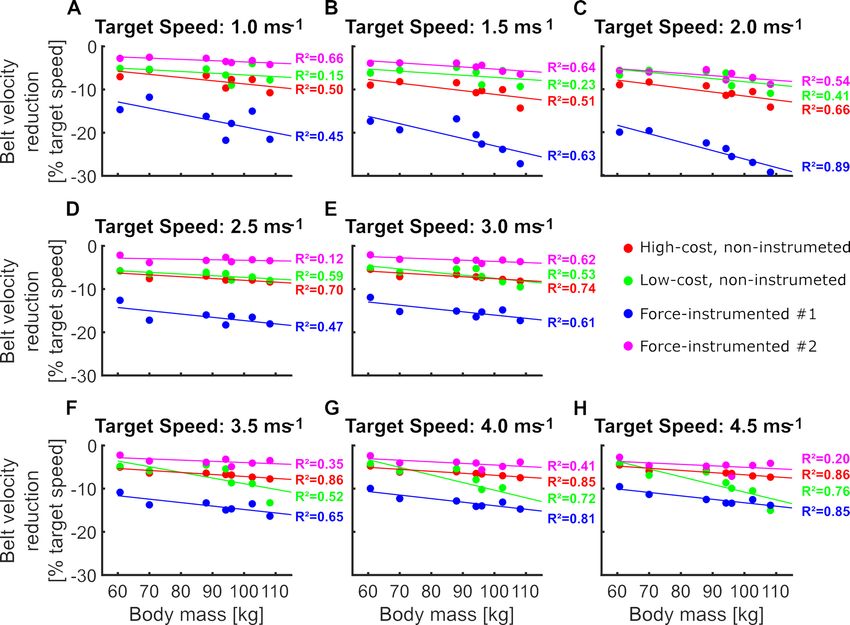
www.nature.com/scientificreports/
Ffr ≤ µ · Fn (1)
While µ depends upon the properties of the interacting materials, Fn in human and animal locomotion is
proportional to body mass and locomotion speed2–4. Therefore, TBV regulation likely differs between people of
different body mass or when moving at different locomotion speeds. However, a systematic analysis of the effects
of body mass and locomotion speed on TBV regulation in different treadmill types has not been published.
Quantifying TBV fluctuations is important because accurate values of average and instantaneous TBV are
essential in the calculation of several fundamental physiological variables. For example, the calculation of the cost
of transport (i.e., metabolic cost per distance5) or locomotion economy (i.e. metabolic energy consumption rate
at a given locomotion s peed6) for moving on a treadmill requires precise knowledge of the average belt velocity.
Further, the quantification of external center of mass (CoM) power (i.e. cross product of ground reaction force
and CoM velocity vectors) during locomotion necessitates precise tracking of instantaneous T BV7,8. In addition,
while different approaches for the quantification of mechanical work during locomotion exist, most of them
assume a constant T BV9. While there are precise measures to calculate average TBV (using, e.g., stopwatches or
tachometers), the quantification of TBV fluctuations during the gait cycle is not commonly performed.
Further, when generalizing results from treadmill studies to field conditions, it should be considered whether
the instantaneous CoM velocity pattern observed on a treadmill matches typical patterns for overground condi-
tions. Nonetheless, TBV is not a standard variable reported in studies assessing locomotion related problems.
Potentially, the lack of a time-efficient and feasible method to measure TBV fluctuation has contributed to the
omission of this variable in the past.
Therefore, the goals of the present study were: (1) To develop a method for easily determining instantaneous
TBV and TBV fluctuation using standard 3D motion capture system technology and (2) To analyze the effects
of treadmill type, locomotion speed, and body mass on TBV regulation. We hypothesized that treadmill type,
speed, and body mass would significantly alter TBV fluctuation.
Materials and methods
Participants. We recruited seven healthy, active, young participants (6 male; 1 female; body mass: 60.7–
108.2 kg; body height: 1.63–1.98 m; age: 18–35) for this study. The participants gave written informed consent
before data collections. The Ethical Commission of the German Sport University Cologne approved all methods
employed in this study, which were in accordance with the Declaration of Helsinki.
Experimental procedure. We collected 3D motion capture data while the participants were walking (1.0,
1.5, 2.0 m/s target speed) and running (2.5, 3.0, 3.5, 4.0, 4.5 m/s target speed) on four different treadmills: (1) a
relatively high-cost, non-instrumented treadmill (Stellar med, h/p/cosmos sports & medical GmbH, Nussdorf-
Traunstein, Germany), (2) a relatively low-cost, non-instrumented treadmill (F85, Sole, Stoke-on-Trent, UK),
(3) an older, force-instrumented treadmill (#1), in which the treadmill belt and bed had been substantially worn
out (Treadmetrix, Park City, UT, USA) and (4) a new force-instrumented treadmill (#2, Fully Instrumented
Treadmill/FIT, Bertec, Columbus, OH, USA). Target speed was defined as the speed displayed on the treadmills’
control panels. Because these treadmills were located in different labs, we collected marker trajectory data on
three different days while using different motion capture systems. We collected data for treadmills (1) and (2)
using a Qualisys motion capture system (250 Hz, Miqus, Qualisys AB, Gothenburg, Sweden) on the same day;
we captured data for treadmill (3) using a Vicon motion capture system (250 Hz, Bonita, Vicon Motion Systems,
Oxford, UK), and data for treadmill (4) with an OptiTrack motion capture system (240 Hz, Prime17W, Opti-
Track, Corvallis, OR, USA). All markers and marker patches were applied to the participants and the treadmills
by the same operator. For each data collection, the user interface of the respective treadmill was set to the target
speed and 17 s of data were collected for each participant at each speed.
The operator attached circular cut-outs of retro-reflective adhesive foil (radius = 8 mm; 3 M, St. Paul, MN,
USA) at regular intervals to the lateral aspects of the treadmill belts (Fig. 1). We chose the distance between
cut-out markers such that ten of them (five per lateral side) were visible on the top side of the belt at each time.
We used the tracked 3D coordinates of these markers to calculate TBV. For the application of the new method
it is of critical importance that the treadmill is perfectly aligned with the antero-posterior axis of the laboratory
coordinate system. We checked this assumption by checking the coordinates of two markers positioned in the
front and back of the treadmill at the same medio-lateral position. This way, we could also verify that the treadmill
inclination was zero during data collection.
Additionally, the operator attached seven markers to anatomical landmarks on the subjects’ pelvis and right
leg: Right and left posterior superior iliac spine, right greater trochanter, right lateral femoral condyle, right lateral
malleolus, right posterior heel, right tip of the great toe. Those markers were used for stance-phase detection.
Data analysis. Gait event detection. We filtered the 3D coordinates of markers attached to the participants’
pelvis and right leg using a 4th order, recursive, digital Butterworth low-pass filter (cut-off frequency: 6 Hz),
implemented in Matlab (R2018b, The Mathworks, Natick, MA, USA).
For the walking trials, we extracted touchdown and toe-off events using a previously published method10
using the peak horizontal distances between markers placed on the pelvis and on the heel or toe to determine
initial and final contact during the stance phase, respectively. For running trials, we applied a previously evaluated
method which uses peak knee extension angles to determine initial and final ground contact11.
Belt velocity algorithm. Using the 3D coordinates of the reflective foil cut-outs attached to the treadmill belts,
we developed an algorithm to determine the instantaneous TBV. The underlying code is freely available as a Mat-
Scientific Reports | (2021) 11:2244 | https://doi.org/10.1038/s41598-021-81951-9 2
Vol:.(1234567890)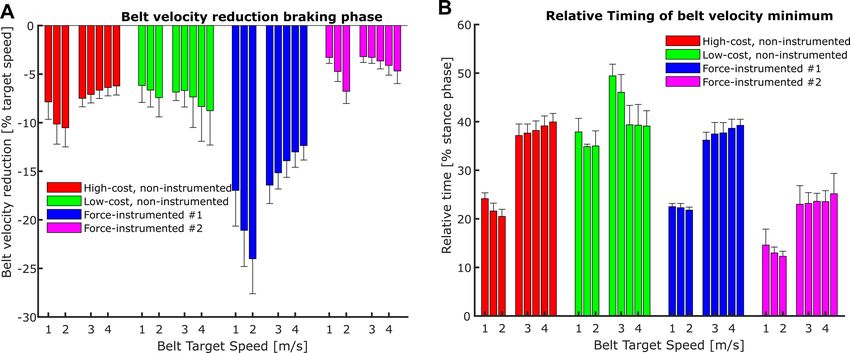
www.nature.com/scientificreports/
Figure 1. Schematic drawing of marker placement on the treadmills.
lab (The Mathworks, Natick, MA, USA) function through Matlab’s file exchange server (“getBeltVelocity.m”).
Figure 2 shows a brief description of the individual steps of the algorithm.
The algorithm works with the coordinates of markers attached to the treadmill belt as “unlabeled marker” data
to calculate TBV via time differentiation and by averaging over redundant markers. With this approach, there
is no need for time-consuming labeling of the belt marker data. The algorithm reads marker data from “.c3d”
files by using the Biomechanical Toolkit (BTK), an open-source framework for visualization and processing of
biomechanical data12. The code separates the belt markers from other “unlabeled markers” or outliers (markers
resulting, e.g., from reflections of apparel materials or short time flickering markers resulting from errors in the
reconstruction procedure) by the following method: Initially, the user defines two volumes in the lab coordinate
system in which the belt markers on the respective lateral belt sides are moving. The algorithm excludes all mark-
ers lying outside of those volumes from further analysis. Also, the algorithm excludes all markers that do not
appear for at least 20 consecutive timeframes. Subsequently, the algorithm determines the horizontal belt velocity
in the direction of movement for each belt marker, using the average marker distance over three frames and the
known measuring frequency. The algorithm excludes outliers by checking if the calculated velocity is exceeding
a user defined upper-limit of velocity. In this study, we used an upper limit of + 30% of the target speed as the
upper-limit for outlier detection. Finally, the algorithm calculates the average from all markers’ velocities at each
time frame and applies a 4th order, recursive Butterworth filter (default setting: 20 Hz cut-off frequency). The
default settings were chosen to be similar to cut-off frequencies often used to filter marker data in the analysis
of running m echanics13–15, but can be adapted for individual purposes.
We calculated the instantaneous TBV fluctuation using the novel method for every trial. Further, we subdi-
vided each trial into individual gait cycles (from the touchdown of the right leg to the next ipsilateral touchdown)
. We analyzed all gait cycles occurring in the 17 s data collection time, resulting in at least ten analyzed gait cycles
for every trial. Afterwards, we extracted the following discrete parameters for further statistical analysis: Average
TBV during stance phase, and during the entire gait cycle as well as the reduction of TBV during the braking
phase of stance. These variables were normalized to the respective target speeds in order to exclude any trivial
effects of target speed on these parameters during the statistical analysis. Besides TBV amplitude parameters, we
also quantified the relative temporal occurrence of the minimum TBV during the stance phase.
Statistical analysis. We extracted the parameters of interest for each gait cycle. We then averaged these val-
ues for each participant in each condition before implementing these averaged values into the statistical analysis.
Descriptive statistics present the means ± one standard deviation of the sample data. To analyze the effects of
treadmill types, locomotion speed and body mass on TBV regulation, we performed a two factor (treadmill
type, locomotion speed) repeated measures analysis of variance (ANOVA) with body mass as a covariate using
the ‘ranova’ and ‘fitrm’ functions of Matlab’s Statistics and Machine Learning Toolbox (R2018b, The Mathworks,
Natick, MA, USA). All data underlying the statistical analyses are provided in Supplementary Material spread-
sheet file.
Scientific Reports | (2021) 11:2244 | https://doi.org/10.1038/s41598-021-81951-9 3
Vol.:(0123456789)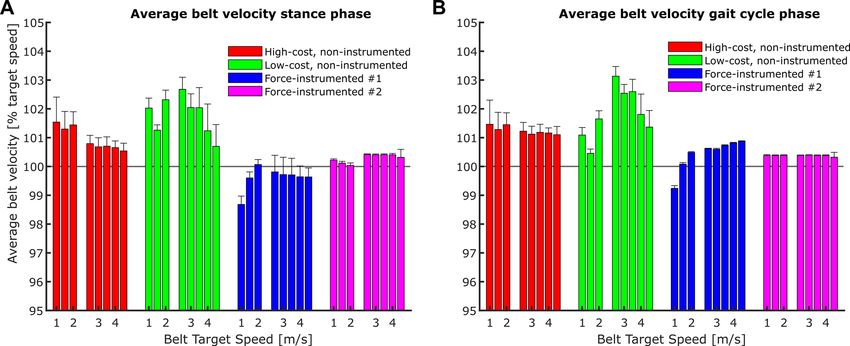
www.nature.com/scientificreports/

                                            Figure 2.  Description of the belt velocity algorithm.

                                            Results
                                            Treadmill type, locomotion speed, and body mass each significantly affected TBVs. Figure 3 illustrates the TBV
                                            behavior during the entire gait cycle between treadmills at all analyzed locomotion speeds and highlights the

          Scientific Reports |   (2021) 11:2244 |                https://doi.org/10.1038/s41598-021-81951-9                                             4

Vol:.(1234567890)
www.nature.com/scientificreports/
Figure 3. Ensemble averages of treadmill belt velocity profiles of the four different treadmill types analyzed at
three different walking target speeds (1.0–2.0 m/s, A–C, respectively) and five different running target speeds
(2.5–4.5 m/s, D–H, respectively). Solid lines indicate the mean (n = 7) of the particular treadmill condition. The
shaded areas display ± one standard deviation around the mean. Data is time-normalized to the entire gait cycle
(from right leg initial ground contact to next ipsilateral ground contact). Vertical broken lines indicate the final
contact of the right foot with the ground (toe-off).
differences in amplitude and timing of TBVs.
We observed significant main effects of treadmill type on the average TBV determined during the stance phase
(p < 0.001, Fig. 4A) and the entire gait cycle (p < 0.001, Fig. 4B). When averaged over all subjects and locomo-
tion speeds, the most pronounced deviations in average TBV were found for the low-cost, non-instrumented
treadmill (during stance: + 1.8 ± 0.7%; during gait cycle: + 1.8 ± 0.9%), followed by the high-cost, non-instru-
mented treadmill (during stance: + 1.0 ± 0.4%; durig gait cycle: + 1.2 ± 0.1%), the force-instrumented treadmill
#1 (during stance: − 0.4 ± 0.4%; during gait cycle: + 0.4 ± 0.5%), and the force-instrumented treadmill #2 (during
stance: + 0.3 ± 0.2%; during gait cycle: + 0.4 ± 0.02%). Further, we identified a significant main effect of speed
on the average TBV determined during the entire gait cycle (p = 0.013). Averaged over all treadmill types, the
relative difference in average TBV determined during the gait cycle compared to the target speed was higher in
the running compared to the walking speeds. However, there was a tendency that with faster running speeds
these differences became lower, which was mostly affected by the behavior of the low-cost, non-instrumented
treadmill (Fig. 4B). Overall, average TBV values ranged between 98 and 103% of the target belt speed. However,
differences in average TBV between treadmills were apparent, particularly for the low-cost treadmill during the
running trials (Fig. 4).
Furthermore, we found differences between treadmills in the TBV reductions and their timing in the early
stance phase (Fig. 5A,B). Specificaly, we found a significant interaction effect of body mass, speed, and treadmill
type (p < 0.001) on the TBV reduction during the braking phase of stance (Fig. 5A). This interaction effect high-
lights the different behaviors in response to variations in the participants mass and locomotor speed (Fig. 5A).
Velocity reductions ranged between 2 and 10% for all treadmill types except for the instrumented treadmill #1,
Scientific Reports | (2021) 11:2244 | https://doi.org/10.1038/s41598-021-81951-9 5
Vol.:(0123456789)www.nature.com/scientificreports/
Figure 4. Average treadmill belt velocity (mean ± standard deviation) quantified for the stance phase (A) and
the entire gait cycle (B) for four treadmills at different locomotion speeds. We separated the bars of the walking
speeds (1.0 m/s to 2.0 m/s) from the bars of the running speeds (2.5 m/s to 4.5 m/s).
Figure 5. Treadmill belt velocity reduction (mean ± standard deviation) during the braking phase of stance (A)
and its relative timing (B). We separated the bars of the walking speeds (1.0 m/s to 2.0 m/s) from the bars of the
running speeds (2.5 m/s to 4.5 m/s).
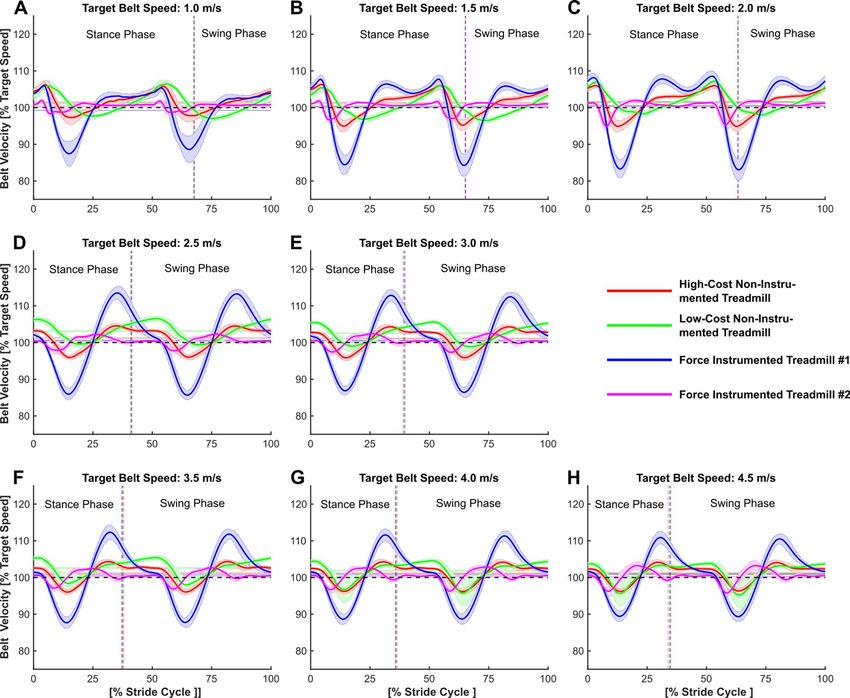
which showed reductions between 12 and 25% of the target speed (Fig. 5A). While higher body mass generally
led to greater TBV reductions during the braking phase of stance, this relationship was specific for different
treadmill types and locomotion speeds (Fig. 6). Averaging over all participants and locomotion speeds yielded
the largest reductions in TBV during the braking phase for the instrumented treadmill #1 (− 16.6 ± 4.1%), fol-
lowed by the high-cost, non-instrumented treadmill (− 7.8 ± 1.6%), the low-cost, non-instrumented treadmill
(− 7.3 ± 0.9%), and the instrumented treadmill #2 (− 4.2 ± 1.2%).
When taking a closer look at the relative timing of minimal TBV reached during the braking phase of stance,
we found significant main effects of speed (p < 0.001, Fig. 5B) and treadmill type (p < 0.001, Fig. 5B). The speed
effect likely resulted from the fact that, averaged over all treadmills, at walking speeds the minimum TBV
occurred relatively earlier (between 22.4 and 24.8% of stance) compared to running speeds (between 34.7 and
36.4%). Averaged over all speeds, minimum TBV during the braking phase occurred the earliest for the instru-
mented treadmill #2 (19.8 ± 5.5% of stance), followed by instrumented treadmill #1 (32.0 ± 8.1% of stance), the
high-cost, non-instrumented treadmill (32.3 ± 8.6% of stance), and the low-cost, non-instrumented treadmill
(40.1 ± 5.1% of stance). For almost all trials (30 of 32), minimum TBV was reached at or before 40% of the stance
phase (Fig. 5B).
Scientific Reports | (2021) 11:2244 | https://doi.org/10.1038/s41598-021-81951-9 6
Vol:.(1234567890)www.nature.com/scientificreports/
Figure 6. The relationship between the participants’ body mass and treadmill belt velocity reductions during
the braking phase of stance at different walking (A–C) and running (D–H) speeds. Each dot represents the
result of one particular participant, while colors differentiate between treadmill types. Colored lines were fitted
using linear least squares estimation.
Discussion
The first purpose of the present study was to develop an efficient algorithm that allows tracking of the instanta-
neous velocity of treadmill belts using standard motion capture technology without adding considerable time
for post-processing.
Our method represents an extension to previously developed methods that either measured TBV fluctuation
from single markers attached to the treadmill belt1 or which determined TBV during the stance phase from mark-
ers attached to the f eet16. Compared to these previous approaches, our approach has several advantages. Since
our method uses a higher number of markers to calculate TBV, it is inherently more robust and reliable. If, for
example, a person walking or running on the treadmill is hiding a single marker attached to the treadmill belt,
TBV cannot be determined accurately by methods relying on a single marker attached to the belt and must be
interpolated during this period. This problem is aggravated when additional devices (e.g. oxygen consumption
systems, additional weights, or exoskeletons) are carried by the subject moving on the treadmill. Furthermore,
a single marker can track TBV only during the time when it is moving on the top of the treadmill, i.e. during
50% of the time.
When utilizing markers attached to the feet, TBV can only be determined during the stance phase and not
during flight phases, which typically occur during running locomotion. Further, foot marker methods assume
that during the entire stance phase there is no relative motion between foot and ground. However, this assump-
tion not valid during most intervals of the stance phase, as illustrated by, e.g., the dorsiflexion and plantarflexion
motion of the ankle joint to absorb or generate energy at the beginning or end of stance, respectively.
Another advantage of our method is the absence of additional post-processing work (e.g. labeling), making
it very time efficient. We achieved this benefit by using “unlabeled markers”, i.e. markers that are not labeled
automatically or manually through the motion capture software. “Unlabeled markers” are still given a kind of
label (e.g. * plus a number in a Vicon system) by the motion capture system based on the timing of their first
appearace in the file. However, further computations are needed to make use of the information stored in these
marker coordinates. The results of our systematic analysis of TBVs revealed similar results for TBV fluctuation
Scientific Reports | (2021) 11:2244 | https://doi.org/10.1038/s41598-021-81951-9 7
Vol.:(0123456789)www.nature.com/scientificreports/
waveforms compared to previously reported r esults1, thus providing some evidence to support the validity of
our method.
The second purpose of this study was to analyze the effects of treadmill type, locomotion speed, and body
mass on TBV regulation. Significant main effects of treadmill type were identified in all parameters analyzed
in this study. We further found significant main or interaction effects for locomotion speed and body mass for
specific parameters of interest. Therefore, our hypothesis that TBV regulation would be affected by treadmill
type, locomotion speed, and body mass was supported.
When looking at the average TBV determined during the stance phase or the entire gait cycle, it becomes
apparent that relying on the displayed average speed when performing studies on treadmills is not advisable.
We observed average differences of more than three percent between treadmill types for walking at a slow speed
(Fig. 4). Therefore, one needs to be careful when comparing results for e.g., metabolic cost or locomotor economy,
if they are collected from walking or running using different treadmill types. Essentially, the findings of this study
suggest that it would be ideal to track TBV during every experiment or diagnostic analysis in which locomotion
speed is used directly or for the calculation of derived variables (for e.g., running economy). If this approach is
not feasible, it might be good practice to calibrate average TBV during every data collection and to occasionally
verify that TBV fluctuations are small.
This suggestion is further emphasized by the finding of a significant main effect for speed on average TBV
determined during the entire gait cycle. We found greater average TBV deviations at running compared to
walking speeds. Therefore, even when using the same treadmill type, slightly different precision in the control
of average locomotor speed can be expected, in particular when comparing walking with running gaits.
Furthermore, it is apparent from Fig. 3 that the patterns of TBV regulation vary between treadmill types
in both their amplitude and timing. Therefore, it is likely that the way someone walks or runs on a treadmill
is affected by the type of treadmill used. Hence, the comparability of treadmill to overground locomotion is
also affected by the treadmill type used. This finding might partly explain the high heterogeneity of results that
researchers have obtained when comparing overground to treadmill locomotion11,17–19. When trying to assess
the validity of treadmill locomotion versus overground locomotion, specific criteria can be defined. For example,
in running, the horizontal velocity of the center of mass changes as a result of the horizontal forces applied to
the ground and the corresponding ground reaction force impulse. Previous research has established that when
running at speeds between 3.0 and 5.0 m/s, the braking impulse of the ground reaction force is approximately
equivalent to a 5% reduction in center of mass velocity and is generated from foot strike until just before 50% of
stance20. When taking these values as a reference it appears that the TBV of 3 out of the 4 treadmill types in this
study slows too much during initial stance compared to overground conditions, in particular the force-instru-
mented treadmill #1 (Fig. 5A). Further, when considering the timing of the peak minimal TBV, in all treadmill
types tested the minimum TBV occurred too early (before approx. 50% of the stance phase (Fig. 5B)), compared
to the data presented in a multitude of other s tudies20,21. Hence, for a better comparability to overground run-
ning conditions, treadmill manufacturers should try to modulate their TBV regulation towards meeting TBV
profiles that are more consistent with typical overground conditions. At the same time, TBV regulation needs to
be robust against varying ground force applications, e.g., due to differences in body mass and/or running speed
between users.
Finally, it is important to note that the findings of this study have several limitations. Firstly, due to time
restrictions, we could only analyze seven participants. We still found significant effects of the independent vari-
ables on TBV regulation. However, due to the low statistical power, we might have missed some effects. Further,
while we attempted to collect data from different types of treadmills in new and worn-out conditions, our
study does not provide a representative sample of the entire treadmill market. In particular, force-instrumented
treadmill #1 showed the most pronounced fluctuations in TBV. Next to having a relatively worn out belt, it
is not unlikely that these pronounced fluctuations were also the result of incorrect settings of the underlying
TBV control algorithm of the treadmill. Therefore, future studies should explore other types of treadmills, and
potentially also systematically modify factors like belt materials, the power supply of treadmill actuators, dif-
ferent states of lubrication or the effects of different running or walking styles on TBV regulation. We hope that
our newly developed method will improve locomotion research and consequently lead to deeper insights in the
future. We also did not compare our results of the average TBV to values obtained from unloaded treadmill belts
at the respective target speeds. Such an analysis would provide greater insight to systematic errors of treadmill
belt speed control independent of the characteristics of treadmill users or locomotion speed. Further, we did
not directly assess whether the different motion capture systems used in different labs introduced any systematic
or random errors to the assessment of TBV using our newly developed method. In each lab, we calibrated the
motion capture systems following the guidelines provided by the manufacturers. Properly calibrated, modern 3D
motion capture systems can capture marker data with high accuracy (< 0.1 mm error in position). Therefore, we
believe that using different motion capture systems did not significantly affect our results. However, this state-
ment needs to be verfified in future studies.
In conclusion, the results of this study highlight the need to monitor the velocity of the treadmill belt for
locomotor research and the determination of applied diagnostics. We provide a novel method that is freely acces-
sible and that allows tracking belt velocity in a time-efficient manner using standard motion capture systems.
The code was developed using motion capture systems of three major manufacturers, and the authors hope to
encourage the further adaptation of the code to data collected from other motion capture system manufacturers.
Received: 11 June 2020; Accepted: 8 January 2021
Scientific Reports | (2021) 11:2244 | https://doi.org/10.1038/s41598-021-81951-9 8
Vol:.(1234567890)www.nature.com/scientificreports/
References
1. Savelberg, H. H. C. M., Vorstenbosch, M. A. T. M., Kamman, E. H., van de Weijer, J. G. W. & Schambardt, H. C. Intra-stride belt-
speed variation affects treadmill locomotion. Gait Posture 7, 26–34 (1998).
2. Kram, R. & Taylor, C. R. Energetics of running: A new perspective. Nature 346, 265–267 (1990).
3. Nilsson, J. & Thorstensson, A. Ground reaction forces at different speeds of human walking and running. Acta Physiol. Scand. 136,
217–227 (1989).
4. Weyand, P. G., Sternlight, D. B., Bellizzi, M. J. & Wright, S. Faster top running speeds are achieved with greater ground forces not
more rapid leg movements. J. Appl. Physiol. 89, 1991–1999 (2000).
5. Schmidt-Nielsen, K. Locomotion: Energy cost of swimming, flying, and running. Science 177, 222–228 (1972).
6. Conley, D. L. & Krahenbuhl, G. S. Running economy and distance running performance of highly trained athletes. Med. Sci. Sports
Exerc. 12, 357–360 (1980).
7. Donelan, J. M., Kram, R. & Kuo, A. D. Simultaneous positive and negative external mechanical work in human walking. J. Biomech.
35, 117–124 (2002).
8. Zelik, K. E. & Kuo, A. D. Human walking isn’t all hard work: Evidence of soft tissue contributions to energy dissipation and return.
J. Exp. Biol. 213, 4257–4264 (2010).
9. Arampatzis, A., Knicker, A., Metzler, V. & Brüggemann, G.-P. Mechanical power in running: A comparison of different approaches.
J. Biomech. 33, 457–463 (2000).
10. Zeni, J., Richards, J. & Higginson, J. S. Two simple methods for determining gait events during treadmill and overground walking
using kinematic data. Gait Posture 27, 710–714 (2008).
11. Fellin, R. E., Manal, K. & Davis, I. S. Comparison of lower extremity kinematic curves during overground and treadmill running.
J. Appl. Biomech. 26, 407–414 (2010).
12. Barre, A. & Armand, S. Biomechanical ToolKit: Open-source framework to visualize and process biomechanical data. Comput.
Methods Programs Biomed. 114, 80–87 (2014).
13. Mai, P. & Willwacher, S. Effects of low-pass filter combinations on lower extremity joint moments in distance running. J. Biomech.
95, 109311 (2019).
14. Willwacher, S., Sanno, M. & Brüggemann, G.-P. Fatigue matters: An intense 10 km run alters frontal and transverse plane joint
kinematics in competitive and recreational adult runners. Gait Posture 76, 277–283 (2020).
15. Willwacher, S. et al. Surface stiffness and footwear affect the loading stimulus for lower extremity muscles when running. J. Strength
Cond. Res. https://doi.org/10.1519/JSC.0000000000003410 (2020).
16. Fusco, N. & Crétual, A. Instantaneous treadmill speed determination using subject’s kinematic data. Gait Posture 28, 663–667
(2008).
17. Firminger, C. R. et al. Joint kinematics and ground reaction forces in overground versus treadmill graded running. Gait Posture
63, 109–113 (2018).
18. Miller, J. R. et al. A systematic review and meta-analysis of crossover studies comparing physiological, perceptual and performance
measures between treadmill and overground running. Sports Med. 49(5), 763–782 (2019).
19. Riley, P. O. et al. A kinematics and kinetic comparison of overground and treadmill running. Med. Sci. Sports Exerc. 40, 1093–1100
(2008).
20. Munro, C. F., Miller, D. I. & Fuglevand, A. J. Ground reaction forces in running: A reexamination. J. Biomech. 20, 147–155 (1987).
21. Cavanagh, P. R. & Lafortune, M. A. Ground reaction forces in distance running. J. Biomech. 13, 397–406 (1980).
Acknowledgements
We want to thank the students of the Instrumentation Technology course for their help during data collection
in this project.
Author contributions
The study was designed by S.W., K.D.O., A.K. and U.K. S.W. wrote the paper with substantial contribution from
K.D.O, P.M., A.K. and U.K. Experimental data were collected and post-processed by D.M., P.M., M.K., T.K., D.F.,
and A.K. The TBV algorithm was developed by A.K., D.F. and S.W. Data analyses were performed by S.W. and
A.K. Statistical analyses were performed by S.W.
Funding
Open Access funding enabled and organized by Projekt DEAL.
Competing interests
The authors declare no competing interests.
Additional information
Supplementary Information The online version contains supplementary material available at https://doi.
org/10.1038/s41598-021-81951-9.
Correspondence and requests for materials should be addressed to S.W.
Reprints and permissions information is available at www.nature.com/reprints.
Publisher’s note Springer Nature remains neutral with regard to jurisdictional claims in published maps and
institutional affiliations.
Scientific Reports | (2021) 11:2244 | https://doi.org/10.1038/s41598-021-81951-9 9
Vol.:(0123456789)www.nature.com/scientificreports/
Open Access This article is licensed under a Creative Commons Attribution 4.0 International
License, which permits use, sharing, adaptation, distribution and reproduction in any medium or
format, as long as you give appropriate credit to the original author(s) and the source, provide a link to the
Creative Commons licence, and indicate if changes were made. The images or other third party material in this
article are included in the article’s Creative Commons licence, unless indicated otherwise in a credit line to the
material. If material is not included in the article’s Creative Commons licence and your intended use is not
permitted by statutory regulation or exceeds the permitted use, you will need to obtain permission directly from
the copyright holder. To view a copy of this licence, visit http://creativecommons.org/licenses/by/4.0/.
© The Author(s) 2021
Scientific Reports | (2021) 11:2244 | https://doi.org/10.1038/s41598-021-81951-9 10
Vol:.(1234567890)You can also read