Changes Associated with Improved Outcomes for Cats Entering RSPCA Queensland Shelters from 2011 to 2016 - MDPI
←
→
Page content transcription
If your browser does not render page correctly, please read the page content below
animals
Article
Changes Associated with Improved Outcomes
for Cats Entering RSPCA Queensland Shelters
from 2011 to 2016
Caroline Audrey Kerr 1, *, Jacquie Rand 1,2 , John Murray Morton 1,3       ID
                                                                                , Ronelle Reid 4
and Mandy Paterson 1,4
 1   School of Veterinary Science, the University of Queensland, Gatton, QLD 4343, Australia;
     j.rand@uq.edu.au or jacquie@petwelfare.org.au (J.R.); John.morton@optusnet.com.au (J.M.M.);
     mpaterson@rspcaqld.org.au (M.P.)
 2   Australian Pet Welfare Foundation, Kenmore, QLD 4069, Australia
 3   Jemora Pty Ltd., Geelong, VIC 3220, Australia
 4   Royal Society for the Prevention of Cruelty to Animals (RSPCA), Wacol, QLD 4076, Australia;
     rreid@rspcaqld.org.au
 *   Correspondence: caroline.kerr@uqconnect.edu.au

 Received: 29 March 2018; Accepted: 6 June 2018; Published: 12 June 2018

 Simple Summary: The aim of this study was to identify changes that contributed to the markedly
 improved live release of cats in Royal Society for the Prevention of Cruelty to Animals (RSPCA)
 Queensland shelters by comparing data from 2011 and 2016. Admission numbers were similar in
 these two years. The number and percentage euthanized decreased substantially from 58% in 2011 to
 15% in 2016. The greatest contributor to this were marked increases in cats rehomed (i.e., adopted).
 The number of cats adopted doubled from 2011 to 2016, with over half the increase contributed by
 increased shelter adoptions, and the remainder achieved by increased off-site adoptions, largely
 through agreements with Petbarn stores. Improved outcomes were facilitated by nearly doubling
 the number of cats temporarily in foster care. Cats euthanized for behavioral reasons decreased by
 85%, including a marked decrease in the number of euthanasias because the cat was deemed feral.
 Euthanasia of young kittens dramatically decreased. The number of cats reclaimed by their owner
 was similar in the two years and was only a small contributor to the numbers of cats released live.
 To achieve further improvements, programs that decrease intake for both stray and owned cats would
 be beneficial.

 Abstract: This retrospective study of cat admissions to RSPCA Queensland shelters describes changes
 associated with improved outcomes ending in live release in 2016 compared to 2011. There were
 13,911 cat admissions in 2011 and 13,220 in 2016, with approximately 50% in both years admitted
 as strays from the general public or council contracts. In contrast, owner surrenders halved from
 30% to 15% of admissions. Percentages of admissions ending in euthanasia decreased from 58% to
 15%. Only 5% of cat admissions were reclaimed in each of these years, but the percentage rehomed
 increased from 34% to 74%, of which 61% of the increase was contributed by in-shelter adoptions and
 39% from non-shelter sites, predominately retail partnerships. The percentage temporarily fostered
 until rehoming doubled. In 2011, euthanasias were most common for medical (32% of all euthanasias),
 behavioral (36%) and age/shelter number (30%) reasons, whereas in 2016, 69% of euthanasias were
 for medical reasons. The number of young kittens euthanized decreased from 1116 in 2011 to 22 in
 2016. The number of cats classified as feral and euthanized decreased from 1178 to 132, in association
 with increased time for assessment of behavior and increased use of behavior modification programs
 and foster care. We attribute the improved cat outcomes to strategies that increased adoptions and
 reduced euthanasia of young kittens and poorly socialized cats, including foster programs. To achieve

Animals 2018, 8, 95; doi:10.3390/ani8060095                                      www.mdpi.com/journal/animals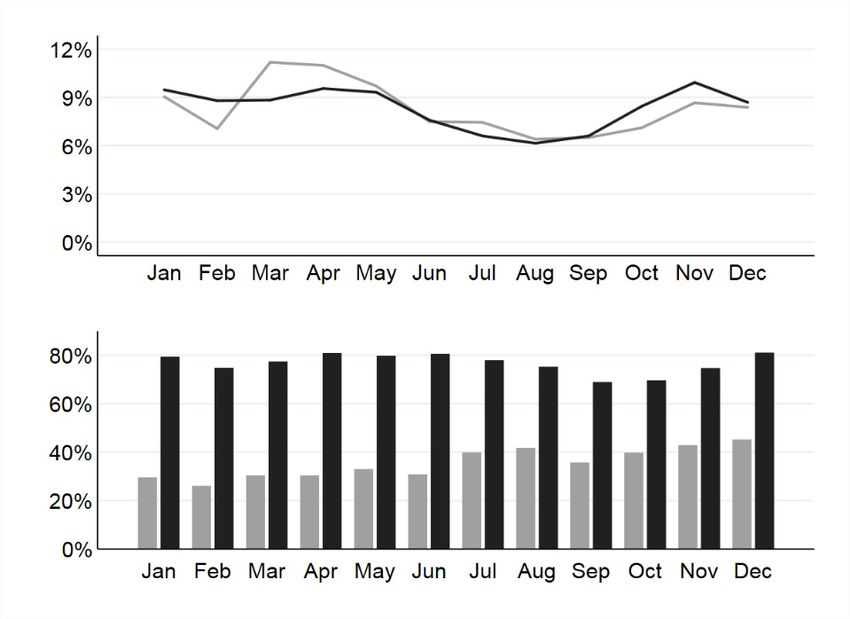
Animals 2018, 8, 95                                                                                    2 of 28

 further decreases in euthanasia, strategies to decrease intake would be highly beneficial, such as those
 targeted to reduce stray cat admissions.

 Keywords: cat; shelter; RSPCA; admission source; outcomes; stray; surrendered; adopted; euthanized; desexed

1. Introduction
      Large numbers of stray and owned cats are admitted to animal shelters annually, and historically
have had poor survival outcomes [1–3], with euthanasia percentages reported to be in excess of 58% in
2010 in Australia [4] and 50% to 70% in the USA [2,5,6]. As the animal welfare and social impact of
this is substantial [7], animal welfare agencies in Australia and internationally have made considerable
efforts to improve outcomes [2]. As a consequence, euthanasia percentages reported by the major
welfare agencies in USA and Australia decreased to 41% in 2014/2015 [8] and 29% in 2015/2016 [3],
respectively. However, achieving further decreases in euthanasia of cats entering shelters is an ongoing
and complex challenge. Consequently, research into understanding what strategies are effective in
decreasing euthanasia of cats would be advantageous in defining strategies to reduce the number of
cats euthanized in shelters.
      One way to reduce the number of cats euthanized in shelters is by reducing intake through
addressing the factors that lead to cat admissions. Desexing programs [9] have traditionally been
utilized to reduce numbers of stray and owned kittens and cats entering shelters [10–12], and their
euthanasia [5,13]. Other strategies used by shelters may include assisting owners to keep their cat
rather than surrender it, by providing advice and support, especially for medical and behavioral issues
(called ‘pet diversion’ or ‘pet retention’ programs) [14]. The number of cats euthanized can also be
reduced by increasing the number of cats that are reclaimed by owners and adoptions. Programs
that increase the number of owned cats with microchips, and increase the percentage of owners with
accurate contact details , assist in increasing the number of lost cats that are reclaimed in Australia, USA,
and the UK [15]. Nevertheless, reclaim percentages are very low at 2% of admissions in USA [16] and
5% in Australia [3].
      In Australia in 2016, the estimated number of owned cats was just under 3.9 million [17].
The percentage of households with cats increased by 6 percentage points from 23% in 2014 to 29%
in 2016 [17], with 25% of owned cats acquired from shelters and rescue groups [17]. In parallel,
Royal Society for the Prevention of Cruelty to Animals (RSPCA) Australia’s shelters increased the
percentage of cats rehomed from 29% (19,004 cats) in 2010/2011 to 56% (31,178 cats) in 2015/2016.
In the USA, 57% of admissions (711,270) were rehomed in 2016 across 2225 shelters [8] and maximizing
the number adopted is important in decreasing numbers euthanized [18]. Because increased time in
shelters leads to chronic stress and illness, and potentially a greater risk of euthanasia [19], it is crucial
that adoption factors and pathways to adoptions are further examined, so that times to adoption can
be minimized. Consequently, a number of studies in U.S.A. have examined factors that increase the
probability of admitted cats being adopted [19–22], such as ‘friendliness’ [19] and the degree of play
activity displayed by a cat [22].
      The RSPCA is Australia’s largest animal welfare agency that receives stray and owner-surrendered
cats [23]. In 2015/2016, reported euthanasia percentages for the RSPCA varied substantially between
states, from 44% in New South Wales (NSW) to 12% in Queensland in 2015–2016 [23], and Queensland
reported the greatest decrease over the previous 5 years [3]. Therefore, evaluating intake and outcome
data to understand factors associated with the reduction in numbers and percentages of admissions in
which the cat was euthanized, and the consequent increase in live release numbers and percentages in
Queensland, may assist in improving cat outcomes in other shelters. The aim of this study was to identify
changes associated with improved outcomes for cats at RSPCA Queensland in 2016 compared to 2011.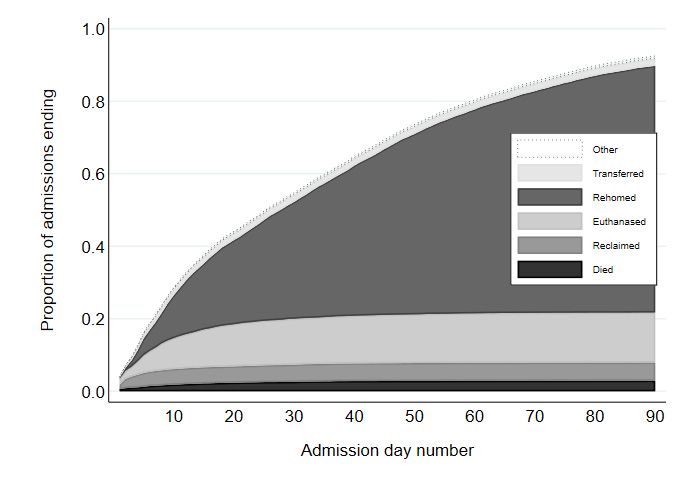
Animals 2018, 8, 95                                                                                 3 of 28

2. Experimental Section

2.1. Study Design and Data Collection
      A retrospective study was conducted using RSPCA Queensland data for cat admissions to their
 shelters for the calendar years of 2011 and 2016. Cats were either admitted directly into the RSPCA
 Queensland shelters (9 shelters in 2011 and 10 shelters in 2016) or other RSPCA Queensland locations
(two RSPCA pet shops, one adoption center, and one Friends group both years), or via council contracts
(five council contracts in 2011 and six in 2016) (Table A1). Councils in Australia are local government
 bodies (similar to counties in USA) and are responsible for domestic animal control. Over the study
period, stray animals under council control that were not reclaimed within a minimum holding period
(typically 72 h in Queensland) could be rehomed. In Australia, holding periods are specified by local
 councils, and may vary between councils. If there was a contract in place between the council and
 RSPCA Queensland, cats were moved to the relevant RSPCA shelter, which was adjacent to the council
pound (the council animal holding facility). Within other council areas with no RSPCA contract,
 selected cats were regularly transferred from the council pound to the RSPCA for rehoming.
      For cats admitted to RSPCA Queensland facilities, rehoming of unclaimed stray cats only
 commenced after the mandated minimum holding period of 72 h, and after a cooling-off period
 of 24 h for owner-surrendered cats. Non-reclaimed cats were assessed behaviorally and medically,
 and if deemed suitable for adoption, were desexed, and attempts at rehoming commenced either
 directly from RSPCA Queensland shelters (either the shelter to which the cat was admitted or another
 RSPCA shelter where the cat had subsequently been moved to) or after movement or transfer to
 adoption centers, pet shops, or off-site adoption events. The term ‘movement’ is applied to cats
 staying under the care of the RSPCA, while the term ‘transfer’ refers to cats whose care became
 the responsibility of the receiving organization. Adoption centers were operated by either RSPCA
 Queensland or by another organization (Northside Vet Care Outreach Adoption Centre in 2011),
 and they only rehomed animals, i.e., the full services of a shelter were not available. ‘Pet shops’
were both pet supply stores that RSPCA Queensland owned (e.g., World for Pets) and stores with
 agreements with RSPCA to stock only RSPCA Queensland animals (one Petbarn and one Pet Crazy
 store in 2011, and 39 Petbarn stores in 2016). Adoption events were one-day events (‘Pop-Up Adoption
 Event’ and ‘Big Adopt Out’) operated by RSPCA Queensland and held at external function centers.
 No adoption events were held in 2011, and 2 were held in 2016. Cats from RSPCA that were not
 adopted on the day were moved back to RSPCA Queensland shelters for rehoming. The Pop-Up
Adoption Event only included cats admitted to and under the care of RSPCA Queensland, while the
 Big Adopt Out was an event in which rescue groups could also bring cats for adoption, and those cats
 remained under the ownership and care of the rescue group. Cats contributed by rescue groups to the
 Big Adopt Out were not included in RSPCA Queensland statistics, nor in the current study data.
      In 2011, RSPCA Queensland’s headquarters were located at the Fairfield shelter. This shelter
was closed in December 2011, and the headquarters moved to the Wacol Animal Care Campus,
which started to admit cats in late 2011. From December 2010 to the end of January 2011, there were
 major flooding events that affected a large proportion of the areas of the state in which RSPCA
 Queensland operated. RSPCA Bundaberg functioned as a flood emergency center and a flood
 evacuation center temporarily operated at a university site at Rockhampton (under the management
 of RSPCA Queensland).
      RSPCA Queensland admission records were exported from ShelterMate©, RSPCA Queensland’s
 data management system [24] on 23 March 2017, and imported into Microsoft Excel for manipulation.
 Data obtained for each admission included cat identification number, name of shelter the cat was
 admitted to, date of admission, date of birth, and admission source. Admission sources were ‘stray’,
‘owner surrender’, ‘council contracts’, ‘transfers in’ (from non-contracted councils, veterinary surgeries
 and rescue groups), ‘ambulance’ (RSPCA’s animal ambulance service), ‘humane officer’ (cats seized by
 inspectors appointed under Queensland animal welfare legislation, with powers to investigate cases
Animals 2018, 8, 95 4 of 28
of animal cruelty and to enforce animal welfare law), ‘euthanasia request’ and ‘euthanasia request
with consent to rehome’ (cats surrendered to RSPCA specifically for euthanasia, but for the latter
category—only available in 2016—the owner gave permission for the cat to be rehomed if this was
possible and appropriate), ‘return’ (cats adopted but returned within 30 days to RSPCA as unsuccessful
adoptions), ‘shelter offspring’ (cats born in care), ‘dead on arrival’, ‘emergency boarding’, ‘bequest in
shelter’ (cats left in our care by someone’s estate), and ‘evacuation’ (cats looked after by RSPCA
Queensland during an emergency). Before their admission was resolved, some cats were temporarily
placed with carers in their homes, referred to as being in ‘foster care’.
Each admission was classified by outcome as reclaim (i.e., cat returned to owner), rehome
(adoption to new owner), transfer (to rescue group that rehomes animals), euthanasia (humanely
killed), died whilst in care, or ‘other’ (e.g., escaped or stolen). The reason for euthanasia was recorded
at the time of euthanasia (e.g., cat flu), and only one reason was recorded. Admissions where the
cat was still the responsibility of the RSPCA (including cats in foster care) were classified as being
‘in-care’. Rehoming was further classified as occurring from RSPCA Queensland shelters, RSPCA
Queensland-operated pet stores, commercial pet stores (through partnerships between RSPCA and
organizations such as Petbarn), and RSPCA-organized adoption events, and through adoption centers
(either RSPCA Queensland or independently operated). Some cats were moved between sites so
their admission site differed from their outcome site. These movements were to either adoption-only
centers, including pet supply stores, or to the RSPCA headquarters shelter because of its greater
adoption capacity (especially for kittens) and better medical and behavioral resources. For cats
moved between RSPCA sites after admission, the outcome occurred at that subsequent site, but it
is shown as an outcome for the admission site in relevant tables. Admission and outcome statistics
reported in our study differ slightly from those reported publically [23] due to differences in inclusion
criteria, including cats surrendered for euthanasia, and use of calendar year rather than financial year
for analyses.
2.2. Statistical Analyses
The unit of analysis was the individual admission, where a cat entering an RSPCA Queensland
shelter constituted one admission. Each admission ended when the cat was reclaimed, rehomed,
‘transferred to a rescue group, euthanized, died before release, or had another outcome (e.g., escaped or
stolen). Any particular cat could have multiple admissions. Three populations were used for analyses:
(1) All admissions were used for descriptive analyses; (2) When describing outcomes by the 90th day of
the admission (‘day 90’, in which day 1 was the day the cat was admitted) for all admissions, cats whose
outcome was not known by that day were not used; (3) A third, more restricted, population was used for
more detailed analyses of percentages of admissions in which the cat was rehomed, using admissions
in which the cat was available to be rehomed. For this latter population, the following admissions
were excluded: ambulance euthanasia requests, bequests (Pet Legacy Program [25]) and emergency
boarding, and admissions in which the cat was reclaimed, as these cats were not available for rehoming.
From this latter population, we also excluded admissions not resolved by day 90, and repeat admissions
of the same cat within the same calendar year (to minimize any clustering of outcome by admission
within cat). Owner surrenders requesting euthanasia were not offered the option of consent to rehome
in 2011, but this option was offered in 2016. All euthanasia requests, with and without consent to
rehome, were included for both years for consistency. Using cats that were available to be rehomed,
probabilities of an admission ending in the cat being rehomed by day 90 were compared separately
by age at admission and admission source, using generalized linear models with the log link and
binomial error distribution. Iterated reweighted least-squares (IRLS) optimization of the deviance was
used. Models were fitted using the -binreg- command in Stata (version 15, StataCorp, College Station,
TX, USA). Exponentiated coefficients from these models were interpreted as risk ratios. Year and
either age category at intake or animal admission source were fitted, along with interaction terms with
year. The overall p-values for the interaction terms were assessed using joint Wald tests, using Stata’sAnimals 2018, 8, 95 5 of 28
‘-testparm-’ command. For calculation of numbers of admissions per 1000 human residents, human
population sizes in 2011 and 2016 for the local government area (council) in which the shelter operated
were used [26].
3. Results
3.1. Number and Source of Admissions
The number of cat admissions (‘admissions’) to RSPCA Queensland shelters decreased by only 5%
from 2011 to 2016, from 13,911 to 13,220 (Table 1). There were also minimal changes in the numbers and
percentages of admissions contributed by two of the three largest sources of cats: ‘stray’ (4295 versus
4144, 30.9% versus 31.3% of admissions in 2011 and 2016, respectively), followed by ‘council contracts’
(2715 versus 2492, 19.5% versus 18.9%) (Table 1). In contrast, the number and percentage of admissions
that were from ‘owner surrender’ were halved from 2011 to 2016 (from 4221 versus 2075; 30.3% to 15.7%).
The number and percentage of admissions in which the cat was ‘transferred in’ from non-contract councils,
veterinarians, and rescue groups increased from 679 (4.9% of admissions) in 2011 to 1553 (11.7%) in 2016.
The number and percentage of ambulance admissions almost doubled from 2011 to 2016 (from 682 and
4.9% to 1209 and 9.2%, respectively) (Table 1).
Table 1. Sources of cat admissions into RSPCA Queensland shelters for the years of 2011 and 2016 and
numbers and percentages rehomed by day 90 and associated risk ratios.
Distribution of Admissions % Rehomed by Day 90
Source 2011 2016 Percentage 2011 2016
Risk Ratio b 95% CI p
(n = 13,911) (n = 13,220) Change a (n = 12,372) (n = 10,954)
31% 76% 0.81 to
Stray 31% (4295) 31% (4144) −4% 0.83Animals 2018, 8, x 6 of 26
Animals 2018, 8, 95 6 of 28
Wacol Animal Care Campus (3333, 25.2% of admissions in 2016). Approximate numbers of
admissions per 1000 human residents varied between shelters across the state and over time and
residents
ranged varied
from between
1 (Noosa) toshelters acrossin
36 (Gympie) the2016.
stateDuring
and over time andflooding
extensive ranged from 1 (Noosa)
in 2011, RSPCA to Bundaberg
36 (Gympie)
in 2016. During extensive flooding in 2011, RSPCA Bundaberg functioned as a flood emergency
functioned as a flood emergency center, and the number of admissions was nearly four times higher center,
and
in thethan
2011 number of admissions
in 2016 (1631 versuswas nearly four times higher in 2011 than in 2016 (1631 versus 464).
464).
3.1.2. Admissions by Time of Year
3.1.2. Admissions by Time of Year
In 2011, monthly numbers of cat admissions (expressed as percentages of the year’s admissions)
In 2011, monthly numbers of cat admissions (expressed as percentages of the year’s admissions)
peaked in March (1557, 11% of the year’s admissions), following a substantial drop in February, likely
peaked in March (1557, 11% of the year’s admissions), following a substantial drop in February, likely
associated with widespread flooding in Queensland. Numbers of admissions per month were less
associated with widespread flooding in Queensland. Numbers of admissions per month were less
variable in 2016 with the highest percentages of the year’s admissions occurring in January, April,
variable in 2016 with the highest percentages of the year’s admissions occurring in January, April, and
and November, each with approximately 10% of admissions (Figure 1). However, for both years,
November, each with approximately 10% of admissions (Figure 1). However, for both years, numbers
numbers of admissions were lowest in late winter and early spring (i.e., August and September in
of admissions were lowest in late winter and early spring (i.e., August and September in 2011 and July
2011 and July to September in 2016, with 6–7% of the year’s admissions in each of these months) and
to September in 2016, with 6–7% of the year’s admissions in each of these months) and were highest in
were highest in the warmer months (November to May, with 8–11% of the year’s admissions in each of
the warmer months (November to May, with 8–11% of the year’s admissions in each of these months).
these months).
Figure 1. Percentages of the year’s admissions to RSPCA Queensland shelters for 13,911 cat admissions
Figure 1. Percentages of the year’s admissions to RSPCA Queensland shelters for 13,911 cat
in 2011 (upper graph; grey line) and 13,220 admissions in 2016 (black line) by calendar month of
admissions in 2011 (upper graph; grey line) and 13,220 admissions in 2016 (black line) by calendar
admission and, in lower graph, percentages rehomed by day 90 after admission for admissions in
month of admission and, in lower graph, percentages rehomed by day 90 after admission for
which the cat was available to be rehomed for 12,372 admissions in 2011 (grey bars) and 10,954
admissions in which the cat was available to be rehomed for 12,372 admissions in 2011 (grey bars)
admissions in 2016 (black bars).
and 10,954 admissions in 2016 (black bars).
3.1.3. Admissions by Desex Status, Feral Status, and Age
3.1.3. Admissions by Desex Status, Feral Status, and Age
Desex status was recorded for 86% (11,972) and 95% (12,533) of admissions in 2011 and
Desex status was recorded for 86% (11,972) and 95% (12,533) of admissions in 2011 and 2016,
2016, respectively (Table 2). Of cats whose desex status was known, most were not desexed on
respectively (Table 2). Of cats whose desex status was known, most were not desexed on admission—
admission—77% (9165) in 2011, and 73% (9116) in 2016. The cat’s date of birth was not recorded for
77% (9165) in 2011, and 73% (9116) in 2016. The cat’s date of birth was not recorded for 5607
5607 admissions (40%) in 2011 and for 1496 admissions (11%) in 2016. Of the 6217 admissions in 2016
admissions (40%) in 2011 and for 1496 admissions (11%) in 2016. Of the 6217 admissions in 2016
known to be adult cats (≥17 weeks of age) of known desex status, 42% (2642/6217) were desexed,
known to be adult cats (≥17 weeks of age) of known desex status, 42% (2642/6217) were desexed, and
and the proportion was higher for owner-surrendered (58%; 668/1,157) compared with stray (29% or
the proportion was higher for owner-surrendered (58%; 668/1,157) compared with stray (29% or
472/1628) and council (28%; 357/1296) admissions. There was a small change in the proportions of
472/1628) and council (28%; 357/1296) admissions. There was a small change in the proportions of
admissions that were female from 2011 (53%) to 2016 (50%).
admissions that were female from 2011 (53%) to 2016 (50%).Animals 2018, 8, 95 7 of 28
Table 2. Numbers of cat admissions into RSPCA Queensland shelters by sex, desexed status, and feral
status (n = 13,911 and 13,220 in 2011 and 2016, respectively) and percentages of those admissions in
which the cat was rehomed by day 90 for admissions in which the cat was available to be rehomed
(n = 12,372 and 10,954 in 2011 and 2016, respectively).
Factors Distribution of Admissions % Rehomed by Day 90
2011 (n = 13,911) 2016 (n = 13,220) 2011 (n = 12,372) 2016 (n = 10,954)
Sex
Female 53% (6619) 50% (6414) 39% (2252/5840) 82% (4338/5271)
Male 47% (5868) 50% (6362) 40% (2082/5143) 77% (4082)/5271
Not recorded (1424) (444) 0% (1/1389) 2% (7/412)
Desexed status at admission
Entire 77% (9165) 73% (9116) 42% (3543/8523) 82% (6727/8158)
Desexed 23% (2807) 27% (3417) 38% (789/2052) 78% (1698/2173)
Not recorded (1939) (687) 0% (3/1797) 0% (2/623)
Feral status at admission
Not feral * 92% (12,757) 99% (13,048) 38% (4306/11,228) 78% (8374/10,801)
Feral 8% (1154) 1% (172) 3% (29 # /1144) # 35% (53 # /153) #
* Includes admissions in which feral status was not recorded as 2270 cats in 2011 and 1619 cats in 2016. # Feral status
was determined at admission. Cats deemed to be feral were never rehomed; for those that were rehomed, the cat
was reclassified as not feral after a period in the shelter.
RSPCA Queensland classification of feral status was mainly based on the cat’s behavior and
absence of identification; cats with no identification, exhibiting non-social behavior, and not settling in
their cage within 24–72 h were usually classified as feral. The number and proportion of admissions
classed as feral on entry to the shelters decreased substantially from 8% (1154) of admissions in 2011 to
1% (172) in 2016 (Table 2).
Of admissions in which the cat’s date of birth was recorded (8304 and 11,724 in 2011 and 2016,
respectively), 57% (4752) were kittens (i.e., agedAnimals 2018, 8, 95 8 of 28
Animals 2018, 8, x 8 of 26
3.2. Outcomes
3.2. Outcomes
3.2.1.
3.2.1.General
General
Admissions
Admissionswerewereresolved
resolvedby byday
day90 90for
for13,252
13,252and
and12,228
12,228admissions
admissions(95%
(95%and
and92%92%ofofall
all
admissions) in 2011 and 2016, respectively (Table A2). Outcomes for these admissions are reportedin
admissions) in 2011 and 2016, respectively (Table A2). Outcomes for these admissions are reported
inTables
Tables 4–6
4–6 and
and Figure
Figure 2. 2. Results
Results byby site
site are
are reported
reported inin Tables
Tables A3–A5.
A3–A5.
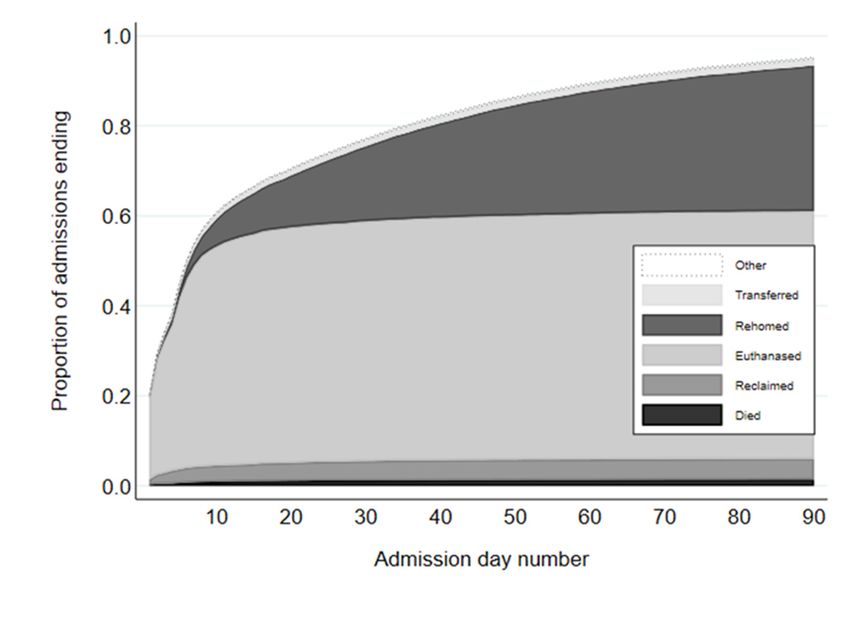
Figure 2. Stacked cumulative proportions of cat admissions to RSPCA Queensland shelters by outcome
Figure
by day2.of Stacked cumulative
admission proportions
(in which day 1 was theofday
catthe
admissions to RSPCA
cat was admitted) Queensland
for the years 2011shelters by
(upper) and
outcome by day of admission (in which day 1 was the day the cat was admitted) for the years 2011
2016 (lower).
(upper) and 2016 (lower).
3.2.2. Reclaim
3.2.2. Reclaim
Reclaim percentages were very low and similar across both years. Only 5% of all admissions
Reclaim
resolved percentages
by day were veryinlow
90 were reclaimed eachand similar
of 2011 andacross both years. and
2016 (644/13,252 Only 5% of all admissions
663/12,228, respectively;
resolved by day 90 were reclaimed in each of 2011 and 2016 (644/13,252 and 663/12,228, respectively;
Table 4). Excluding admissions that were owner surrenders, percentages of admissions that were
Table 4). Excluding
reclaimed were 6.4%admissions
(586/9177)that were
in 2011 andowner
6.3% surrenders,
(644/10,299)percentages
in 2016. of admissions that were
reclaimed were 6.4% (586/9177) in 2011 and 6.3% (644/10,299) in 2016.Animals 2018, 8, 95 9 of 28
Table 4. Distribution of outcomes of cat admissions for all admissions to RSPCA Queensland shelters
in 2011 and 2016 and the percentage of each resolved by day 90 of admission.
2011 2016
Outcome Number of Number of
% of Admissions 1 % of Admissions 1
Admissions Admissions
Reclaimed 644 4.9% 663 5.4%
Rehomed 4510 34.0% 8996 73.6%
Euthanized 7656 57.8% 1826 14.9%
Transferred to rescue group 206 1.6% 279 2.3%
Died before released 193 1.5% 386 3.2%
Other (escaped or stolen) 43 0.3% 78 0.6%
In care (admission not resolved by day 90) 659 992
Total 13,911 100.0% 13,220 100.0%
1 Percentages of those admissions that were resolved by day 90.
3.2.3. Rehomed
Of admissions in which the outcome was known by day 90 of admission, the percentage ending
in the cat being rehomed more than doubled from 34% (4510) in 2011 to 74% (8996) in 2016 (Table 4).
The number of RSPCA Queensland sites rehoming cats increased by 2 when comparing 2011 to
2016. Also, the headquarters shelter site moved from Fairfield to Wacol at the end of 2011. In both years,
the organization headquarters sites rehomed the largest number of cats: Fairfield in 2011 (1394, 39.6% of
admissions resolved by day 90 were rehomed) and Wacol in 2016 (1826, 58.1%, Tables A3 and A4).
There was a marked increase in the number of commercial pet supply shops operating as cat adoption
centers from two stores in 2011 to 39 stores in 2016. Accordingly, substantially more cats were rehomed
through commercial stores, with the number rehomed from Petbarn increasing from 86 to 1503 cats;
the latter represented 17% of all cats rehomed in 2016 (Table A5). One-day adoption events (‘Pop-up
Adoptions’ and ‘Big Adopt Out’) occurred only in 2016, and 387 cats were rehomed from those two
events (Table A5). Importantly, the number of admissions in which the cat was rehomed through
RSPCA sites increased from 4272 to 6999, a 64% increase, and the number rehomed from non-shelter
sites increased from 238 to 1997, a 740% increase, and this latter method of rehoming accounted for
22% of all admissions rehomed in 2016 compared to 5% in 2011 (Table A5). Thus, of the increase in
number of admissions rehomed of 4486 (i.e., from 4510 to 8996; Table 4), 61% (2727/4486) was due
to an increase in numbers of admissions rehomed from shelter sites and 39% (1759/4486) was due to
increased numbers of cats rehomed from non-shelter sites (Table A5).
Of the 13,911 admissions in 2011 and 13,220 in 2016, 89% (12,372) and 83% (10,954), respectively,
were used for more detailed analyses of rehoming by day 90; these were admissions in which the cat
was available to be rehomed excluding repeat admissions of the same cat within the same calendar
year. Percentages of these admissions in which the cat was rehomed by day 90 increased from 2011 to
2016 for all admission sources (Table 1). The greatest increase was for ‘council’ from 29% of council
admissions (707) in 2011 to 82% (1766) in 2016 (Table 1). Effects of source differed significantly by year
(p for interactionAnimals 2018, 8, 95 10 of 28
proportion of admissions being from owner surrender or transfer in, the two sources with the highest
rehoming percentages. In 2016, 28% of admissions were from one of these sources compared to 35% in
2011 (Table 1).
Of admissions in which the cat was available to be rehomed, all age group categories had higher
percentages of admissions rehomed by day 90 in 2016 compared to 2011 (Table 3). The largest increase
was in cats aged 7 years or older, from 17% to 44% (Table 3). Effects of age differed significantly by year
(p for interactionAnimals 2018, 8, 95 11 of 28
3.2.6. Euthanized
Numbers of admissions that ended in euthanasia by day 90 substantially decreased from 7656 in
2011 to 1826 cats in 2016, representing a decrease from 58% to 15% of admissions that were resolved by
day 90 (Table 4). Euthanasias predominantly occurred by day 8 after admission in 2011 (84% of all
admissions were euthanized by day 90), whereas more euthanasias were delayed in 2016 (day 25 to
reach 84% of all admissions euthanized by day 90, Figure 2). In 2011, the three most common reasons
for euthanasia were ‘behavioral and feral’ (36% of euthanasias), ‘medical’ (32%), and ‘age/space
limitations’ (30%) (Table 6). However, in 2016, there was a marked decrease in the percentage of
euthanasias that were for ‘behavioral and feral’ (22%), and ‘age/space limitations’ reasons (2%),
with most euthanized being for ‘medical’ reasons (69%). Numbers of cats euthanized for behavioral
reasons (including feral cats) decreased from 2771 to 393. About 44% of this reduction of 2378 cats was
due to fewer euthanasias because the cat was deemed feral, with the number decreasing from 1178 to
132 (Table 6). Of the 13,252 and 12,228 admissions resolved by day 90 in 2011 and 2016, respectively,
for 8.9% and 1.1%, the cat was euthanized because it was deemed to be feral. Numbers of cats
euthanized for ‘age/space limitations’ reasons also significantly decreased, from 2303 cats to 32 cats in
2016; over half of this reduction was due to fewer kittens aged less than 4 weeks being euthanized
(1309 to 15). The number of cats euthanized for medical reasons decreased nearly by half (2454 to
1252), but constituted a bigger percentage (69%) of those euthanized in 2016. The number of cats
euthanized based on humane grounds more than doubled from 434 cats to 971 cats, which constituted
the largest single category of cats euthanized for medical reasons in 2016. Similarly, the number of
feline immunodeficiency virus (FIV) positive cats that were euthanized increased markedly from 87 to
316 cats and constituted 17% of all cats euthanized in 2016.
In 2016, percentages of cats euthanized by day 90 varied by site from 3.4% to 25% (Table A3).
Although the headquarters site (Wacol) had the highest euthanasia percentage in 2016 (2.1 times that
for other RSPCA sites pooled), after adjustments simultaneously for both age category and source of
admission, using a generalized linear regression model as described above, but also with standard
errors adjusted for clustering of admission within cat, for admissions to Wacol, the cat was only
1.1 times more likely to be euthanized than admissions to other RSPCA sites pooled. Therefore,
the higher percentage euthanized at Wacol relative to other RSPCA sites pooled was almost entirely
accounted for by source (particularly the much higher proportion of admissions that were ambulance
admissions and the much lower proportion that were transfers in from other organizations) and
differences in age category (particularly the higher proportion of admissions that were old (7 years or
older) cats and the much lower proportion of admissions that were aged 7 w to 1 year), with source
accounting for most of the difference.
Table 6. Summary of the medical and surgical reasons that cats were euthanized at RSPCA Queensland
shelters for the years 2011 and 2016 for admissions in which the cat was euthanized by day 90 after
admission; (b) summary of the age and behavioral reasons for which cats were euthanized at RSPCA
Queensland shelters for the years 2011 and 2016 for admissions in which the cat was euthanized by
day 90 after admission.
2011 2016
Reason for Euthanasia Number % of All Number % of All
Euthanized Euthanized Euthanized Euthanized
Medical/Surgical 2454 32.1% 1252 68.5%
Cat flu 920 12.0% 128 7.0%
Humane grounds ˆ 434 5.6% 971 34.3%
Ringworm 328 4.3% 4 0.2%
Injured 195 2.5% 35 1.9%
Cat flu exposure 160 2.1% 1 0.1%
FIV-positive 87 1.1% 316 17.3%
Idiopathic alopecia 84 1.1% 2 0.1%Animals 2018, 8, 95 12 of 28
Table 6. Cont.
2011 2016
Reason for Euthanasia Number % of All Number % of All
Euthanized Euthanized Euthanized Euthanized
Tick paralysis 67 0.9% 2 0.1%
Dental disease 30 0.4% 2 0.1%
Malignant neoplasia 28 0.4% 32 1.8%
Neuropathy 14 0.2% 44 2.4%
Orthopedic disease 14 0.2% 18 1.0%
Obese 11 0.1% 0 0.0%
Cardiac disease 10 0.1% 18 1.0%
Ocular disorder/disease/blind 9 0.1% 4 0.2%
Failed treatment 9 0.1% 0 0.0%
Deaf 8 0.1% 0 0.0%
Paralysis 8 0.1% 5 0.3%
Demodex 7 0.1% 0 0.0%
Flea bite allergy 7 0.1% 0 0.0%
Incontinence 6 0.1% 1 0.1%
Lack of pigmentation 4 0.1% 0 0.0%
Spinal trauma 3 0.0% 9 0.5%
Chronic ear infection 3 0.0% 0 0.0%
Excessive scarring 3 0.0% 1 0.1%
Ear mites 2 0.0% 0 0.0%
Head trauma 2 0.0% 0 0.0%
Heartworm positive 1 0.0% 0 0.0%
Hyper reactivity to stimuli 0 0.0% 4 0.2%
Age/Shelter Number Related 2308 30.1% 32 1.8%
Shelter was full 765 10.0% 0 0.0%
Too young (i.e.,Animals 2018, 8, 95 13 of 28
3.2.7. Live Release
There was a substantial increase in the number and proportion of cat admissions that were released
alive by day 90, that is, reclaimed, rehomed, or transferred to rescue groups by day 90, from 5360
(40% of the 13,252 admissions that were resolved by day 90) to 9938 (81% of 12,228 admissions; Table 4).
The proportion in which the outcome was resolved by day 90 varied between RSPCA shelters from
83% to 98% (Table A2).
3.2.8. Movements between RSPCA Sites
Cats were moved between RSPCA sites (i.e., their outcome site was an RSPCA site but differed from
their admission site) more commonly in 2016. In 2011, of the 13,255 admissions with both admission and
outcome sites recorded and resolved by day 90, for 778 (5.9%) the cat was moved internally compared
to 1351 (11.1% of 12,228 admissions) in 2016. These movements were to a range of sites in 2011. In 2016,
most (82.2% or 1110) were to the headquarters shelter for adoption; movements commonly involved
kittens, and cats moved for medical or behavioral treatment at the headquarters shelter.
4. Discussion
The aim of this retrospective study was to identify changes that contributed to the markedly
improved outcomes for cats in RSPCA Queensland shelters by comparing 2016 to 2011. The greatest
contributor to the increase in number of admissions ending in live release was a marked increase in
the number and proportion of admissions in which the cat was rehomed (i.e., adopted). The numbers
of cats adopted in 2016 was double that in 2011, with over half of the increase contributed to by
increased shelter adoptions, and the remainder of the increase achieved by increased numbers of off-site
adoptions, largely through agreements with Petbarn stores. These improved outcomes were associated
with nearly a doubling in the number of admissions in which the cat was fostered. The number of
cats euthanized for behavioral reasons decreased to one seventh, and number of kittens euthanized
decreased from 1305 to only 22 in 2016. The total number of admissions was only marginally less in
2016, and the number of cats reclaimed by owners was similar for the two years and was only a small
contributor to the number of admissions ending in live release.
4.1. Cat Admissions
There was small decrease in cat admissions from 2011 to 2016 (13,911 to 13,220 cats), although numbers
in both years were lower than the average annual intake of 16,868 cats reported for 2006 to 2008 for RSPCA
Queensland [4], and lower than the mean intake of 15,861 cats from 1999 to 2016 (SEM ± 681) [3]. There was
marked variation between sites in approximate intake per 1000 residents (from 1 to 36 in 2016). For all
sites with admissions greater than 10 cats/1000 residents, the RSPCA had the contract for the council
pound and was the main organization in the area accepting cats. The average annual intake for shelters
and pounds combined in Australia was reported to be 7 admissions/1000 residents based on 2011–2012
data [27]. Not surprisingly, in the USA, annual numbers of admissions are closely correlated with number
of cats euthanized in shelters and municipal facilities [28]. To further reduce euthanasia, locations where
RSPCA admission numbers are high warrant substantial resources to decrease the numbers of stray and
owner-surrender admissions.
4.1.1. Sources of Admission
In both years, strays found by the general public were the largest source of cat admissions into RSPCA
Queensland shelters (approximately 31%), followed by admissions via council contracts (approx. 19%);
these are also all strays (but not received directly by the RSPCA from the public). Many of the transfers-in
(which constituted 12% of admissions in 2016) and nearly all ambulance admissions (9% of admissions in
2016) were presumably also stray, suggesting at least 50%, and potentially up to 70%, of cat admissions
in 2016 were strays. These results are comparable to a 2006 to 2008 RSPCA Queensland study thatAnimals 2018, 8, 95 14 of 28
reported 54% of cats admitted were strays from either the public or council contracts [4]. Similarly,
in a Melbourne-based shelter study in 2009, the majority of cat admissions (82%) were strays [29].
Unlike dogs, cats admitted to RSPCA shelters do not undergo a formal behavioral assessment.
However, if they display behavioral traits that may affect their suitability for rehoming, they are
referred to the RSPCA Queensland Animal Rehabilitation Team for assessment. Most of the admitted
stray cats were socialized to people, as evidenced by the low euthanasia rate for behavioral reasons.
The urban stray cat population consists of abandoned, wandering, or lost owned cats, unowned
cats and cats that can be classified as semi-owned [30,31]. Semi-owned cats are provided with care,
typically food, by people who care for the cat but do not perceive themselves to be the owner. Previous
Australian studies have found that 22% of households fed a cat that was not their own [32], and 9%
of respondents to an internet survey fed unowned cats on a daily basis [33]. The majority of these
semi-owned cats were not desexed, and compared with owned cats, a greater proportion had produced
kittens in the study [32]. In USA, it is estimated in urban areas there are at least 60 semi-owned cats
per 1000 residents [30,31,34,35], and semi-owned cats are thought to constitute a large proportion of
shelter admissions of stray cats in USA and Australia [29,33,36–38].
Substantial reductions in numbers and percentage of cats euthanized are being achieved in USA,
where desexing programs for stray and semi-owned cats are used to decrease admission numbers of
stray cats into shelters [38]. In one study, when a high proportion of stray cats were desexed in the
target area (>50%), numbers of cat admissions to shelters in the area decreased from 13 to 4 cats/1000
residents over two years compared to a decrease from 16 to 14 cats/1000 residents in the non-target
area, and numbers of cats euthanized decreased markedly from 8 to 0.4 cats/1000 residents [37].
In community cat desexing programs (in the USA also called diversion programs), stray cats are either
trapped or identified as unsocialized within a shelter and desexed, and clinically healthy cats are
returned to their home location (trap, neuter, and return or ‘TNR’; and shelter, neuter, and return
or SNR). The return of desexed, unsocialized cats to their home range is based on the premise that
they may be semi-owned, or even wandering owned cats [39]. Evidence suggests that 75% of lost
cats are found within 500 meters of their home [40], and cats are 7 to 13 times more likely to return
home than be reunited with their owner from the shelter [41]. In most TNR programs, kittens and
friendly adults are usually removed for adoption. For shelters to achieve euthanasia of ≤5–10% for
cats, these programs will likely be important, given the substantial proportion of kitten and adult
cat intake that is strays. However, releasing unowned cats into the community (whether desexed or
not) is currently illegal without a permit in most Australian states, because of legislation relating to
abandonment of cats or feral pest legislation [36]. Australian research is required to determine the
efficacy of these programs to decrease numbers of stray cats in urban areas, to assess their impact on
shelter intake and numbers euthanized, and to evaluate the impact on local wildlife ecology.
Ambulance admissions nearly doubled due to more ambulances on the road and the use of
volunteer drivers (meaning the ambulances were operating more hours). The area serviced by RSPCA
ambulances also increased to include the Ipswich council area. After implementation of a community
cat desexing program in Albuquerque, USA, calls to municipal services for dead cats in the city
declined by 45% [42]. Therefore, numbers of injured cats requiring ambulance services would also be
expected to decrease.
The annual number of owner-surrendered admissions halved from 4221 to 2075 cats from 2011 to
2016. This may have been due to surrender diversion strategies implemented by RSPCA Queensland
in 2016, in which owners intending to surrender their cat were assisted in retaining their pet by
providing help and advice towards resolving the underlying reasons prompting surrender, or were
assisted in rehoming it themselves without admission to RSPCA. These strategies included an RSPCA
Queensland web page to help cat owners access resources to resolve underlying issues leading to
surrender, including medical and behavioral problems [43]. The website also provided information
on how owners can rehome their pet and had links to reputable rescue groups. Commencing in 2012,
owners were also required to have an appointment with RSPCA staff prior to relinquishing their petAnimals 2018, 8, 95 15 of 28
to discuss options to deter impulse surrenders. In the USA, programs aimed at reducing numbers
of shelter admissions by supporting owners with counselling for behavior problems and financial
assistance for health problems and cat licensing costs (not required in most parts of Queensland)
are effective at decreasing the number of cats surrendered by owners [41]. In one US report, 70% of
owners offered support elected to keep their pet, and the estimated average cost of averting a pet
from being admitted to a shelter was $US50 [44–46]. Therefore, such programs are likely to be
cost-effective, given that shelter costs in Australia for a cat rehomed after one week were estimated at
$756 (cat admission, basic health care, desexing, housing for one week, etc.), plus, for cats for whom
rehoming takes longer than one week, costs include a further $385 for each extra week of shelter care
including environmental enrichment [47].
4.1.2. Admissions by Time of Year
Numbers of adult cat and kitten admissions combined were lowest in late winter and early
spring in both years and highest in the warmer months (November to May). This annual cycle of
admissions is consistently reported [4,8] and is due to a spring-summer influx of kittens, reflecting
the cat’s breeding cycle [10,48], rather than changes in numbers of adult cat admissions [8]. Desexing
programs targeted for autumn and winter, and to areas of high intake of stray and owned kittens,
are recommended to prevent kittens born the previous spring and summer from producing kittens the
following spring and summer. The later peak in 2011 was likely to have been a consequence of flood
events in January/February of that year.
4.1.3. Admissions by Desex, Feral Status, and Age
Only 27% of cat admissions in 2016, and 42% of adult cat admissions (where the cat was ≥17 weeks
of age), were desexed prior to admission. This is similar to another RSPCA Queensland study of cat
admissions from 2006 to 2010, in which 36% of cats and 50% of adult cats of known desex status were
desexed [4]. Desexing programs are an important strategy used to reduce cat populations and stray
cat admissions [9,49]. For example, free desexing programs in USA targeted to the most underserviced
communities with the highest cat admissions increased desexing rates to the average for USA (90%),
and reduced cat shelter admissions and euthanasia [50]. In contrast, other publications were unable
to demonstrate the direct impact of desexing programs on shelter admissions due to confounding
relationships between variables [50]. However, as these authors highlighted, there have been no
known scientific papers or credible cases presented, either theoretical or empirical, that argue against
a negative relationship between shelter intake and percentage of cats desexed in the intake area.
The analyses of cat admissions by age categories were limited in our study because 40% of the
2011 (and 12% of 2016) cat admissions did not have age recorded. Nevertheless, for those with ages
recorded, the proportion of admission that were kittens (i.e., aged < 17 weeks) was greater in 2011 (57%)
than in 2016 (46%) and was similar to the 54% reported from 2006 to 2008 for RSPCA Queensland [4].
The largest age category of cats admitted in 2011 was estimated to be young kittens four to seven
weeks old, which represented 26% of intake, but was 17% of admissions in 2016. This reduction may
have been due, in part, to diversion programs commencing in 2012, in which staff encouraged the
general public intending to surrender owned or stray cats and/or their kittens to keep kittens with
the dam until they reached adoption age before surrendering them. We estimate that strays represent
approximately 54% to 76% of kitten admissions, and therefore desexing programs targeting stray and
semi-owned cats are important to achieve further reductions in intake of kittens.
4.2. Outcomes
The greatest change between the two years studied was a marked increase in the percentage of
admissions in which the cat was rehomed, which almost doubled (34% to 74% of intake), and a subsequent
reduction in percentage euthanized, from 58% to 15%, and as a consequence, an increase in live release
percentages from 39% to 81%.Animals 2018, 8, 95 16 of 28
4.2.1. Rehomed
The number and percentage of admissions in which the cat was rehomed improved substantially
for all age groups, and for kittens and cats from 4 weeks to 2 years of age, 91% were rehomed in 2016.
The percentage rehomed in 2016 was lowest for cats 7 years of age and older (44%) and for young
pre-weaned kittens less than four weeks (66%), although those percentages rehomed doubled from
2011 to 2016. Unweaned kittens less than 4 weeks of age or under 500gms body weight are challenging
to manage in a shelter setting because of both their underdeveloped immune systems and the resources
required to manage them, such as feeding every 2 to 4 h and manual stimulation of defecation and
urination [51]. However, kitten nurseries devoted to caring for these at risk kittens are achieving 87%
of kittens surviving and being rehomed in USA [8,14]. Between 2011 and 2016, RSPCA Queensland
expanded their foster care system to manage most of these kittens, together with a small kitten nursery
at the headquarters shelter. Appropriate age-specific kitten nursing protocols were implemented to
increase survival probabilities of very young kittens.
Off-site adoptions and adoption events were major contributors to the increased rehoming
percentage; these accounted for only 5% of rehomings in 2011, but 22% of rehomings in 2016. This was
largely due to the expanded retail partnerships with Petbarn from one to 39 stores in 2016, accounting
for an increase from 86 to 1503 adoptions. Another smaller contributor to the increased rehoming
percentage in 2016 was two one-day adoption events that rehomed 387 cats; neither were held in 2011.
In addition to the number of cats rehomed at the adoption events, the associated marketing likely
increased awareness, which might have contributed to increased numbers of in-shelter adoptions.
More than half the increase in adoptions occurred in-shelter and was facilitated by a greatly expanded
advertising budget from $0 in 2011 to $40,000 in 2016. Innovative advertisements were associated
with higher than normal adoptions. For example, the “Geek Chic” campaign was a digital campaign
that aimed to target on-line gamers (people who spend time on the Internet playing games, usually in
a virtual community). It generated 2367 ‘clicks’ on the RSPCA Queensland’s cat adoption web pages
by both gamers (35%) and non-gamers and RSPCA page connection audiences who clicked on the
page (65%) [52]. The campaign cost $3,567 and resulted in the adoption of 611 cats. Given that every
extra week in shelter care is reported to cost approximately $385/cat [47], reducing length of stay by
2 weeks would result in a saving of $470,470 for 611 cats, so this campaign was extremely cost effective.
Earlier adoption also results in better welfare for the cats; less time in shelter means less stress and less
risk of contracting a contagious disease.
4.2.2. Reclaim
Cats reclaimed by the owner were not a contributor to the decreased euthanasia percentage,
because the numbers and percentages of admissions in which the cat was reclaimed were very low in
both years, and only marginally improved in 2016 (from 644 to 663 cats, or from 4.6% to 5.4% of intake).
These findings are consistent with previous reports whose reclaim percentages for cats are very low
both in Australia at 5% [3] and the USA at 2% [14]. Strategies aimed at improving the number of cat
admissions reclaimed include mandatory microchipping in Australia [53] and USA [15]. However,
a recent RSPCA Queensland study found that only 9% of incoming stray cats were microchipped,
and 37% of microchips had inaccurate information (e.g., registered to a previous owner, wrong phone
numbers) [54]. This highlights the need for low-cost and free microchip events targeted to locations of
high stray intake, to increase the number of owned cats with microchips and correct owner contact
information. In Victoria, microchipping has been mandated longer than in Queensland (2005 versus
2008), and cats also have to be registered (licensed) with the council. In Victoria, 66 of the 79 councils
reported reclaim percentages on their respective websites; they averaged 13% for cats, and the top
quartile of councils had 17% to 59% of cats reclaimed [55].Animals 2018, 8, 95 17 of 28
4.2.3. Foster
The number of cats fostered nearly doubled from 2747 in 2011 to 4732 cats in 2016, and in
2016, 78% of cats that were fostered were rehomed within 90 days. In 2011, if a cat failed the initial
behavioral assessment by displaying avoidance and/or low social behaviors, it was often deemed
inappropriate for rehoming, and so was euthanized. In contrast, in 2016, many more such cats were
fostered and given the opportunity to develop or demonstrate social behaviors, and were subsequently
rehomed [56]. Fostering is a highly effective method for preparing cats for rehoming, and while in foster
care, health problems can also be treated [17,57,58]. Foster care can provide greater environmental
enrichment, with consequent beneficial effects on social behavior and health [59,60]. Utilization of
temporary foster care markedly improved odds of live release for dogs, and resulted in a 70% reduction
in the prevalence of major or minor health or behavior concerns compared to the prevalence in the same
dogs before they were fostered [61]. Foster care is particularly valuable for improving the outcomes
of older cats, which typically have longer length of stay in shelters, and as in our study, have higher
euthanasia rates [62]. Foster carers, through their social networks, can also increase the number of
potential adopters available. In both years of our study, about half of the cats fostered were placed
in foster care by day 3 of admission to the shelter. RSPCA Queensland has been very successful in
recruiting foster carers (usually volunteers), and resources directed at increasing foster care placement
will subsequently further increase the number of cats rehomed. However, for cat fostering to be
successful, foster carers require training and advice, resources to care for cats, and behavioral support,
such as RSPCA Queensland’s foster family network [63], which is an exemplar that could be adopted
by other shelters and welfare groups. Although not classed as being in foster care, some timid cats and
those not coping well within the shelter environment were brought into staff offices to provide a more
home-like environment and greater human interaction.
4.2.4. Transferred to Rescue Groups
Cat rescue groups typically foster cats in volunteers’ homes, and their aim is to aid in the
rehabilitation and rehoming of cats [57,64]. Rescue groups help to reduce the numbers of cats in
shelters and expose cats available for rehoming to a larger network of potential adopters beyond
the shelter [58,59]. In Queensland, over the study period, there was a growing number of cat rescue
groups, but they were often at capacity, as they also receive cats from other sources (e.g., council
pounds, owner surrender, etc.), hence the low number transferred to rescue groups.
4.2.5. Euthanasia
There has been a continuing reduction in euthanasia across RSPCA shelters [3], and this was
reflected in significantly decreased numbers and percentages of cats euthanized from 7656 and 58%
to 1826 and 15% from 2011 to 2016. In 2011, decisions to euthanize cats occurred sooner following
admission (e.g., 84% of the 7656 admissions where the cat was euthanized occurred within 8 days
of admission compared with 25 days for 84% of the 1826 admissions euthanized in 2016). Factors
leading to the decision to euthanize included age, poor social behaviors, being classified as feral,
medical reasons, and space limitations. The percentages of euthanasias for these reasons decreased
from 2011 to 2016, with no cats euthanized for space limitations in 2016. The decrease in percentages
and numbers euthanized was achieved by increasing capacity through an expanded foster network,
by increasing distribution for rehoming through partnerships with pet shops, and by moving cats and
kittens between shelters to sites of higher demand. For example, kittens continue to be born in the
tropical part of the state in winter when none are being born in the southern areas and are moved
south to satisfy continued demand.
One aspect of assessing a cat’s suitability for rehoming was based on the behavior the cat
displayed, assessed first by the veterinarians at admission (e.g., ‘feral’) and later whilst in the shelter
environment by the behavioral assessment team (e.g., ‘timid’). Differentiating between behaviorsYou can also read