Changing user needs and motivation to visit a website through ad experience: a case study of a university website
←
→
Page content transcription
If your browser does not render page correctly, please read the page content below

Journal of Physics: Conference Series

PAPER • OPEN ACCESS

Changing user needs and motivation to visit a website through ad
experience: a case study of a university website
To cite this article: K Budiman and I Akhlis 2021 J. Phys.: Conf. Ser. 1918 042008

View the article online for updates and enhancements.

                               This content was downloaded from IP address 46.4.80.155 on 21/09/2021 at 15:59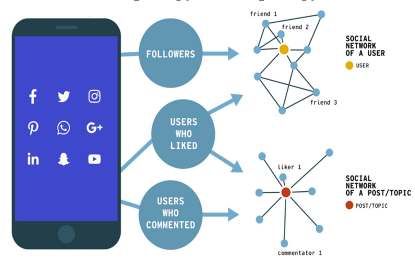
ICMSE 2020                                                                                                      IOP Publishing
Journal of Physics: Conference Series                         1918 (2021) 042008          doi:10.1088/1742-6596/1918/4/042008

Changing user needs and motivation to visit a website through
ad experience: a case study of a university website

                     K Budiman*1, I Akhlis2
                     1
                         Department of Computer Science, Universitas Negeri Semarang, Indonesia
                     2
                         Physics Education Program, Universitas Negeri Semarang, Indonesia
                     *
                         Corresponding author: kholiq.budiman@mail.unnes.ac.id

                     Abstract. An organization's website is one of its most crucial part in supporting the
                     success of an organization. It can be used as a media campaign and acquaintanceship.
                     Because of its importance, then user engagement is needed. User engagement is a
                     crucial mediator in the process of persuasion involving interactive media. The user's
                     engagement in building the organization's website is still low, especially on the
                     university website. In this article, we developed a university web with a push
                     notification to attract the user. Push notification implies not only a change in the
                     interface between users and technology; they also imply changing user dynamics and
                     patterns of use. This article discussing the use of push notifications can change the
                     interest and motivation of web users. The questionnaires analyzed with User
                     Experience Questionare+(UEQ+) conducted on respondents identified that users'
                     motivation to open and contribute to revisit websites increases.

1. Introduction
A website is one of the media used to disseminate information. With the website, users can access
information quickly and accurately. The intensity of updates and the topics discussed on the website
are the factors that determine the intensity of the website visits [1]. Universities or faculties usually
have their websites. Unfortunately, the existing websites are generally not fully utilized.
    Information on a university website is usually less informative; even the current information tends
to be disseminated more often through other media such as Whatsapp social media, either through
groups or private chats [2]. This fact results in information that is not well accommodated and even
raises doubts from the academic community regarding its correctness.
    Apart from the information that is not accommodated precisely, these factors also impact the
website itself. When websites rarely update information, and academics find it faster and easier to get
information through social media, the impact is decreased in the intensity of faculty or university
website visits [3]. Starting from this, the writer initiated the idea to strengthen the function of the
faculty website.
    The strengthening effort that the author will make is to design a push notification system and social
media sharing from website posts. With the push notification, when the website has an update of
information and the push notification will be run to users' accounts, it will strengthen the web's
function as a medium of information and have implications for frequent updates. Frequents updates
make web content more awaited from the user [4] It also bring a piece of backup information if the
website is down and make a backup solution for user and prevent from data loss [5] and than this will
              Content from this work may be used under the terms of the Creative Commons Attribution 3.0 licence. Any further distribution
              of this work must maintain attribution to the author(s) and the title of the work, journal citation and DOI.
Published under licence by IOP Publishing Ltd                          1
ICMSE 2020 IOP Publishing
Journal of Physics: Conference Series 1918 (2021) 042008 doi:10.1088/1742-6596/1918/4/042008
be trigger users to interact through the Faculty's website or university. Other than that in the
development process, the author does not forget about website design because it is more effective at
attracting readers than the system inside [6].
2. Push notification and social media sharing
Push notification, which is also called push technology, remote push, or native push, is a
communication channel where messages sent to application users are displayed in the marked device's
notification centre [7]. Generally, push notification works when there is an interaction between push
API and notifications API. The Notifications API allows applications to control system notifications to
users[8]. Meanwhile, the push API provides service workers to handle messages from the server to the
client when the application is active or not.
Figure 1. Interaction between system and user in notification management [9]
Based on the picture above, the interaction begins with permitting the user to send notifications. The
system then registers with the push notification service provider. Once registered, the system can
present notification information to users. Apart from that, users can also interact with notifications, such
as changing settings for notifications.
Social media services, such as Facebook, Twitter, LinkedIn, Youtube, or Flickr, provide platforms
for creating online communities, connecting people, and sharing information. The dissemination of
information through social media nowadays makes the audience more interested than official pages or
academic journal channels[10]. Even now, social media has entered the general public, which includes
interpersonal relationships and psychological well-being, citizen participation and involvement in
politics, as well as for media and online journalism [11] [12] [13]. Therefore, social media has become
a constitutive part of the distribution and consumption of online news. In social media, several actors
play a role in the wire flow of online news distribution, namely followers, users who like, and comment
users. Followers are the user who likely to see a post; users who like are people who have liked the
posts we share, and the last is users who comment, namely people who have seen and commented on
what has been shared. When described in topology, the topology of news dissemination is as follows:
Figure 2. News Sharing Topology in Social media
2ICMSE 2020 IOP Publishing
Journal of Physics: Conference Series 1918 (2021) 042008 doi:10.1088/1742-6596/1918/4/042008
3. Research Methodology
In the implementation of this study, the authors applied gradual and iterative research. Gradually it
means that all processes carried out by the researcher are carried out by the researcher in completing
the stages in his study. Iterative or repetition is carried out if it is felt that the investigation has not
found common ground for solving the problem; it will be repeated the stages of the research carried
out. The research stages that will be carried out by researchers use the following research stages:
a. Analysis
The analysis was carried out by researchers of existing faculty webs using screening of each
display and function that already exists on the web. After being analyzed, the author will review each
collection, whether the function/module/widget from this website is used and frequently accessed by
visitors or not. The review process uses the User Experience Questionnaire + (UEQ +) on an existing
website. UEQ + itself is an extended version of the User Experience Questionnaire. The UEQ analysis
represents six factors: attractiveness, perspicuity, dependability, efficiency, novelty, and stimulation
[14][15]. However, UEQ + can mean more factors. To complete the statement, the authors include a
questionnaire in UEQ +, which is used to analyze the faculty web in the following table 1:
Table 1. UEQ+ Questionnaire
Scale Item Left Item Right
Attractiveness annoying enjoyable
bad good
unpleasant pleasant
unfriendly friendly
Efficiency slow fast
inefficient efficient
impractical practical
cluttered organized
Intuitive Use difficult easy
illogical logical
not plausible plausible
inconclusive conclusive
Visual Aesthetics ugly beautiful
lacking style stylish
unappealing appealing
unpleasant pleasant
Dependability unpredictable predictable
obstructive supportive
not secure secure
does not meet expectations meets expectations
Value inferior valuable
not presentable presentable
tasteless tasteful
not elegant Elegant
complicated simple
Comprehensibility unambiguous ambiguous
inaccurate accurate
enigmatic explainable
The UEQ + method requires data retrieval using a seven likert scale, with the left being negative
values and the right contains positive values. Negative values are detailed in the left item column in
table 1. In contrast, positive values are detailed in the right item column.
b. Design
After conducting the screening, the researcher estimates what functions need to be reduced or
added to attract visitors to visit, read the web and even contribute to filling the website's content. After
estimating what modules need to be redesigned or added, the researcher makes a mockup or prototype
display of the developed website.
3ICMSE 2020 IOP Publishing
Journal of Physics: Conference Series 1918 (2021) 042008 doi:10.1088/1742-6596/1918/4/042008
c. Implementation
After all the modules and functions are designed, it is time to do the coding process. The coding on
this website can use a parallel concept by looking for existing and recommended plugins, or
researchers can make their custom widgets manually.
d. Testing
The test is repeated using UEQ + to determine whether the redesign process is correct.
The implementation concept applied in this research is implementing push notifications, namely
implementing the Telegram API into the faculty website. The topography of the application of
Telegram into push notifications can be seen in the image below.
API Communicating
API Communicating
Device Client
Check New post BOT FATHER
on WebServer TELEGRAM Telegram App
Server Telegram
Figure 3. Topology of Inter-Web Data Communication and Push Notifications
4. Results and Discussion
4.1 Result
In the analysis phase involving students and lecturers who are the academic community of researchers,
the seven UEQ+ factors are still low; here are the results of the UEQplus analysis obtained from the
analysis stage:
Table 2. The UEQ Result for Faculty Website (Before Redesign)
Scale Mean Cronbach Alpha
Attractiveness -1.30 0.81
Efficiency -0.07 0.87
Intuitive Use -0.23 0.74
Visual Aesthetics -0.57 0.69
Dependability -1.12 0.66
Value 1.43 0.78
Comprehensibility -0.52 0.63
The results obtained at this analysis stage are calculated from the average scale obtained. The
minimum value of each scale is -3, and the maximum of the UEQ + scale is 3. From the results
obtained, it can be seen that the mean value of all scales shows a minus value except for the value
scale. This minus result shows that the faculty website is not yet attractive, less efficient, as seen from
the results, still close to the number 0, not intuitive to use, not visually aesthetic. Understanding the
user is also quite challenging to use. In Table 1, it is explained that there is a Cronbach alpha column.
This Cronbach alpha column shows whether the data used is valid; according to Griethuijsen, 2014,
the acceptable value in data validation for Cronbach alpha is more than 0.6.
After the writer found the problem, the writer made a redesign process and made improvements in
appearance. The author also adds a push notification as an advertisement inserted into the Telegram
4ICMSE 2020 IOP Publishing
Journal of Physics: Conference Series 1918 (2021) 042008 doi:10.1088/1742-6596/1918/4/042008
with the topology shown in Figure 3. Then the new design is analyzed again by applying UEQ +. The
following are the results of the analysis of the new design:
4.2 Discussion
The UEQ + test results in the final stage showed an increase in the test session. The attractiveness
value, which was -1.30, now increased by 1.73, this shows that the new design website is more
interesting to look at; Efficiency testing, which was previously -0.07, now changed to 1.73, this shows
that the website is more efficient; The intuitive use test that was previously -0.23 has now increased to
2.01, this shows that the new website is easier to use, in terms of visual aesthetics, which previously
got a value of -0.57, now it has become 1.25. This shows that the website with a new design has a
more attractive visual; in terms of dependability, which increased to 0.88, indicates that the
information is more reliable; the value that previously received a positive value, namely 1.43, has now
increased to 2.19, this shows that the web site's functionality is better than before; In terms of
comprehension, namely comprehensibility also increased from -0.52 to 0.46 now, this increase shows
that users understand this website better than before. In detail, the results of UEQ + analysis on the
new website design are shown in Table 3.
Table 3. Results of Website Analysis Using UEQ+ (After the web redesign)
Scale Mean Cronbach Alpha
Attractiveness 1.73 0.68
Efficiency 1.73 0.68
Intuitive Use 2.01 0.68
Visual Aesthetics 1.25 0.72
Dependability 0.88 0.66
Value 2.19 0.76
Comprehensibility 0.46 0.62
The author also performs forecasting calculations on website visitors. Forecasting calculations are
used to estimate the number of visitors in November and December. Forecasting is carried out,
expecting the exponential smoothing formula. An exponential smoothing method is a powerful tool for
predicting calculations in time series, predicting future demand, and reducing investment costs [16].
The formula for exponential smoothing, namely
Description:
= Current Demand Prediction
= Previous Demand Prediction
= Exponential Constants
= Real Request
The following are the results of the prediction using exponential smoothing:
Before After Prediction
Figure 4. Predictive Graph of Increase In Visitors
5ICMSE 2020 IOP Publishing
Journal of Physics: Conference Series 1918 (2021) 042008 doi:10.1088/1742-6596/1918/4/042008
It can be seen from Figure 5, after the addition of visitor push notifications has increased, even
after it is predicted that in the following months, there will be an increase in the number of web
visitors.
5. Conclusion
Push notification is a system that allows the user to configure and get a notification. Through push
notifications embedded in a website, users will revisit a website. This study shows that the addition of
a push notification and design changes according to the suggestions analyzed using UEQ + can
increase website visitors. Of course, it must be accompanied by continuing to add informative content
to the website.
References
[1] Menascé DA 2002 IEEE internet comput. 6(6) 72
[2] Ross P, Stromer-Galley J, Baptista EA, Oliveira V 2020 New Media Soc. 1461444820928059.
[3] Demangeot C, Broderick AJ 2016 Int. J. Retail Distrib. Manag.
[4] Ashley C, Tuten T 2015 Psychol. Mark. 32(1) 15
[5] Budiman K, Arini FY, Sugiharti E 2020 J. Phys.: Conf. Ser. 1567 (3) 032023
[6] Morozov K, Sidenko IV, Kondratenko GV, Kondratenko YP 2020 COLINS 894
[7] Sulastri H, Sevtiyuni PE, Rahmatulloh A, Sanjiwani NM K 2020 Int. Conf. Inf. Technol. Appl.
(SICONIAN 2019) 581, Atlantis Press,
[8] Capadisli S, Guy A, Lange C, Auer S, Sambra A, Bern.-Lee T 2017 Eur. Semant. Web Conf.
(pp, 537-553), Springer Cham,
[9] Lau WW 2017 Comput. hum. behav. 68 286
[10] Westermann T. 2017 Springer Singap.,
[11] Caers R, De Feyter T, De Couck M, Stough T, Vigna C & Du Bois C 2013 New media &
society 15(6) 982
[12] Wilson RE, Gosling SD & Graham LT 2012 Perspect. psychol. sci.7(3) 203
[13] Zhang Y, Tang LST, Leung L 2011 Cyberpsychology Behav. Soc. Netw. 14(12) 733
[14] Schrepp M, Hinderks A, Thomaschewski J 2017 Int. J. Interact. Multimed. Artif. Intell. 4(4) 40
[15] Griethuijsen R A L F, Eijck MW, Haste H, Brok PJ, Skin. NC, Mansour N 2014 Res. Sci. Educ.
45(4) 581
[16] Oliveira EM, Oliveira FLC 2018 Energy Springer 144 776
6You can also read