Chemokinesis driven accumulation of active colloids in low mobility regions of fuel gradients
←
→
Page content transcription
If your browser does not render page correctly, please read the page content below
www.nature.com/scientificreports
OPEN Chemokinesis‑driven accumulation
of active colloids in low‑mobility
regions of fuel gradients
Jeffrey L. Moran1,6*, Philip M. Wheat2,6, Nathan A. Marine2 & Jonathan D. Posner3,4,5*
Many motile cells exhibit migratory behaviors, such as chemotaxis (motion up or down a chemical
gradient) or chemokinesis (dependence of speed on chemical concentration), which enable them to
carry out vital functions including immune response, egg fertilization, and predator evasion. These
have inspired researchers to develop self-propelled colloidal analogues to biological microswimmers,
known as active colloids, that perform similar feats. Here, we study the behavior of half-platinum
half-gold (Pt/Au) self-propelled rods in antiparallel gradients of hydrogen peroxide fuel and salt,
which tend to increase and decrease the rods’ speed, respectively. Brownian Dynamics simulations,
a Fokker–Planck theoretical model, and experiments demonstrate that, at steady state, the rods
accumulate in low-speed (salt-rich, peroxide-poor) regions not because of chemotaxis, but because of
chemokinesis. Chemokinesis is distinct from chemotaxis in that no directional sensing or reorientation
capabilities are required. The agreement between simulations, model, and experiments bolsters the
role of chemokinesis in this system. This work suggests a novel strategy of exploiting chemokinesis to
effect accumulation of motile colloids in desired areas.
Chemotaxis vs. chemokinesis. Self-propulsion at the microscale is abundant and important in biol-
ogy. Many eukaryotic and prokaryotic cells propel themselves in biological fluids to perform critical functions.
Examples include sperm cells, which navigate through cervical mucus to fuse with and fertilize an egg1, and leu-
kocytes, whose migration is essential for coordinated immune responses and often occurs over long d istances2,3.
Two common migratory behaviors exhibited by motile cells are taxis and kinesis. Taxis refers to the phenomenon
in which the direction of an organism’s motion is determined by the non-uniform distribution of a physical
quantity (i.e., the cell moves up or down a gradient). In contrast, kinesis occurs when an organism’s speed, either
translational or rotational, depends on the spatial distribution of a quantity2. Unlike taxis, kinesis does not imply
a direction and is generally random.
In the natural world, taxis manifests in many forms, including chemotaxis (migration up or down a chemical
concentration gradient), aerotaxis (oxygen gradient), phototaxis (light intensity gradient), gravitaxis (gravi-
tational potential gradient), and o thers4–6. Taxis drives many cell migration behaviors known to be essential
for various physiological and pathological processes. For example, motile bacteria execute chemotaxis to find
nutrients and evade predators7. Aerobic bacteria perform aerotaxis to find the oxygen they need to survive8. Leu-
kocytes reach sites of infection by orienting toward higher concentrations of chemicals secreted at these sites2,9.
To perform taxis, cells employ a coordinated series of sensing and signaling processes. For example, Escheri-
chia coli bacteria possess transmembrane receptors that bind attractants (such as glucose) and repellents (such
as phenol) and thereby detect spatial or temporal differences in chemical concentration. These differences are
relayed via a signaling protein to the flagella, which execute runs (straight-line motions) and tumbles (i.e., ori-
entation changes), adjusting the cell’s direction according to its needs. In addition to spatial gradients, bacteria
can also respond to temporal gradients. For example, Salmonella typhimurium bacteria change their tumbling
frequency, effectively modifying direction, in response to a change from one uniform concentration of a chem-
oattractant to a nother10. This suggests that the detection of a spatial gradient by bacteria may involve detection
of a temporal concentration variation, which the cell experiences by moving through a spatial concentration
1
Department of Mechanical Engineering, George Mason University, Fairfax, VA, USA. 2Ira A. Fulton Schools of
Engineering, Arizona State University, Tempe, AZ, USA. 3Department of Mechanical Engineering, University of
Washington, Seattle, WA, USA. 4Department of Chemical Engineering, University of Washington, Seattle, WA,
USA. 5Department of Family Medicine, School of Medicine, University of Washington, Seattle, WA, USA. 6These
authors contributed equally: Jeffrey L. Moran and Philip M. Wheat. *email: jmoran23@gmu.edu; jposner@
uw.edu
Scientific Reports | (2021) 11:4785 | https://doi.org/10.1038/s41598-021-83963-x 1
Vol.:(0123456789)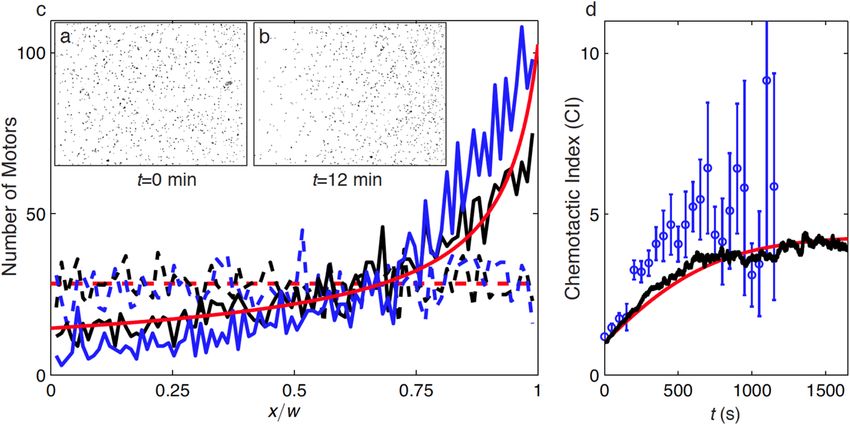
www.nature.com/scientificreports/
Figure 1. Schematic of self-propelled platinum/gold (Pt/Au) nanorods used in this work. First reported in
200429, Pt/Au nanorods move autonomously with the Pt end forward in aqueous hydrogen peroxide (H2O2)
solutions. Pt and Au catalyze the indicated electrochemical reactions, resulting in an electron current through
the rod (from Pt to Au) and a corresponding ion current in the solution, and create dipolar charge density (ρe)
and electric field (E) distributions around the rod. The electric field exerts a propulsive force on the negatively-
charged rod, propelling it with the Pt end forward (left to right)32,33. The speed of Pt/Au rods increases as the
H2O2 concentration is increased, while the addition of a nonreacting electrolyte tends to decrease the self-
propelled speed34,42.
difference. In contrast, eukaryotic cells (such as leukocytes) detect spatial gradients by comparing the occupancy
of receptors at different locations along the c ell11. Although the details differ across cell types, taxis generally
requires sensing, signal transduction, and movement response12.
In contrast to taxis, kinesis implies that cells or organisms move at a speed that depends on a local stimulus
intensity. One common form of kinesis is chemokinesis, in which the organism’s speed depends on chemical
concentration. The dependence of translational speed on stimulus is known as orthokinesis and dependence of
rotational speed or reorientation frequency on stimulus is known as klinokinesis. In a concentration gradient,
cells undergoing chemokinesis exhibit a spatial variation in m otility2, which can result in accumulation of cells
in high- or low-concentration r egions . Chemokinesis has been observed in s permatozoa14,15, neural c ells16,
13
leukocytes17, and bacteria such as Rhodobacter sphaeroides18. Numerical models of simultaneous chemotaxis
and chemokinesis, based on the behavior of Myxococcus xanthus, demonstrate how the two behaviors can coex-
ist competitively in an organism19. In a chemical gradient, chemokinesis can lead to accumulation in regions
where motility is minimized. For example, neutrophils swim more slowly in the presence of an immune complex
than in the presence of surfaces coated with bovine serum albumin; over time, the neutrophils were shown to
accumulate preferentially in the immune complex r egion20.
In summary, when cells are exposed to chemical gradients, chemokinesis and chemotaxis can both arise. Per-
haps as a result, there has been confusion in the literature between chemotaxis and chemokinesis9,13. In a bounded
domain with a static concentration gradient, chemokinesis can result in accumulation of cells that appears quali-
tatively similar to, and may be mistaken for, chemotaxis9,13. The key distinction is that, in chemokinesis, cells
can accumulate in certain regions not by sensing and “intentionally” responding to a gradient, but because of
the coupling between stochastic variations of their motion direction (e.g. due to tumbling or rotational Brown-
ian motion), which allows cells to explore their surroundings and sample the surrounding concentration field,
and the kinetic response, which causes speeds to decrease in certain areas (effectively trapping cells there)13,20.
Self‑propelled microparticles: vehicles for artificial chemotaxis? Since the early 2000s, extensive
research efforts have been devoted to developing synthetic analogues to biological microswimmers. These self-
propelled particles, often called active colloids, typically range in size from 0.1 to 10 μm and have the unique abil-
ity to harvest energy from their surroundings and convert it to motion21. They accomplish this via several mech-
anisms including bubble propulsion22, conversion of external electric or magnetic fields23,24, ultrasound25,26, or
incident light27 into motion, and phoretic m echanisms28 in which the particle moves as a result of self-generated
gradients in temperature, chemical concentration, or electric potential. The first active colloids to be widely stud-
ied were half-platinum half-gold (Pt/Au) bimetallic rods (2 μm long, between 200 and 400 nm diameter) that
self-propel with the Pt end forward in hydrogen peroxide (H2O2) solutions29. Several mechanistic analyses30,31,
including some from our g roup32–34, established that electrochemical reactions on the Pt and Au surfaces gener-
ate an electric field in the rod’s vicinity, which exerts a propulsive force on the charged rods (commonly called
self-electrophoresis30,32,35,36). Figure 1 shows a schematic of a Pt/Au rod with the electrochemical reactions pow-
ering the motion.
The speed of Pt/Au rods increases with local H 2O2 concentration, and the rods thus exhibit a positive
chemokinetic response to H 2O2. Some studies report a linear dependence of speed on concentration while oth-
ers predict nonlinear relationships of varying t ypes29,32,33,37,38. The general consensus is that the dependence is
linear at low to moderate concentrations, and slightly levels off at high concentrations because of saturation of
available reaction sites on the Pt and Au surfaces37,38. Other active colloid designs also exhibit a chemokinetic
response to their fuel (typically H2O2), including bubble-propelled particles39 and Pt/polystyrene or Pt/silica
“Janus” particles40,41. At higher fuel concentrations, speeds are usually faster because the reactions responsible
for motion proceed more rapidly, leading to stronger propulsive forces.
In contrast to H2O2, the addition of electrolytes tends to decrease the speed of Pt/Au rods. This was first
reported in 2006 for sodium nitrate and lithium nitrate by Paxton et al.42, who found that at constant H 2O 2
concentration, speed is roughly inversely proportional to solution conductivity. ( H2O2 is required for electrolyte-
induced speed reductions to be present, since without H2O2 there would be no self-propelled motion to impede.)
The only exception to this trend is electrolytes that contain silver, which tend to increase the speed of the rods43.
Scientific Reports | (2021) 11:4785 | https://doi.org/10.1038/s41598-021-83963-x 2
Vol:.(1234567890)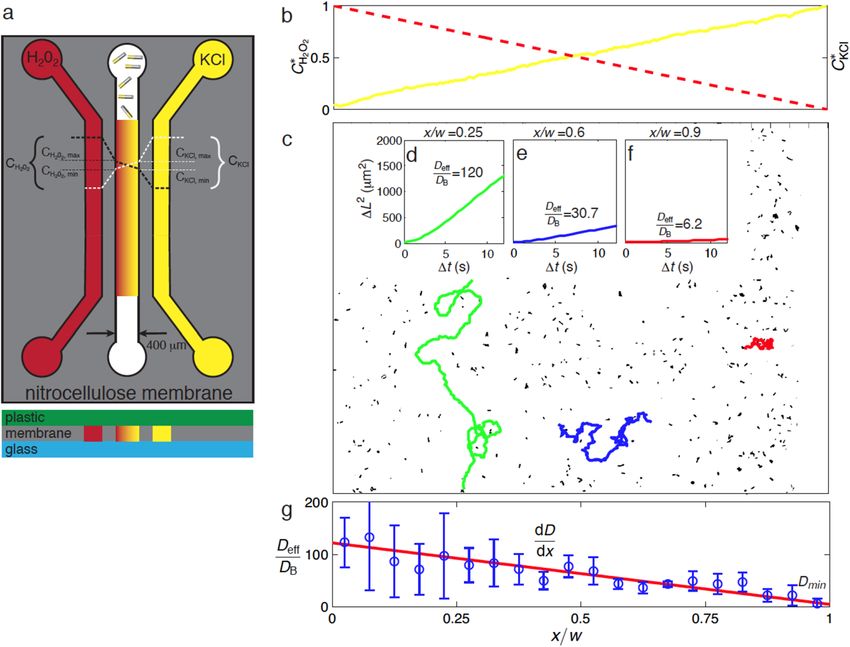
www.nature.com/scientificreports/
Electrolytes not containing silver cause significant reductions in rod speed even at modest concentration, such
that millimolar concentrations are often enough to effectively eliminate self-propulsion42. To elucidate the physi-
cal mechanism for this phenomenon, we simulated the motion of a single rod in varying salt s olutions34 and
found that the self-generated electric field magnitude decreases markedly upon addition of salt (and the concomi-
tant increase in conductivity). This trend is robust and has been characterized for a wide range of e lectrolytes43.
Several groups have attempted to realize autonomous taxis in artificial active colloids44. Some studies45–48
have reported chemotaxis in chemically-powered particles, effectively making two simultaneous claims: (1) the
particles move by consuming a chemical fuel that influences their speed (chemokinesis); (2) the particles move
up gradients of that same fuel (chemotaxis). As previously stated, chemotaxis and chemokinesis can coexist in
some organisms19; however, given the signaling and sensing required for chemotaxis in living c ells49, the ques-
tion naturally arises as to how synthetic active colloids could achieve “intentional” motion along gradients. The
argument is often made that when an active colloid happens to move up a fuel gradient (i.e., in a direction of
increasing concentration), it accelerates and therefore advances farther toward increasing concentration than
if it were moving toward lower concentration. This scenario is plausible but does not address the scenario in
which a particle encounters a local maximum in chemical concentration. When a chemokinetic active colloid
reaches a concentration maximum, it will quickly disperse because of the maximal motility there. In contrast,
chemotactic cells do not disperse upon reaching a chemoattractant source; rather, their directional motion ceases.
For example, chemotactic bacteria seek out and accumulate at nutrient maxima50. Sperm cells accumulate in fol-
licular fluid containing a c hemoattractant51, and there is a strong correlation between this in vitro accumulation
and egg f ertilizability52. Neutrophils use chemotaxis to find and accumulate at wound s ites53. A recent numerical
study considered a self-propelled particle in a linear fuel gradient and assumed a linear dependence of speed on
chemical concentration; the main conclusion was that, although initially the particle may move in either direc-
tion, it would ultimately end up in the region of lowest motility55. As noted by Popescu et al. in a systematic study
of Janus swimmers in concentration g radients54, “chemokinesis alone cannot lead to chemotaxis.”
Some theoretical analyses have been undertaken of phoretic active colloids to identify the conditions in which
they could exhibit chemotaxis, positing a rich variety of single-particle and collective behaviors56,57. It is well-
known from the work of Golestanian and others that the response of a phoretic self-propelled particle depends
on its phoretic mobility and surface a ctivity35. Popescu et al. theoretically analyzed the response of a phoretic
self-propelled particle to a concentration gradient and concluded that, while a particle’s chemokinetic response
to a fuel depends primarily on its average phoretic mobility (in the case of Pt/Au rods, this is the electrophoretic
mobility, which depends on zeta p otential58), chemotaxis primarily depends on the mismatch in the phoretic
mobility between the front and back halves of the particle54. The zeta potential of metallic nanorod particles
in aqueous solutions has been measured to be consistently negative (attributed to preferential adsorption of
anions)59, and is around – 40 mV for Pt/Au rods42. Since the particle is conducting, our previous theoretical
analyses have predicted that the zeta potential of metallic nanorods differs negligibly between the Pt and Au
surfaces33. Thus, the theoretical basis for Pt/Au active colloids to exhibit chemotaxis of this type has not been
definitively established.
Other demonstrations of artificial taxis are based on different physical mechanisms. Silica/carbon two-faced
“Janus” microspheres, when immersed in a binary mixture of water and 2,6-lutidine and irradiated with 532-nm
light, asymmetrically de-mix the solution surrounding the particle, establishing a lutidine concentration gradi-
ent that produces a diffusiophoretic propulsive force on the p article60. In a light intensity gradient, a torque on
the particle arises that selectively orients particles toward low-intensity regions, exemplifying artificial negative
phototaxis. In another example, droplets of a liquid crystal move by generating surfactant gradients, driving
Marangoni flows that propel the droplets61. The droplets evinced chemotaxis by successfully navigating a micro-
fluidic maze with the chemoattractant source at the exit. Other examples include asymmetric artificial liposomes
made from copolymer mixtures, which undergo runs and tumbles akin to bacteria and are propelled by enzymatic
reactions62; these particles were shown to be promising for blood–brain barrier crossing, a crucial step in many
biomedical applications. Finally, gravitaxis was demonstrated in asymmetrically-coated Janus m icrospheres63;
here, the mismatch between the densities of the polystyrene colloids and metallic coatings led to a torque orient-
ing the particles along the gravitational direction with the metallic side down.
In contrast to taxis, a lesser-explored strategy is to exploit the chemokinetic response that most active col-
loids naturally exhibit to bring about their accumulation in desired areas. One recent example study64 demon-
strated polymeric self-propelled particles that swell in response to decreases in pH. In a pH gradient, particles
accumulate in the most acidic regions because the PVP swells in response to the local pH decrease, leading to
an increased drag profile and reduced swimming speed there. Given that many active colloids naturally exhibit
chemokinesis, a systematic characterization of the behavior of active colloids in static concentration gradients
is warranted.
In this paper, we show that Pt/Au rods undergo chemokinesis-driven accumulation in steady-state concentra-
tion gradients of hydrogen peroxide ( H2O2) and potassium chloride (KCl) salt. We use a microfluidic device to
generate steady-state linear gradients of H 2O2 and KCl. The rods are initially distributed randomly in these gra-
dients and exhibit a positive and negative orthokinetic response to H2O2 and KCl, respectively. The distribution
of rods reaches a pseudo-equilibrium and concentrates in regions with low H 2O2 and high KCl concentrations,
where their effective diffusivity is minimized. The experiments show good agreement with Brownian dynamics
simulations as well as a theoretical model based on a 1-D Fokker–Planck equation, which models the particles
as a continuous substance undergoing enhanced diffusion with spatially-dependent diffusivity. The simulations,
PDE model, and experiments point to a simple explanation that chemokinesis can lead to accumulation of active
colloids in chemical gradients. This accumulation is distinct from chemotaxis in that it does not require sensing
of, or a direct response to, temporal or spatial gradients in concentration.
Scientific Reports | (2021) 11:4785 | https://doi.org/10.1038/s41598-021-83963-x 3
Vol.:(0123456789)
www.nature.com/scientificreports/
Figure 2. Microfluidic linear gradient generator and its effect on effective diffusivity of bimetallic rods. (a)
A microfluidic device with porous nitrocellulose channel walls generates steady, linear gradients of hydrogen
peroxide (H2O2) and potassium chloride (KCl) in the center channel. The left (red) channel contains 30
wt.% H2O2 and the right (yellow) channel contains 100 μM KCl in water. The left and right channels serve
as reservoirs for H
2O2 and KCl respectively. The rods are introduced into the center channel, where they
move autonomously in the static fluid and at a speed that depends on the local chemical concentrations.
(b) Linear gradients of KCl
(measured estimates) and H 2O2 (calculated) in the center channel where
Ci∗ (x) = Ci (x) − Ci,min / Ci,max − Ci,min . Here x denotes the horizontal spatial coordinate and i denotes
either H2O2 or KCl. (c) Trajectories of individual rods in the center channel in the presence of the H 2O2 and KCl
gradients over 100 s. The linear static gradients result in a spatial variation in rod swimming speed that results in
longer paths on the left (green) relative to the ones on the right (red) due to the locally high H 2O2 concentration
and low KCl concentration. Ensemble-averaged mean-square displacement (MSD) as function of time for (d)
rods centered at x/w = 0.25 (w = 400 μm is the width of the channel) and D eff/DB = 120, where DB = 1 µm2/s is the
Stokes–Einstein-Sutherland diffusivity of the rod; (e) rods centered at x/w = 0.6 (Deff/DB = 30.7); and (f) rods
centered at x/w = 0.9 ( Deff/DB = 6.2). (g) The measured effective diffusivity (blue circles) varies roughly linearly
with x. The error bars represent one standard deviation of the measured diffusivities and the red solid line is a
least-squares linear fit that is used in the models. Panels (c)–(g) originally appeared in a previous review by our
group28.
Methods
The experiments were conducted in a microfluidic device fabricated from polycarbonate, glass, double-adhesive
Mylar, and nitrocellulose membranes (see Fig. 2a). All layers are patterned using a C O2 laser ablator (Universal
Laser Systems, Scottsdale, AZ). The lower and upper surfaces of the microchannels are formed from a glass
microscope slide and poly(methyl methacrylate) (PMMA) sheets, respectively. Nitrocellulose membranes (What-
man, Maidstone, UK), with average pore diameter of 0.4 μm, form the boundaries between the main channel
and the side channels and are sealed to the upper and lower channel surfaces using 200-μm-thick double sided
adhesive Mylar sheets cut in the same pattern as the membranes. The device is assembled using metal bolts
through the acrylic upper surface and an additional PMMA superstructure below the glass lower surface. The
center microfluidic channel is 15 mm long, 400 μm wide, and 450 μm deep. The outer channels are 600 μm wide
and 450 μm deep. The assembled device is depicted schematically in Fig. 2a.
The rods are fabricated using a templated electrodeposition p rocedure65 that is widely used for synthesis of
self-propelled rod-shaped particles29,31,32. Briefly, platinum and gold are sequentially electrodeposited into the
cylindrical 200-nm-diameter pores of an anodic aluminum oxide (AAO) membrane. After metal electrodeposi-
tion is complete, the AAO membrane is chemically etched, and the rods are centrifuged and resuspended in pure
water. The length of the Pt and Au segments is each approximately 1 μm, yielding an overall rod length of 2 μm.
The rods are imaged in the microfluidic device using optical microscopy with a 20 × objective (NA = 0.45, Nikon
TE2000, Japan) and a CCD camera (Coolsnap HQ, Photometric, Tucson, AZ) at 2 frames per second. The motion
of the rods is tracked and analyzed using a custom MATLAB-based particle tracking algorithm. In each frame,
the positions of the rods’ centers were calculated from the intensity-weighted centers of the rod images. The
rods’ centers at each time were paired using an optical flow algorithm. In a typical experiment, there are between
Scientific Reports | (2021) 11:4785 | https://doi.org/10.1038/s41598-021-83963-x 4
Vol:.(1234567890)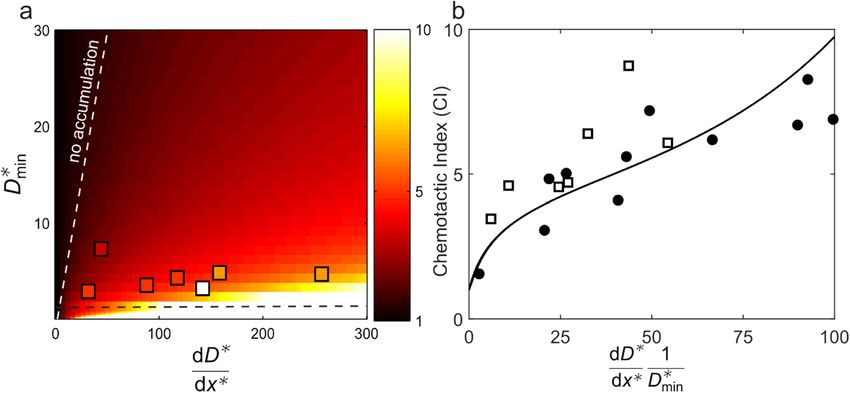
www.nature.com/scientificreports/
350 and 600 rods in the field of view. The width of the channel is divided into 20 segments. The mean squared
displacement (MSD) for each rod is tracked for 100 frames. An effective diffusivity for each of the 20 segments is
determined by averaging the MSDs for all rods starting in the respective segments at the start of the 100 frames.
We drive flow of 30% H2O2 in deionized water at 5 μL/min through the left channel, which serves as an H2O2
source and KCl sink. We drive 100 μM KCl + 1 μM fluorescein dye (the dye is used to visualize the concentra-
tion gradient using optical microscopy) through the right channel, which serves as a KCl source and H 2O2 sink.
The flows in the side channels are driven with syringe pumps. As described in the supplementary informa-
tion, the maximum and minimum concentrations of KCl and fluorescein in the main channel are calculated as
Cmin,KCl = 45.5 μM, and Cmax,KCl = 54.5 μM. Cmin,Fl = 455 nM, and Cmax,Fl = 545 nM. As shown in Fig. 2b, the KCl
concentration distribution (yellow solid line) is verified based on the observed variation of fluorescein intensity
and assuming the KCl concentration to be linearly proportional to fluorescein concentration. The H 2O2 concen-
tration distribution (red dashed line) is estimated based on the steady-state diffusion equation. The center channel
contains the Pt/Au rods in deionized water with no imposed bulk flow. The porous microchannel walls and lack
of flow in the center channel result in linear static gradients of H 2O2 and KCl. Pt/Au rods exhibit orthokinetic
behavior wherein the self-propelled translational speed depends on local peroxide and electrolyte concentration.
Theory. Complementing the experiments, we model chemokinesis using Brownian dynamics (BD) simula-
tions as well as a mass conservation partial differential equation (PDE). The BD simulations are based on the
standard Langevin model that neglects inertial effects, collisions between rods, and interparticle hydrodynamic
and electrostatic interactions. We assume the motion of the rods is confined to two dimensions, since the nega-
tively buoyant rods sediment to a quasi-2-D fluid layer a few micrometers above the bottom surface, where they
remain for the duration of the experiment. Many of the materials from which active colloids are made are denser
than water, and thus 2-D (or even 1-D) models of ensembles of active colloids are c ommon40,55,66–68.
The differential equations governing the position x and y and orientation θ of each rod are the Langevin
equations55,66,67,69,
ẋ = ucosθ + ξx , (1)
ẏ = usinθ + ξy , (2)
θ̇ = ξθ , (3)
where ẋ and ẏ are (respectively) the translational speeds in the x and y directions, u is the translational speed
of the rod (which depends on x), and ξx, ξy, and ξθ are stochastic noise terms in the indicated directions. This
basic system of Langevin equations has been used to model quasi-2-D swarms of chemokinetic active colloids in
several previous s tudies55,66–68,70,71. The right-hand side of the third Langevin Eq. (3) includes only the stochastic
term, ξθ, reflecting our assumption that the rods are not “self-polarizing66.” In other words, we assume that the
orientation of the rods varies in time because of rotational diffusion alone, and that the rotational diffusivity
is approximately independent of H 2O2 or KCl concentration. The assumption of no self-polarization has been
made in several previous models of chemokinetic m icroswimmers40,55,70,72. For many phoretic self-propelled
particles that show a strong chemokinetic response, the rotational diffusivity is primarily governed by rotational
Brownian motion and does not depend strongly on s timulus67,72,73. For Janus active colloids whose front and
back mobilities are nearly equal, the systematic analysis by Popescu et al. found that the reorienting torque, and
thus the chemotactic response, are negligible54.
The BD simulations do not specify an explicit dependence of speed on either H2O2 or KCl concentration. As
discussed above, the dependence of speed on both concentrations has been measured by several groups, includ-
ing ours29,32,37,42,43. Although the qualitative trends are well-established (speed increases approximately linearly
with H2O2 concentration and with the reciprocal of KCl concentration), different studies report different values
of the rod speed for the same H 2O2 concentration29,32,37. In this work, we found that even the same batch of rods
showed different average speeds from one day to another under nominally identical conditions. In experiments,
ensemble averages of rod particle tracking showed a roughly linear dependence of rod speed on horizontal posi-
tion x74. As a result, in the BD simulations presented here, we assumed a linear variation of u with x, bounded
by maximum and minimum speeds, Vmax and Vmin, which were specified inputs for each simulation run. The
minimum value of Vmin we considered was 1 μm/s and the maximum value of Vmax was 25 μm/s. This is a similar
range to the speeds measured in the experiments74.
The stochastic displacements ξx, ξy, and ξθ are independent random variables with zero ensemble average,
�ξx � = �ξy � = �ξθ � = 0, and their standard deviations are tuned such that the mean-squared displacements
(without self-propulsion) are consistent with Brownian motion with translational diffusivity D and rotational
diffusivity Drot,
�ξx2 � = �ξy2 � = 2Dt, (4)
�Sθ2 � = 2Drot t, (5)
where brackets indicate an ensemble average over the population of rods, D is the Brownian diffusion coeffi-
cient of the rods, and Drot is the Brownian rotational diffusivity of the rods. For the purposes of tuning the noise
terms, the translational and rotational Brownian diffusivities are estimated from the Stokes–Einstein equations
for translational and rotational diffusion of a spheroidal p article75. For the dimensions considered here, D ≈ 1
Scientific Reports | (2021) 11:4785 | https://doi.org/10.1038/s41598-021-83963-x 5
Vol.:(0123456789)www.nature.com/scientificreports/
μm2/s and Drot ≈ 1.38 rad2/s. The boundary conditions employed for the BD simulations enforce no flux of rods
(i.e., the channel is closed and rods cannot escape) and elastic boundaries. That is, rods are assumed to undergo
perfectly elastic collisions with the walls and the overall kinetic energy of the rod is the same before and after
the collision. The simulations track 10,000 rods over 6,000 s with time step Δt = 0.1 s.
The BD simulations and experiments are complemented with a theoretical model. This model assumes the
swarm of rods to be a continuously distributed substance that obeys the mass conservation equation
∂n
+ ∇ · J = 0, (6)
∂t
where n is the number density of rods and the flux of rods J is defined by the modified Fokker–Planck
equation76–78,
J = −Deff ∇n − αn∇Deff , (7)
where Deff is the effective diffusivity of the rods (which depends, in turn, on the spatially-dependent rod speed),
n is the number density of the rods, and α represents the Itô-Stratonovich convention coefficient. The Fok-
ker–Planck equation has been used to model chemokinesis of active colloids in activation gradients in a variety
of situations55,66,67. The supporting information (SI) provides a full derivation of Eq. (2). The appropriate value
of α for a random-walk process is 0.5 as discussed by in detail by Schnitzer76. Equation (6) is solved in one
dimension with no-flux boundary conditions, J = 0, i.e. Deff ∇n = −αn∇Deff . The only input into the models is
the variation of the effective diffusivity of the rods with space, which is obtained from a least-squares linear fit
(r2 = 0.84) to the experimental data in Fig. 2g. We solve Eqs. (6) and (7) using a second-order centered-difference
method in space and a 1 st-order backward Euler method in time. We assume a uniform distribution of rods
for the initial condition and impose no-flux boundary conditions on the channel walls. Further details on the
numerical method are provided in the SI.
Results and discussion
Since the rods’ velocity increases with H2O2 concentration10,13,14,27 and decreases with electrolyte concentration34,42,
the linear static gradients in H
2O2 and KCl concentrations result in a spatial variation in the translational speeds
of the rods. Figure 2c shows the pathlines of individual rods in the center channel as a function of position,
x/w, over 100 s. The rods on the left (x/w < 0.5, high H2O2 and low KCl concentration) move faster, resulting in
longer pathlines (green) relative to the ones on the right (x/w > 0.5, locally low H 2O2 and high KCl concentra-
tion) over the same time interval (red). We use the rod pathlines to calculate the MSD, L2, of the rods for the
lifetime of the experiment. Figure 2d–f show the MSD as function of time for several positions, x/w = 0.25, 0.6,
0.9. The effective diffusivity of the rods, depicted2 in Fig. 2d–f, is estimated here as the slope of MSD vs. time in
the linear regime (t > > Drot−1) given as Deff = L
t . On the left side of the channel (x/w = 0.25), there is relatively
high concentration of H2O2 and low salt, resulting in an effective diffusivity of 120 times the Brownian diffusivity,
as shown in Fig. 2d. In the channel center, x/w = 0.6, the effective diffusivity decreases to Deff/DB = 30.7 (Fig. 2e).
On the right-hand side where the salt is highly concentrated and there is little peroxide, x/w = 0.9, the effective
diffusivity reduces to roughly six times the rods’ thermal diffusivity. Figure 2g shows that the effective diffusivity
of the rods decreases roughly linearly with space, x/w. This gradient arises from the gradient in velocity of the
individual rods.
Figure 3a shows an instantaneous micrograph of the rods in the center channel at t = 0, showing a relatively
uniform initial distribution of rods. We plot the number of rods as a function of position in Fig. 3c for the experi-
ments, simulations, and model. Corresponding to Fig. 3a, at t = 0 the rods are uniformly dispersed throughout
the channel. After 12 min, the rods accumulate on the right due to chemokinesis, as shown in Fig. 3b. At this
time, the rod number distribution reaches a pseudo-equilibrium state in which the rods are concentrated in the
high-salt, low peroxide region on the right as shown in Fig. 3b. The temporal evolution of chemokinesis in both
simulations and experiments is included as a video in the supplementary information (SI). The SI also includes
a description of control experiments that showed no migration of rods in a KCl gradient alone (no peroxide),
effectively eliminating diffusiophoresis due to the KCl gradient as an alternative mechanism for the rods’ accumu-
lation. We plot both the BD and PDE model predictions for the number density as a function of space in Fig. 3c,
which show good agreement with experimental results. We also note the qualitative resemblance between the
quasi-steady-state distributions (solid lines) in Fig. 3c and the steady-state probability density function in Fig. 2a
of Ghosh et al.55, who also found a roughly inverse relationship between speed and steady-state accumulation.
To quantify the asymmetry in the accumulation of rods at steady state, we define a chemotactic index, CI. Our
use of the term “chemotactic index” should not be construed as a claim that the rods exhibit chemotaxis here;
rather, we use this term because it has been used in previous l iterature79,80 to denote accumulation of microswim-
mers in a given region. Indeed, in this system accumulation results not from chemotaxis, but from chemokinesis.
The CI is defined as the number of rods in the high-salt, low-peroxide concentration region (right hand side)
divided by the number of rods in the low-salt, high-peroxide concentration region (left hand side)81. Specifically,
NR
CI = , (8)
NL
where NR and NL are the number of rods in the rightmost and leftmost regions of the main channel, respectively.
The width of the rightmost and leftmost regions is defined to be 1/10th of the channel width. Figure 3d shows
the
CI as a function of time. The CI is initially unity and increases as CI(t)/CIfinal = 1 − e−t/τ 1 + CI final −1 over
Scientific Reports | (2021) 11:4785 | https://doi.org/10.1038/s41598-021-83963-x 6
Vol:.(1234567890)www.nature.com/scientificreports/
Figure 3. Chemokinesis-driven accumulation of bimetallic Pt/Au rods in low-mobility regions. (a) Micrograph
showing initial (t = 0) uniform distribution of rods in the center channel in the presence of H
2O2 and KCl
gradients. (b) Micrograph at t = 12 min showing the non-uniform pseudo-equilibrium rod distribution. The
rods accumulate on the right side due to a gradient in swimming velocity and effective diffusivity imposed
by linear gradients in background H 2O2 and KCl. (c) Number of rods (2550 in total) as a function of space at
the beginning of the experiment (dashed lines) and the steady state distribution (solid lines). The number of
rods is shown for the experiments (blue), the Brownian Dynamics model (black), and continuum PDE model
(red). Panels (a)–(c) appeared in a previous review by our g roup28. (d) Chemotactic index as function of time
shown for the experiments (blue symbols), BD model (black), and PDE model (red). The error bars represent
one standard deviation. The chemotactic index is initially unity and, for this case, increases until it reaches an
equilibrium value of 4.6. Two movies showing accumulation are included in the Electronic supplementary
information: one showing an experiment and one showing a simulation case.
τ ~ 4 min until it reaches a pseudo-equilibrium CI ~ 5. Cases with large diffusivity gradient, dD/dx, and small
minimum diffusivity, Dmin, tend to attain higher equilibrium CI values.
Although Fig. 3c shows good agreement among the experiments, simulations, and model after 12 min, Fig. 3d
shows some disparity between the experimental estimates of CI and the BD and PDE predictions. Agreement
between experiments and predictions may be improved by introducing a weak dependence of rotational diffusiv-
ity on position. Specifically, if Drot were to increase with increasing H2O2 concentration and/or with decreasing
KCl concentration, this would effectively increase the predicted steady-state CI. Rods in high-salt, low-H2O2
regions may reorient less often (and thus be less likely to escape the low-motility region, where they accumulate)
and rods in high-H2O2, low-salt regions would reorient more often (and thus escape more frequently to low-
motility regions). In the PDE model, this would correspond to a case in which 0.5 < αwww.nature.com/scientificreports/
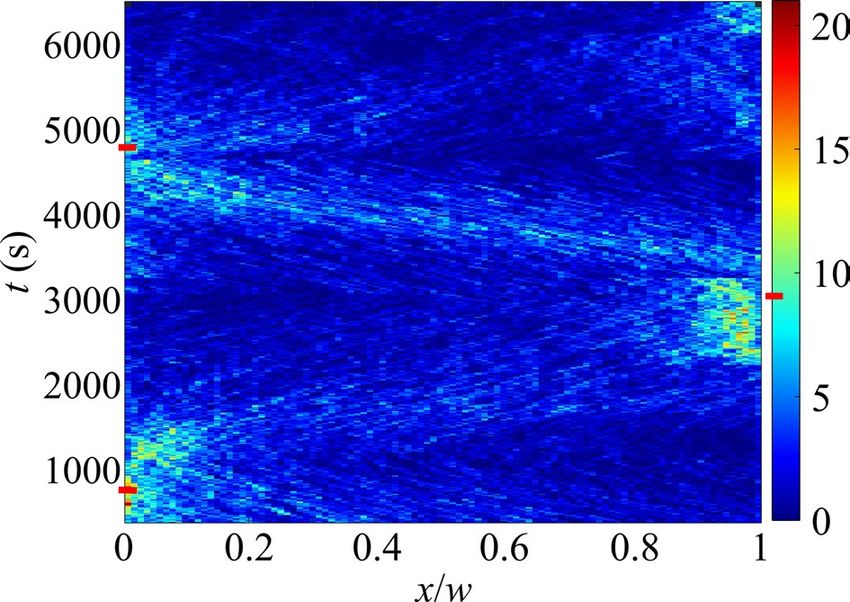
Figure 4. Accumulation of rods in alternating sides of the microchannel. In this figure, the channel is divided
into 100 bins. The color represents the average number of rods in that bin over a period of 100 s. Initially
(t = 0), the experiment is set up such that the H2O2 and KCl concentrations increase and decrease from x = 0 to
x = w, respectively. The gradient directions are switched at t = 800, 3100, and 4800 s (indicated by red dashes).
In each case, the rods preferentially accumulate in high-KCl, low-H2O2 regions (i.e., where the rods’ speed is
minimized) within 1000 s.
√
L= 2Dt. (9)
The characteristic time for diffusive particles to traverse a distance equal to L is then
L2
t= . (10)
2D
Let L be the width of the channel, in our case 400 μm. As discussed, the minimum and maximum values
of effective diffusivity in the experiments range from roughly Dmin = 6DB to Dmax = 120DB (see Fig. 2g), where
DB = 1 μm2/s. Inserting numerical values, we estimate that accumulation should begin to become significant after
approximately t = L2 /2Dmax = 666 seconds (about 11 min). As shown in Fig. 3b,c, accumulation is quantifiably
present after 12 min, in rough agreement with this prediction.
Using the PDE model, we compiled a phase map of the pseudo-equilibrium CI as a function of Dmin and dD/
dx. The theoretical phase map along with the experimental results is shown in Fig. 5a. The phase map exhibits
three distinct regions: (1) at low diffusivity gradient magnitude, there is no net accumulation and the rods exhibit
nearly uniform velocity/diffusivities over the entire space; (2) when the effective diffusivity of the rods dips below
the Brownian diffusivity Dmin < DB, this represents the case where the particles aggregate (and stop moving) or
reach a sticky boundary; (3) the physical regime where chemokinesis occurs, is that for which Dmin > DB and |dD/
dx|> 0. The experiments are performed for a variety of effective diffusivity gradients dD/dx, but all have a mini-
mum effective diffusivity near DB. If we normalize the effective diffusivity gradient by the minimum diffusivity,
we can collapse the entire phase map onto a single line as shown in Fig. 5b, which compares the predictions of the
PDE model (solid line) to experimental measurements (squares) and BD simulations (circles). The experiments,
model, and BD simulations show good agreement and indicate that the CI increases with increasing diffusivity
gradient. This is expected because stronger gradients result in greater net drift of high-diffusivity particles into
regions with low diffusivities.
Since the addition of electrolytes increases the viscosity of an aqueous solution, we sought to rule out viscosity
as a potential contributor to the accumulation of nanorods in KCl-rich regions of the channel. The viscosity of
aqueous KCl solutions was measured and tabulated by Grimes et al.82 By interpolating this data (presented in
the SI), we found that the viscosity of a KCl solution at the maximum concentration considered in our experi-
ments (approximately 54.5 µM) exceeds that of pure water by 0.00014% (less than 1 part per thousand). Thus,
we conclude that KCl-induced viscosity increases play a negligible role in the chemokinetic accumulation of
rods described in this work.
Summary
We have shown that Pt/Au self-propelled rods accumulate in low-motility regions when immersed in static fuel
gradients because of their chemokinetic response to H 2O2 and salt. This chemokinesis-induced accumulation is
similar to that observed in various prokaryotic and eukaryotic c ells20. We demonstrated good agreement between
experiments and both Brownian Dynamics simulations and a conservation equation based on the Fokker–Planck
Equation. Chemokinesis-based accumulation has the potential to be leveraged for a variety of applications includ-
ing environmental remediation, targeted drug delivery, self-healing materials, and more.
Although this study has focused on Pt/Au rods, it is important to note that our findings are expected to apply
generally to a variety of self-propelled particles that exhibit an orthokinetic response to fuel concentration. The
key components of this system necessary for chemokinesis-driven accumulation, namely orthokinetic response
Scientific Reports | (2021) 11:4785 | https://doi.org/10.1038/s41598-021-83963-x 8
Vol:.(1234567890)www.nature.com/scientificreports/
Figure 5. Steady-state chemotactic index. (a) Contour map generated from PDE model (Eq. (1)) showing
the equilibrium chemotactic index, CI, as function of the normalized effective diffusivity gradient
dD*/dx* = d(Deff/DB)/d(x/w) and D*min = Deff,,min/DB. Experiments are shown as colored squares, where the color
corresponds to the chemotactic index. The chemotactic index increases with decreasing minimum diffusivity
and increasing diffusivity gradient. Larger gradients result in a higher asymmetry in diffusion (higher on left)
and smaller minimum diffusivities result in rods that tend to remain at the right end where salt concentrations
are large. The white dashed line delineates a region where there is negligible accumulation (CI ≈ 1) because
the gradients in diffusivity are too small to result in asymmetric diffusion. A dashed black line shows the rod’s
Brownian diffusivity. Large CI values are attained below this diffusivity because the rods effectively become
spatially fixed due to their lack of motility. This corresponds to rods aggregating and losing motility or becoming
stuck to a physical boundary. (b) For linear effective diffusivity gradients, the contour plot can be collapsed onto
to a single line of CI as function of dD*/(dx* D*min). Open squares show experimental data, while black dots show
results from Brownian Dynamics simulations. For the BD simulation data, the abscissa is varied by changing the
minimum and maximum speeds, which in general simultaneously varies the effective diffusivity gradient and
the minimum effective diffusivity in the system.
to fuel and random motion trajectories, are observed in a wide variety of active colloid systems. In any active
colloid system in which the particle trajectory varies in a stochastic manner, the particles exhibit an orthoki-
netic response, and the gradient is reasonably strong, one can expect chemokinesis-driven accumulation will be
observed and the phase diagram in Fig. 5a will be applicable.
In the present work, we have assumed klinokinesis to be negligible. That is, we have assumed the rods’ rota-
tional velocity is independent of chemical concentration and is governed exclusively by rotational diffusion.
Likewise, the simulations assumed pure orthokinesis, and the agreement between the simulations and experi-
ments appears to validate this assumption. However, there are active colloid systems, such as Quincke r ollers83 or
Pt/Au-based microgears84, in which the rotational speed clearly depends on stimulus intensity (e.g. electric field
magnitude or local fuel concentration), and the collective dynamics of these systems are the subject of ongoing
study85. A logical extension of our work would be to study an active colloid system that exhibits both orthokinesis
and klinokinesis, and to elucidate the role of each in determining accumulation of particles in certain locations.
Received: 1 October 2020; Accepted: 2 February 2021
References
1. Suarez, S. S. & Pacey, A. A. Sperm transport in the female reproductive tract. Hum. Reprod. Update 12, 23–37 (2006).
2. Wilkinson, P. C. Assays of leukocyte locomotion and chemotaxis. J. Immunol. Methods 216, 139–153 (1998).
3. Tweedy, L. et al. Seeing around corners: Cells solve mazes and respond at a distance using attractant breakdown. Science 369 (2020).
4. Jékely, G. et al. Mechanism of phototaxis in marine zooplankton. Nature 456, 395–399 (2008).
5. Ward, A., Liu, J., Feng, Z. & Xu, X. Z. S. Light-sensitive neurons and channels mediate phototaxis in C. elegans. Nat. Neurosci. 11,
916–922 (2008).
6. Witman, G. B. Chlamydomonas phototaxis. Trends Cell Biol. 3, 403–408 (1993).
7. Berg, H. C. E. coli in Motion. (Springer, New York, 2008).
8. Taylor, B. L., Zhulin, I. B. & Johnson, M. S. Aerotaxis and other energy-sensing behavior in bacteria. Annu. Rev. Microbiol. 53,
103–128 (1999).
9. Zigmond, S. H. & Hirsch, J. G. Leukocyte locomotion and chemotaxis: New methods for evaluation, and demonstration of a cell-
derived chemotactic factor. J. Exp. Med. 137, 387–410 (1973).
10. Macnab, R. M. & Koshland, D. E. The gradient-sensing mechanism in bacterial chemotaxis. PNAS 69, 2509–2512 (1972).
11. Devreotes, P. N. & Zigmond, S. H. Chemotaxis in eukaryotic cells: A focus on leukocytes and dictyostelium. Annu. Rev. Cell Biol.
4, 649–686 (1988).
Scientific Reports | (2021) 11:4785 | https://doi.org/10.1038/s41598-021-83963-x 9
Vol.:(0123456789)www.nature.com/scientificreports/
12. Eisenbach, M. Chemotaxis. in Wiley Encyclopedia of Chemical Biology 1–8, https://doi.org/10.1002/9780470048672.wecb080
(American Cancer Society, 2009).
13. Dunn, G. Chemotaxis as a form of directed cell behaviour: Some theoretical considerations. Biol. Chemotactic Response 3, 1–26
(1981).
14. Ralt, D. et al. Chemotaxis and chemokinesis of human spermatozoa to follicular factors. Biol. Reprod. 50, 774–785 (1994).
15. Inamdar, M. V. et al. Assessment of sperm chemokinesis with exposure to jelly coats of sea urchin eggs and resact: A microfluidic
experiment and numerical study. J. Exp. Biol. 210, 3805–3820 (2007).
16. Richards, G. R., Millard, R. M., Leveridge, M., Kerby, J. & Simpson, P. B. Quantitative assays of chemotaxis and chemokinesis for
human neural cells. Assay Drug Dev. Technol. 2, 465–472 (2004).
17. Wilkinson, P. C. How do leucocytes perceive chemical gradients?. FEMS Microbiol. Immunol. 2, 303–311 (1990).
18. Brown, S., Poole, P. S., Jeziorska, W. & Armitage, J. P. Chemokinesis in Rhodobacter sphaeroides is the result of a long term increase
in the rate of flagellar rotation. Biochim. Biophys. Acta (BBA) Bioenerg. 1141, 309–312 (1993).
19. D’Orsogna, M. R., Suchard, M. A. & Chou, T. Interplay of chemotaxis and chemokinesis mechanisms in bacterial dynamics. Phys.
Rev. E 68, 021925 (2003).
20. Wilkinson, P. C., Lackie, J. M., Forrester, J. V. & Dunn, G. A. Chemokinetic accumulation of human neutrophils on immune
complex-coated substrata: Analysis at a boundary. J. Cell Biol. 99, 1761–1768 (1984).
21. Moran, J. L. 7—Robotic colloids: Engineered self-propulsion at the microscale (and smaller). in Robotic Systems and Autonomous
Platforms (eds. Walsh, S. M. & Strano, M. S.) 129–177, https: //doi.org/10.1016/B978-0-08-102260 -3.00007- X (Woodhead Publish-
ing, 2019).
22. Chi, Q., Wang, Z., Tian, F., You, J. & Xu, S. A review of fast bubble-driven micromotors powered by biocompatible fuel: Low-
concentration fuel, bioactive fluid and enzyme. Micromachines 9, 537 (2018).
23. Han, K., Shields, C. W. & Velev, O. D. Engineering of self-propelling microbots and microdevices powered by magnetic and electric
fields. Adv. Funct. Mater. 28, 1705953 (2018).
24. Chen, X.-Z. et al. Small-scale machines driven by external power sources. Adv. Mater. 30, 1705061 (2018).
25. Xu, T., Xu, L.-P. & Zhang, X. Ultrasound propulsion of micro-/nanomotors. Appl. Mater. Today 9, 493–503 (2017).
26. Ren, L., Wang, W. & Mallouk, T. E. Two forces are better than one: combining chemical and acoustic propulsion for enhanced
micromotor functionality. Acc. Chem. Res. 51, 1948–1956 (2018).
27. Xu, L., Mou, F., Gong, H., Luo, M. & Guan, J. Light-driven micro/nanomotors: From fundamentals to applications. Chem. Soc.
Rev. 46, 6905–6926 (2017).
28. Moran, J. L. & Posner, J. D. Phoretic self-propulsion. Annu. Rev. Fluid Mech. 49, 511–540 (2017).
29. Paxton, W. F. et al. Catalytic nanomotors: Autonomous movement of striped nanorods. J. Am. Chem. Soc. 126, 13424–13431 (2004).
30. Paxton, W. F., Sen, A. & Mallouk, T. E. Motility of catalytic nanoparticles through self-generated forces. Chem. Eur. J. 11, 6462–6470
(2005).
31. Wang, Y. et al. Bipolar electrochemical mechanism for the propulsion of catalytic nanomotors in hydrogen peroxide solutions.
Langmuir 22, 10451–10456 (2006).
32. Moran, J. L., Wheat, P. M. & Posner, J. D. Locomotion of electrocatalytic nanomotors due to reaction induced charge autoelectro-
phoresis. Phys. Rev. E 81, 065302 (2010).
33. Moran, J. L. & Posner, J. D. Electrokinetic locomotion due to reaction-induced charge auto-electrophoresis. J. Fluid Mech. 680,
31–66 (2011).
34. Moran, J. L. & Posner, J. D. Role of solution conductivity in reaction induced charge auto-electrophoresis. Phys. Fluids (1994-present)
26, 042001 (2014).
35. Golestanian, R., Liverpool, T. B. & Ajdari, A. Designing phoretic micro- and nano-swimmers. New J. Phys. 9, 126 (2007).
36. Mitchell, P. Self-electrophoretic locomotion in microorganisms—Bacterial flagella as giant ionophores. FEBS Lett. 28, 1–4 (1972).
37. Laocharoensuk, R., Burdick, J. & Wang, J. Carbon-nanotube-induced acceleration of catalytic nanomotors. ACS Nano 2, 1069–1075
(2008).
38. Sabass, B. & Seifert, U. Nonlinear, electrocatalytic swimming in the presence of salt. J. Chem. Phys. 136 (2012).
39. Liu, L. et al. How to make a fast, efficient bubble-driven micromotor: A mechanical view. Micromachines 8, 267 (2017).
40. Howse, J. R. et al. Self-motile colloidal particles: From directed propulsion to random walk. Phys. Rev. Lett. 99 (2007).
41. Gibbs, J. G. & Zhao, Y.-P. Autonomously motile catalytic nanomotors by bubble propulsion. Appl. Phys. Lett. 94 (2009).
42. Paxton, W. F. et al. Catalytically induced electrokinetics for motors and micropumps. J. Am. Chem. Soc. 128, 14881–14888 (2006).
43. Kagan, D. et al. Chemical sensing based on catalytic nanomotors: Motion-based detection of trace silver. J. Am. Chem. Soc. 131,
12082–12083 (2009).
44. You, M., Chen, C., Xu, L., Mou, F. & Guan, J. Intelligent micro/nanomotors with taxis. Acc. Chem. Res. 51, 3006–3014 (2018).
45. Choi, H., Lee, G.-H., Kim, K. S. & Hahn, S. K. Light-guided nanomotor systems for autonomous photothermal cancer therapy.
ACS Appl. Mater. Interfaces 10, 2338–2346 (2018).
46. Peng, F., Tu, Y., van Hest, J. C. M. & Wilson, D. A. Self-guided supramolecular cargo-loaded nanomotors with chemotactic behavior
towards cells. Angew. Chem. Int. Ed. 54, 11662–11665 (2015).
47. Baraban, L., Harazim, S. M., Sanchez, S. & Schmidt, O. G. Chemotactic behavior of catalytic motors in microfluidic channels.
Angew. Chem. Int. Ed. 52, 5552–5556 (2013).
48. Hong, Y., Blackman, N. M. K., Kopp, N. D., Sen, A. & Velegol, D. Chemotaxis of nonbiological colloidal rods. Phys. Rev. Lett. 99
(2007).
49. Adler, J. Chemotaxis in bacteria. Annu. Rev. Biochem. 44, 341–356 (1975).
50. Brumley, D. R. et al. Bacteria push the limits of chemotactic precision to navigate dynamic chemical gradients. PNAS 116, 10792–
10797 (2019).
51. Villanueva-Diaz, C., Vadillo-Ortega, F., Kably-Ambe, A., Diaz-Pérez, M. de los A. & Krivitzky, S. K. Evidence that human follicular
fluid contains a chemoattractant for spermatozoa. Fertil. Steril. 54, 1180–1182 (1990).
52. Ralt, D. et al. Sperm attraction to a follicular factor(s) correlates with human egg fertilizability. PNAS 88, 2840–2844 (1991).
53. Lämmermann, T. et al. Neutrophil swarms require LTB4 and integrins at sites of cell death in vivo. Nature 498, 371–375 (2013).
54. Popescu, M. N., Uspal, W. E., Bechinger, C. & Fischer, P. Chemotaxis of active janus nanoparticles. Nano Lett. 18, 5345–5349
(2018).
55. Ghosh, P. K., Li, Y., Marchesoni, F. & Nori, F. Pseudochemotactic drifts of artificial microswimmers. Phys. Rev. E 92, 012114 (2015).
56. Saha, S., Golestanian, R. & Ramaswamy, S. Clusters, asters, and collective oscillations in chemotactic colloids. Phys. Rev. E 89,
062316 (2014).
57. Tătulea-Codrean, M. & Lauga, E. Artificial chemotaxis of phoretic swimmers: Instantaneous and long-time behaviour. J. Fluid
Mech. 856, 921–957 (2018).
58. Kirby, B. Micro- and Nanoscale Fluid Mechanics Transport in Microfluidic Devices. (Cambridge University Press, 2010).
59. Dougherty, G. M. et al. The zeta potential of surface-functionalized metallic nanorod particles in aqueous solution. Electrophoresis
29, 1131–1139 (2008).
60. Lozano, C., ten Hagen, B., Löwen, H. & Bechinger, C. Phototaxis of synthetic microswimmers in optical landscapes. Nat. Commun.
7, 1–10 (2016).
Scientific Reports | (2021) 11:4785 | https://doi.org/10.1038/s41598-021-83963-x 10
Vol:.(1234567890)www.nature.com/scientificreports/
61. Jin, C., Krüger, C. & Maass, C. C. Chemotaxis and autochemotaxis of self-propelling droplet swimmers. PNAS 114, 5089–5094
(2017).
62. Joseph, A. et al. Chemotactic synthetic vesicles: Design and applications in blood-brain barrier crossing. Sci. Adv. 3, e1700362
(2017).
63. Campbell, A. I. & Ebbens, S. J. Gravitaxis in spherical Janus swimming devices. Langmuir 29, 14066–14073 (2013).
64. Archer, R. A. et al. pH-responsive catalytic Janus motors with autonomous navigation and cargo-release functions. Adv. Funct.
Mater. 2000324.
65. Martin, B. R. et al. Orthogonal self-assembly on colloidal gold-platinum nanorods. Adv. Mater. 11, 1021–1025 (1999).
66. Geiseler, A., Hänggi, P. & Marchesoni, F. Self-polarizing microswimmers in active density waves. Sci. Rep. 7, 41884 (2017).
67. Geiseler, A., Hänggi, P., Marchesoni, F., Mulhern, C. & Savel’ev, S. Chemotaxis of artificial microswimmers in active density waves.
Phys. Rev. E 94, 012613 (2016).
68. Ao, X. et al. Active Brownian motion in a narrow channel. Eur. Phys. J. Spec. Top. 223, 3227–3242 (2014).
69. Flowing Matter. (Springer, 2019).
70. Volpe, G., Buttinoni, I., Vogt, D., Kümmerer, H.-J. & Bechinger, C. Microswimmers in patterned environments. Soft Matter 7,
8810–8815 (2011).
71. van Teeffelen, S. & Löwen, H. Dynamics of a Brownian circle swimmer. Phys. Rev. E 78, 020101 (2008).
72. Buttinoni, I., Volpe, G., Kümmel, F., Volpe, G. & Bechinger, C. Active Brownian motion tunable by light. J. Phys. Condens. Matter
24, 284129 (2012).
73. Hong, Y., Velegol, D., Chaturvedi, N. & Sen, A. Biomimetic behavior of synthetic particles: From microscopic randomness to
macroscopic control. Phys. Chem. Chem. Phys. 12, 1423–1435 (2010).
74. Wheat, P. M. Collective Behavior of Swimming Bimetallic Motors in Chemical Concentration Gradients. (Arizona State University,
2011).
75. Rose, K. A., Meier, J. A., Dougherty, G. M. & Santiago, J. G. Rotational electrophoresis of striped metallic microrods. Phys. Rev. E
75, 011503 (2007).
76. Schnitzer, M. J. Theory of continuum random walks and application to chemotaxis. Phys. Rev. E 48, 2553–2568 (1993).
77. Risken, H. The Fokker-Planck Equation: Methods of Solution and Applications. (Springer, 2012).
78. Hänggi, P. & Thomas, H. Stochastic processes: Time evolution, symmetries and linear response. Phys. Rep. 88, 207–319 (1982).
79. Margie, O., Palmer, C. & Chin-Sang, I. C. C. elegans chemotaxis assay. J. Vis. Exp. https://doi.org/10.3791/50069 (2013).
80. Endres, R. G. & Wingreen, N. S. Accuracy of direct gradient sensing by single cells. PNAS 105, 15749–15754 (2008).
81. Arai, H., Tsou, C.-L. & Charo, I. F. Chemotaxis in a lymphocyte cell line transfected with C–C chemokine receptor 2B: Evidence
that directed migration is mediated by βγ dimers released by activation of Gαi-coupled receptors. PNAS 94, 14495–14499 (1997).
82. Grimes, C. E., Kestin, J. & Khalifa, H. E. Viscosity of aqueous potassium chloride solutions in the temperature range 25–150 degree
C and the pressure range 0–30 MPa. J. Chem. Eng. Data 24, 121–126 (1979).
83. Bricard, A., Caussin, J.-B., Desreumaux, N., Dauchot, O. & Bartolo, D. Emergence of macroscopic directed motion in populations
of motile colloids. Nature 503, 95–98 (2013).
84. Fournier-Bidoz, S., Arsenault, A. C., Manners, I. & Ozin, G. A. Synthetic self-propelled nanorotors. Chem. Commun. 441–443,
https://doi.org/10.1039/b414896g (2005)
85. Wang, W., Lv, X., Moran, J., Duan, S. & Zhou, C. A practical guide to active colloids: choosing synthetic model systems for soft
matter physics research. Soft Matter 16, 3846–3868 (2020).
Acknowledgements
J.L.M. and P.M.W. acknowledge support from National Science Foundation Graduate Research Fellowships.
N.A.M. acknowledges support from Science Foundation Arizona. This work received additional support from
the George Mason University Department of Mechanical Engineering and NSF grant CBET-0853379 (J.D.P.).
Author contributions
J.L.M., P.M.W., and J.D.P. conceived the project. J.L.M. and P.M.W. designed and performed the experiments.
P.M.W. and J.L.M. wrote the code for and performed the Brownian Dynamics simulations and PDE model.
N.A.M. wrote the video analysis software. J.L.M., P.M.W., and J.D.P. wrote the manuscript, and all authors pro-
vided feedback and revisions.
Competing interests
The authors declare no competing interests.
Additional information
Supplementary Information The online version contains supplementary material available at https://doi.
org/10.1038/s41598-021-83963-x.
Correspondence and requests for materials should be addressed to J.L.M. or J.D.P.
Reprints and permissions information is available at www.nature.com/reprints.
Publisher’s note Springer Nature remains neutral with regard to jurisdictional claims in published maps and
institutional affiliations.
Open Access This article is licensed under a Creative Commons Attribution 4.0 International
License, which permits use, sharing, adaptation, distribution and reproduction in any medium or
format, as long as you give appropriate credit to the original author(s) and the source, provide a link to the
Creative Commons licence, and indicate if changes were made. The images or other third party material in this
article are included in the article’s Creative Commons licence, unless indicated otherwise in a credit line to the
material. If material is not included in the article’s Creative Commons licence and your intended use is not
permitted by statutory regulation or exceeds the permitted use, you will need to obtain permission directly from
the copyright holder. To view a copy of this licence, visit http://creativecommons.org/licenses/by/4.0/.
© The Author(s) 2021
Scientific Reports | (2021) 11:4785 | https://doi.org/10.1038/s41598-021-83963-x 11
Vol.:(0123456789)You can also read