City of Mandurah Bushfire Risk Management Plan 2019 - 2023 - EPBC Act ...
←
→
Page content transcription
If your browser does not render page correctly, please read the page content below
City of Mandurah
Bushfire Risk Management Plan
               2019 – 2023
Document Control

Document Endorsements

The City of Mandurah Council endorses that the Bushfire Risk Management Plan (BRMP) has been reviewed
and assessed by the Office of Bushfire Risk Management as compliant with the standard for bushfire risk
management planning in Western Australia, the Guidelines for Preparing a Bushfire Risk Management Plan.
The City of Mandurah is the owner of this document and has responsibility, as far as is reasonable, to manage
the implementation of the Bushfire Risk Management Plan and facilitate the implementation of bushfire risk
management treatments by risk owners. The endorsement of the Bushfire Risk Management Plan by the City
of Mandurah council satisfies their endorsement obligations under section 2.3.1 of the State Hazard Plan
for Fire (Interim).

       Local Government              Representative                 Signature                  Date

Amendment List
 Version               Date                      Author                    Section

 1.0                   May 2019                  Myra Giardini             Emergency Management

 2.0                   July 2019                 Myra Giardini             Emergency Management

Publication Information

Wherever a third party holds copyright in material presented in this publication, the copyright remains with
that party. Their permission may be required to use the material.
This document contains Standards Australia Ltd and ISO copyrighted material that is distributed by SAI Global
on Standards Australia Ltd and ISO’s behalf. It may be reproduced in accordance with the terms of SAI Global
Ltd.’s Licence 1411-c083 to the Commonwealth of Australia (“the Licensee”). All licensed copies of this
document must be obtained from the Licensee. Standards Australia Ltd and ISO’s material is not for resale,
reproduction or distribution in whole or in part without written permission from SAI Global Ltd: Tel + 61 2
8206 6355 or copyright@saiglobal.com.

                                                       2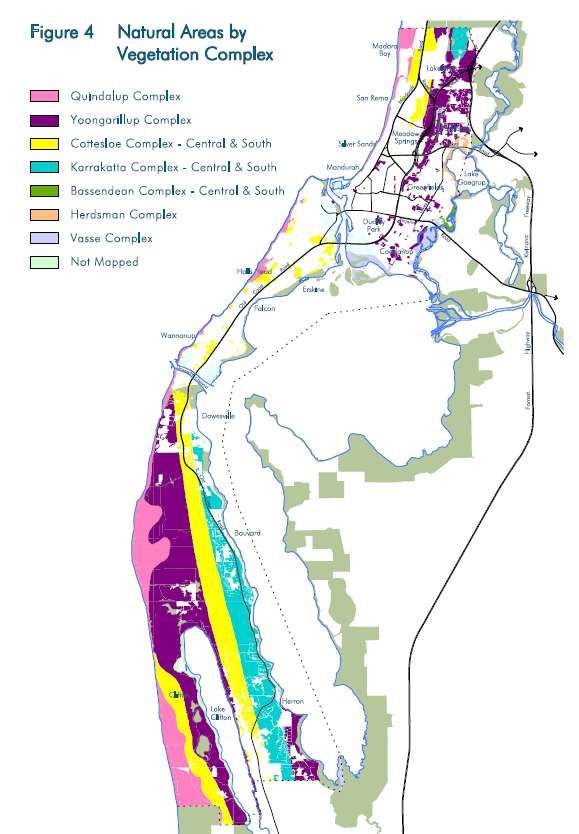
Contents

Document Control ......................................................................................................................................... 2
     Document Endorsements .................................................................................................................................2
     Amendment List ...............................................................................................................................................2
     Publication Information ....................................................................................................................................2
Table of Figures ............................................................................................................................................. 5
1.      Introduction .......................................................................................................................................... 6
     1.1        Background ...........................................................................................................................................6
     1.2        Aim and Objectives ...............................................................................................................................6
     1.3        Legislation, Policy and Standards .........................................................................................................7
        1.3.1          Legislation .....................................................................................................................................7
        1.3.2          Policies, Guidelines and Standards ...............................................................................................7
        1.3.3          Other Related Documents ............................................................................................................8
2.      The Risk Management Process .............................................................................................................. 9
     2.1        Roles and Responsibilities ................................................................................................................. 10
     2.2       Communication and Consultation ..................................................................................................... 11
3.      Establishing the Context ...................................................................................................................... 13
     3.1        Description of the Local Government and Community Context ....................................................... 13
        3.1.1          Strategic and Corporate Framework ......................................................................................... 13
        3.1.2          Location, Boundaries and Tenure .............................................................................................. 14
        3.1.3          Population and Demographics .................................................................................................. 15
        3.1.4          Economic Activities and Industry .............................................................................................. 18
     3.2        Description of the Environment and Bushfire Context ..................................................................... 19
        3.2.1          Topography and Landscape Features ........................................................................................ 19
        3.2.2          Climate and Bushfire Season ..................................................................................................... 19
        3.2.3           Vegetation ................................................................................................................................ 21
        3.2.4          Bushfire Frequency and Causes of Ignition ............................................................................... 22
4.      Asset Identification and Risk Assessment ............................................................................................ 24
     4.1        Planning Areas ................................................................................................................................... 24
        4.1.1         Priorities for Asset Identification and Assessment .................................................................... 24
     4.2        Asset Identification ............................................................................................................................ 24
     4.3        Assessment of Bushfire Risk .............................................................................................................. 25
        4.3.1          Likelihood Assessment .............................................................................................................. 26

                                                                                   3
4.3.2          Consequence Assessment ......................................................................................................... 26
        4.3.3          Assessment of environmental assets ........................................................................................ 28
        4.3.4          Local Government Asset Risk Summary .................................................................................... 28
5.      Risk Evaluation .................................................................................................................................... 29
     5.1        Evaluating Bushfire Risk..................................................................................................................... 29
     5.2        Treatment Priorities .......................................................................................................................... 29
     5.3        Risk Acceptability ............................................................................................................................... 29
6.      Risk Treatment .................................................................................................................................... 31
     6.1        Local Government Wide Controls ..................................................................................................... 31
     6.2        Asset Specific Treatment Strategies .................................................................................................. 31
     6.3        Determining the Treatment Schedule ............................................................................................... 32
7.      Monitoring and Review ....................................................................................................................... 34
     7.1        Review ............................................................................................................................................... 34
     7.2        Monitoring ......................................................................................................................................... 34
     7.3        Reporting ........................................................................................................................................... 34
8.      Glossary ............................................................................................................................................... 35
9.      Common Abbreviations ....................................................................................................................... 38
Table of Appendices .................................................................................................................................... 39
Appendix 1: Communications Strategy ....................................................................................................... 40
Appendix 2: Planning Area Maps ................................................................................................................ 48
     Vegetation Complexes of Mandurah............................................................................................................. 48
     Soil Type Areas .............................................................................................................................................. 49
     Bushfire Prone Areas – Mandurah North to Dawesville Cut ......................................................................... 50
     Bushfire Prone Areas – Dawesville Cut to Mandurah South ......................................................................... 51
Appendix 3 Asset Risk Register ................................................................................................................... 52
Appendix 4 Interim Treatment Schedule .................................................................................................... 56
Appendix 5 Local Government-Wide Controls, Multi-Agency Treatment Work Plan .................................. 59
Appendix 6 City of Mandurah Bush Fire Prevention and Control Policy ...................................................... 62
References .................................................................................................................................................. 66

                                                                                   4
Table of Figures

Figure 2: Risk Management Cycle ………………………………………………………………………………………………….…………….9
Figure 1: Mandurah forecast population, households and average household size…………………………………..….10
Figure 4: Age and gender demographics of Mandurah (2016)………………………………………………….….……………….14
Figure 5: Annual temperatures and rainfall for Mandurah 2001 – 2019 (BOM)…………………….………………………20

Table 1: Roles and Responsibilities.................................................................................................................... 10
Table 2: Key stakeholders in bushfire risk management planning in Mandurah .............................................. 12
Table 3: Strategic objectives met by the BRM Plan ........................................................................................... 13
Table 4: Overview of Land Tenure and Management within the Local Government Area2 ............................ 15
Table 5: Population by suburb from 2011 Census data .................................................................................... 17
Table 6: Employment (total) by industry in Mandurah ..................................................................................... 18
Table 7: Mandurah Long-Term Averages for Temperature and Rainfall 2001 – 2019 (BOM) .......................... 20
Table 8: Vegetation complexes occurring in Mandurah ................................................................................... 21
Table 9: City of Mandurah Landscape Ignition Data Summary 2015 - 2019 ..................................................... 22
Table 10: Mandurah Bushfires Summary of Size 2015 – 2019 .......................................................................... 23
Table 11 Priorities for Asset Identification and Assessment ............................................................................. 24
Table 12: Asset Categories and Subcategories .................................................................................................. 24
Table 13: Likelihood Ratings .............................................................................................................................. 26
Table 14: Consequence Ratings ......................................................................................................................... 26
Table 15: Mandurah Asset Risk Summary ......................................................................................................... 28
Table 16: Treatment priorities........................................................................................................................... 29
Table 17: Risk Acceptance Criteria (Risk Tolerance Table) ................................................................................ 30
Table 18: Priority treatments identified ............................................................................................................ 32

                                                                              5
1. Introduction
1.1 Background
The State Emergency Management Plan for Fire, State Hazard Plan – Fire, requires an integrated Bushfire Risk
Management Plan (BRM Plan) to be developed for each local government outlining a strategy to treat bushfire
related risk across all land tenures. This BRM Plan has been prepared for the City of Mandurah in accordance
with the requirements of State Hazard Plan - Fire and the Bushfire Risk Management Planning Guidelines for
preparing a Bushfire Risk Management Plan (BRM Plan Guidelines). The risk management processes used to
develop this plan are generally consistent with the key principles of AS/NZA ISO 31000:2009 Risk Management
– Principle and guidelines (ISO 31000:2009), as described in the Second Edition of the National Emergency Risk
Assessment Guidelines (NERAG 2014). Such an approach is consistent with the policies of the State Emergency
Management Committee, specifically State Emergency Management Policy 3.2– Emergency Risk Management
Planning.
The Bushfire Risk Management Plan is a strategic document that identifies assets at risk from bushfire and
their priority for treatment. The Treatment Schedule sets out a broad program of coordinated multi-agency
treatments to address risks identified in the Bushfire Risk Management Plan. Government agencies and other
land managers with responsibility for implementing treatments will participate in the Bushfire Risk
Management Plan process to ensure treatment strategies are collaborative and efficient, regardless of land
tenure.
1.2 Aim and Objectives
The aim of the Bushfire Risk Management Plan is to document a coordinated and efficient approach towards
the identification, assessment and treatment of assets exposed to bushfire related risk within the City of
Mandurah.
The objective of the Bushfire Risk Management Plan is to effectively manage bushfire related risk within the
City of Mandurah in order to protect people, assets and spaces of local value. Specifically, the objectives of
this plan are to:
Guide and coordinate a tenure blind, multi-agency bushfire risk management program over a five
year period;
Document the process used to identify, analyse and evaluate risk, determine priorities and develop a
plan to systematically treat risk;
Facilitate the effective use of financial and physical resources available for bushfire risk management
activities or to maximise treatment;
Integrate bushfire risk management into the business processes of local government, land owners
and other agencies;
Ensure there is integration between land owners and bushfire risk management programs and
activities;
Implement a process of continuous review and improvement to ensure treatment plans are
adaptable and risk is managed at an acceptable level;
Monitor and review the implementation of treatments to ensure treatment plans are adaptable and
risk is managed at an acceptable level.
6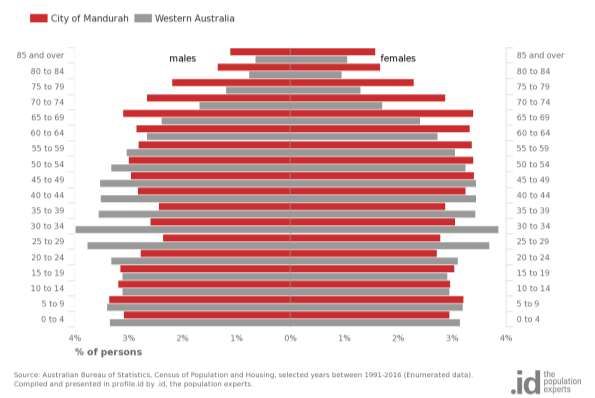
1.3 Legislation, Policy and Standards
The following legislation, policy and standards were considered to be applicable in development and
implementation of the BMRP.
1.3.1 Legislation
Bush Fires Act 1954
Emergency Management Act 2005
Fire Brigades Act 1942
Fire and Emergency Service Act 1998
Conservation and Land Management Act 1984
Contaminated Sites Act 2003
Environmental Protection Act 1986
Environmental Protection and Biodiversity Conservation Act 1999
Biodiversity Conservation Act 2016
Aboriginal Heritage Act 1972
Metropolitan Water Supply, Sewerage and Drainage Act 1909
Country Areas Water Supply Act 1947
Bush Fires Regulations 1954
Emergency Management Regulations 2006
Planning and Development (Local Planning Scheme) Regulations 2015
City of Mandurah Bushfire Brigades Local Law
1.3.2 Policies, Guidelines and Standards
National Emergency Risk Assessment Guidelines (NERAG) (Second Edition 2015)
State Emergency Management Policy 2.5 - Local Arrangements
State Emergency Management Policy 3.2 – Emergency Risk Management Planning
State Emergency Management Preparedness Procedure 8 – Local Emergency Management
Arrangements
State Planning Policy 3.7: Planning in Bushfire Prone Areas
State Planning Policy 3.4: Natural Hazards and Disasters
Guidelines for Planning in Bushfire Prone Areas (2015)
Western Australian Emergency Risk Management Guidelines (2005)
A Guide to the Use of Pesticides in Western Australia (Dept. of Health 2010)
Guidelines for Plantation Fire Protection (DFES 2011)
Firebreak Location, Construction and Maintenance Guidelines (DFES)
Bushfire Risk Management Planning Guideline (2015)
AS/NZS ISO 31000:2009 - Risk management – Principles and Guidelines
AS 3959-2009 Construction of buildings in bushfire-prone areas (2009)
PFBFP Guidelines (WAPC et al. 2010)
DFES Bushfire Prone Areas (as mapped by OBRM)
71.3.3 Other Related Documents
National Strategy for Disaster Resilience
National Statement of Capability for Fire and Emergency Services (AFAC 2015)
Public Service Circular No. 88 Use of Herbicides in Water Catchment Areas (DoH 2007)
Code of Practice for Timber Plantations in WA (Forest Products Commission 2006)
Bushfire Risk Management Planning Handbook
Bushfire Risk Management System User Guide
City of Mandurah Firebreak and Fuel Hazard Reduction Notice
Local reserve management plans
Visual Fuel Load Guide – for Mandurah (DFES Environmental Protection Branch April 2014)
City of Mandurah Bushfire Risk Management Plan 2015 (Strategen)
City of Mandurah Biodiversity Strategy November 2013
City of Mandurah 20 Year Strategic Community Plan 2017 – 2037
City of Mandurah Annual Report 2017-18
City of Mandurah Bushland Conservation Policy
City of Mandurah Coastal Management Policy
City of Mandurah Parks and Reserves Policy
City of Mandurah Risk Management Policy
City of Mandurah OHS Policy
City of Mandurah Bushfire Prevention and Control Policy
City of Mandurah Emergency Management Policy
City of Mandurah Unauthorised Clearing of Vegetation Policy
City of Mandurah Land Assets Policy
82. The Risk Management Process
The risk management processes used to identify and address risk in the Bushfire Risk Management Plan are
aligned with the international standard for risk management, ISO 31000:2009, as described in NERAG (2015).
This process is outlined in Figure 1 below.
Establish the context
Risk Assessment
Communication & consultation
Risk Identification
Monitoring & review
Risk Analysis
Risk Evaluation
Risk Treatment
Figure 2: Risk Management Cycle
92.1 Roles and Responsibilities
Table 1: Roles and Responsibilities
Stakeholder Name* Roles and Responsibilities
Local Government As custodian of the BRM Plan, coordination of the development and
ongoing review of the integrated BRM Plan.
Negotiation of commitment from land owners to treat risks identified in the
BRM Plan.
As a treatment manager, implementation of treatment strategies.
As part of the approval process, submission of the draft BRM Plan to the Office
of Bushfire Risk Management (OBRM) to review it for consistency with the
Guidelines.
As part of the approval process, submission of the final BRM Plan to
council for their endorsement and adoption.
Department of Fire and Participation in and contribution to the development and implementation of
Emergency Services BRM Plans, as per their agency responsibilities as the State Hazard Plan - Fire
(DFES) Hazard Management Agency.
Provide support to local government through expert knowledge and advice in
relation to the identification, prevention and treatment of bushfire risk.
Facilitation of local government engagement with state and federal
government agencies in the local planning process.
Undertake treatment strategies, including prescribed burning on behalf of
Department of Lands for Unmanaged Reserves and Unallocated Crown Land
within gazetted town site boundaries.
In accordance with Memorandums of Understanding and other
agreements, implementation of treatment strategies for other
landholders.
Office of Bushfire Risk Under the OBRM Charter, to ensure bushfire risk is managed in
Management (OBRM) accordance with AS/NZS ISO 31000 and reporting on the state of
bushfire risk across Western Australia.
Review BRM Plans for consistency with the Guidelines prior to final
endorsement by council.
Department of Participation in and contribution to the development and
Biodiversity implementation of BRM Plans.
Conservation and Providing advice for the identification of environmental assets that are
Attractions (DBCA) vulnerable to fire and planning appropriate treatment strategies for their
protection.
As treatment manager, implementation of treatment strategies on
department managed land and for Unmanaged Reserves and
Unallocated Crown Land outside gazetted town site boundaries.
In accordance with Memorandums of Understanding and other
agreements, implementation of treatment strategies for other
landholders.
1
Source: AS/NZS ISO 31000:2009, Figure 3, reproduced under SAI Global copyright Licence 1411-c083.
10Stakeholder Name* Roles and Responsibilities
Other State and Assist the local government by providing information about their assets and
Federal Government current risk treatment programs.
Agencies Participation in and contribution to the development and
implementation of BRM Plans.
As treatment manager, implementation of treatment strategies.
Public Utilities Assist the local government by providing information about their assets and
current risk treatment programs.
Participation in and contribution to the development and
implementation of BRM Plans.
As treatment manager, implementation of treatment strategies.
Corporations and As treatment manager, implementation of treatment strategies.
Private Land Owners
2.2 Communication and Consultation
Communication and consultation throughout the risk management process is fundamental to the preparation
of an effective Bushfire Risk Management Plan. Table 2 outlines the key stakeholders in bushfire risk
management planning in Mandurah; identified as having a significant role or interest in the planning process
or are likely to be significantly impacted by the outcomes.
To ensure appropriate and effective communication occurs with relevant stakeholders in the development,
implementation and monitoring of the BRM Plan, a Communication Strategy was prepared (provided in
Appendix 1). The level of engagement of each stakeholder group is related to, but not dependant on the level
of impact of outcomes respectively.
Internally the City has established an internal Bush Fire Mitigation Group, consisting of:
Executive Manager, Development and Compliance
Manager Environment and Arts
Manager Operations
Coordinator Ranger Service
Coordinator Emergency Management
Coordinator and Supervisor Natural Areas
Coordinator Landscape Services
Senior Development Officer (Also the Chief Bush Fire Control Officer and VRS Captain)
Senior Environmental Management Officer
Meeting bimonthly, this working group collaborate on all aspects of bushfire mitigation, informing the
schedule treatments in BRMS. This network also contribute to new landscape designs, ensuring they are taking
bushfire risk into consideration, minimising longer term mitigation and maintenance.
11Table 2: Key stakeholders in bushfire risk management planning in Mandurah
Level of
Stakeholder Role or interest impact of Level of engagement
outcomes
Community, Community Groups and Community Interest Groups
General Community Landholder, Human
Private Land Owners (residential, High Inform, Educate, Collaborate
Settlement
rural and commercial)
Coastcare / Bushcare Landholder, Human
High Inform, Educate, Collaborate
Groups Community Settlement
‘Embrace a Space’ participants Human Settlement High Inform, Educate, Collaborate
Mandurah Environmental Interested Party
Med Inform, Collaborate
Advisory Group
Interested Party
Traditional Owners High Inform, Collaborate
Local Emergency Management Interested Party
Low Inform
Committee
Mandurah Bush Fire Advisory Interested Party
Committee Med Inform, Collaborate
Local Governments
City of Rockingham Neighboring LGA Low Inform
Shire of Murray Neighboring LGA Low Inform
Shire of Waroona Neighboring LGA Low Inform
Bushfire Brigades, Bushfire Ready Groups and JAFFA program leaders
Southern District Volunteer Bush
Fire Brigade Interested Party Med Inform, Collaborate, Empower
Mandurah Volunteer Fire and
Rescue Service Interested Party Med Inform, Collaborate
Falcon Volunteer Fire and
Rescue Service Interested Party Med Inform, Collaborate
123. Establishing the Context
3.1 Description of the Local Government and Community Context
The City of Mandurah is Western Australia’s largest regional city and covers an area of 173.5km. It is home to
more than 85,000 people with an average increase of 1500 new residents each year over the past five years.
Between 2016 and 2036, the population for the City of Mandurah is forecast to increase by 36,778 persons
(44.26% growth), at an average annual change of 1.85%.
Mandurah boasts a typical Mediterranean climate and relaxed coastal lifestyle which provides a unique
work/life balance opportunity. Between the Indian Ocean, the expansive waterways of the Peel-Harvey
Estuary and the lower reaches of the Serpentine River, this unique location boasts some of the best water
based activity facilities in Western Australia.
Mandurah is a superb place to live and raise a family. It offers an exciting mix of residential developments,
from family homes and modern apartments within new estates to luxurious homes nestled among canal
waterways. Mandurah forms part of the Peel Region, located just one hour’s drive from Perth and lying
between the metropolitan area and the South West Region. It is bordered by the Indian Ocean to the west,
with Jarrah forests and farmlands of the Darling Range leading east to the bordering wheat belt.
3.1.1 Strategic and Corporate Framework
This BRM Plan aligns with the City of Mandurah Strategic Community Plan 2017 – 2037 across all five focus
areas: Environment, Social, Economic, Identity and Organisational Excellence (Table 3).
Table 3: Strategic objectives met by the BRM Plan
Corporate Objectives Bushfire Risk Management Plan
Environment Protect and ensure the health of our natural Proactive and collaborative bushfire planning and
environment and waterways prevention ensures that mitigation works are
undertaken in a manner that supports biodiversity
and environmental protection.
Encourage and enable our community to The Embrace a Space program and established
take ownership of our natural assets, and to volunteer programs support community
adopt behaviours that assist in achieving participation in bushfire prevention and control.
our environmental targets.
Factor climate change predictions into land- Decisions are based on both legislative
use planning, building design and future requirements and an organisation wide focus to
council decisions. future proof our community for climate changes
ahead.
Social Help build our community’s confidence in Significant resources are dedicated to carrying out
Mandurah as a safe and secure city. annual inspections, ensuring properties are
compliant with fire control requirements. Every
property is assessed and works undertaken if
required.
Economic Develop a strong and sustainable tourism Tourism is a key industry to Mandurah, with
industry. transient communities presenting are range of
challenges in respect to emergencies. The Prepare
the Peel Tourism Project undertaken in 2018 aimed
13to enhance emergency preparedness within the Peel
tourism industry by raising awareness in the short-
term accommodation sector, better preparing the
service provider and traveller for emergency events.
A range of resources were developed and shared,
including a Crisis Essentials Guide for Tourism
Businesses.
Identity Encourage active community participation Officers use a range of forums and existing networks
and engagement. to encourage a shared responsibility in emergency
planning, prevention, response and recovery. For
example, vulnerable communities are represented
at the Local Emergency Management Committee
has two aged care organisations within its
membership.
Organisational Ensure the City has the capacity and Mandurah is one of the few local governments in
Excellence capability to deliver appropriate services WA to have a position dedicated solely to
and facilities. emergency management, enabling increased focus
to planning, preparedness and prevention.
In 2019 / 20 the City will appoint a bushfire
mitigation officer provide specific focus to bushfire
mitigation and maintenance of the Bushfire Risk
Management System.
The implementation of processes used in achieving the relevant key focus area criteria is outlined in the 4 year
Corporate Business Plan and further detailed in annual operational plans and annual budget allocations. The
City of Mandurah is committed to a proactive and collaborative approach to bushfire risk management as
demonstrated by:
The Bushfire Mitigation Group review Bushfire Risk Management Plan and treatment schedules.
Shared opportunities in bushfire related training e.g. Fuel Hazard Assessment training.
3.1.2 Location, Boundaries and Tenure
The City of Mandurah is located some 50km south of the Perth CBD, bounded by the City of Rockingham to
the north, the Shire of Murray, the Serpentine River and Harvey Estuary to the east, the Shire of Waroona to
the south, and the Indian Ocean to the west.
Mandurah is the largest of five Local Government Areas (LGAs) that comprise Western Australia’s Peel Region,
on the southern fringe of the Perth Metropolitan Region. The other LGAs include: Serpentine-Jarrahdale;
Murray; Waroona; and Boddington. The City of Mandurah extends from Madora Bay and Lakelands in the
north to Herron and Lake Clifton in the south. The Mandurah local government area is approximately 50km
long, yet only 8km wide at its widest point.
Mandurah is a rapidly developing residential area, the City encompasses a total land area of about 173.5
square kilometres, including substantial waterways, coastline and bushland. A breakdown of the tenure with
the City of Mandurah municipality is shown below in Table 4.
14Table 4: Overview of Land Tenure and Management within the Local Government Area2
Land Manager/Agency* % of Local Government
Area
Local Government (Reserves/Crown Land) 51.85%
Private/Freehold 48.15%
Department of Biodiversity Conservation and Attractions 33.33%
Department of Lands 8.47%
Water Corporation 0.14%
Electrical Networks Corporation 0.00% (only 3 parcels)
Department of Water 0.05%
Department of Training & Workforce Development 0.15%
Department of Education 0.25%
Police Service 0.01%
Public Transport Authority of WA 0.08%
Department of Transport 0.67%
Health Departments of WA 0.12%
Department of Fire and Emergency Services 0.00% (only 1 parcel)
Other Vacant/Crown Land 3.01%
3.1.3 Population and Demographics
European settlement dates from the 1830s when Thomas Peel and a number of pioneers set up in what is now
Mandurah. Population was minimal until 1850 when a road was built to the region and a ferry across the
estuary opened. Early industries included fishing, fruit growing and canning. Some growth took place from the
late 1800s. From early 1900s, the area became renowned as a holiday destination, and tourism became an
important contributor to the local economy. Significant residential development occurred during the
immediate post-war years, particularly in holiday dwellings. More substantial growth took place from the
1970s, especially in permanent dwellings. Rapid growth continued from the early 1990s, with the population
of the City increasing from under 27,000 in 1991 to 85,302 in 2018.
As per the 2018 Australian Bureau of Statistics Census data, the City of Mandurah had a total population of
85,302. The population is forecast to continue growing steadily, to reach approximately 119, 872 by 2036. This
means that Mandurah will become home to almost 50,000 new residents over the next two decades. Figures
2 and 3 highlight these trends, as well as the age group distribution across the population in 2011 as compared
with those on both state and national levels. Table 5 provides a population breakdown by suburb.
15Figure 3: Mandurah forecast population, households and average household size
Mandurah is rapidly growing as a sea-change and retirement destination. The 2016 Census indicated that 22.7
percent of the Mandurah population is aged 65 or over, compared to the state average of 13.8 percent.
As a result of the link between disability and age, and the large increase expected in the number of older
Western Australians, the total number of people with disabilities is projected to increase substantially by
approximately 38 per cent to an expected 632,600 by 2023.
With such a large and growing aged care population, vulnerable communities cannot rely solely on the already
stretched emergency services and are encouraged to undertake their own emergency evacuation planning, as
captured in the City of Mandurah Vulnerable Communities Plan.
Cultural diversity is also increasing in Mandurah with the 2016 ABS census data showing Mandurah has having
between 20 – 40% of the population as migrants, with an increasing number of those from non-English
speaking backgrounds.
Understanding the complexities of the Mandurah community is essential for emergency planning, specifically
knowing those with who may have limited ability to receive, understand or act on information, prior to or
during an emergency.
16Figure 4: Age and gender demographics of Mandurah (2016)
Table 5: Population by suburb from 2011 Census data
Suburb Total Population % of total population
Bouvard 821 1.2%
Clifton 4 0.0%
Coodanup 3,526 5.0%
Dawesville 4,299 6.1%
Dudley Park 5,751 8.2%
Erskine 4,100 5.9%
Falcon 4,666 6.7%
Greenfields 9,939 14.2%
Halls Head 13,044 18.7%
Herron 429 0.6%
Lakelands 2,923 4.2%
Madora Bay 1,721 2.5%
Mandurah 7,327 10.5%
Meadow Springs 5,920 8.5%
Parklands 539 0.8%
San Remo 884 1.3%
Silver Sands 1,241 1.8%
Wannanup 2,769 4.0%
173.1.4 Economic Activities and Industry
Mining and Construction are the Peel Region’s main industries, with manufacturing, retail, tourism,
agriculture, fishing and forestry also being major contributors to the region’s economy.
Mandurah’s main employment industries are construction, retail and manufacturing. These sectors are the
largest employers, and are in decline. Meanwhile industries such as mining, education and training, health
care and social assistance, accommodation and food services, public administration and safety each
demonstrated strong growth in Mandurah between 2006 and 2011. There were more technicians and trades
workers in in 2011 than in any other occupation, this still reflected in 2017 (see Table 6).
Tourism is a key industry in Mandurah and the Peel Region, attracting around 1.4 million overnight visitors per
year, generating approximately $271 million in revenue for the local economy (2014/15 National Institute of
Economic Research). The impressive landscape brings with it a number of risks, with around 70% of the region
being designated as bushfire prone, and a 1:100 year flood event having the potential of doubling waterway
surface areas and significantly impacting local and transient communities.
The predominant use of land in the vicinity of the subject reserves is residential or rural development. High
density urban residential development is prevalent throughout the suburbs of Halls Head, Falcon, Dawesville
(east), San Remo, Dudley Park, Riverside Gardens, Wannanup and Melros. These areas are generally associated
with a high level of vegetation clearance with smaller pockets of vegetation retained amongst individual
residences, adjacent to the coast or adjacent to large surface watercourses such as the Peel inlet.
Lower density rural residential development is prevalent throughout the suburbs of Parklands, Dawesville
(west), Bouvard and Herron. These areas are generally associated with a higher level of vegetation retention
both on privately owned lots and throughout surrounding reserve and conservation land.
Table 6: Employment (total) by industry in Mandurah
City of Mandurah 2017/18 2011/12 Change
2011/12 to
Industry Number % WA % Number % WA %
2017/18
Agriculture, Forestry and Fishing 158 0.6 2.7 105 0.5 2.5 +53
Mining 86 0.3 7.2 71 0.3 7.4 +15
Manufacturing 736 2.8 5.7 936 4.4 7.9 -199
Electricity, Gas, Water & Waste Services 157 0.6 1.3 143 0.7 1.4 +14
Construction 2,216 8.3 10.4 1,690 8.0 10.5 +525
Wholesale Trade 252 0.9 2.6 306 1.4 3.5 -54
Retail Trade 5,483 20.5 9.7 4,139 19.5 9.8 +1,344
Accommodation and Food Services 2,868 10.7 6.8 2,238 10.6 5.8 +630
Transport, Postal and Warehousing 691 2.6 4.6 682 3.2 4.8 +9
Information Media and Telecoms. 291 1.1 1.1 303 1.4 1.3 -12
Financial and Insurance Services 651 2.4 2.4 344 1.6 2.6 +307
Rental, Hiring & Real Estate Services 563 2.1 1.7 575 2.7 1.8 -13
Professional, Scientific & Tech. Services 1,003 3.7 6.6 737 3.5 7.2 +266
Administrative and Support Services 1,047 3.9 3.3 855 4.0 3.3 +192
Public Administration and Safety 1,251 4.7 6.3 1,076 5.1 6.1 +175
Education and Training 2,984 11.1 9.6 2,238 10.5 8.1 +747
Health Care and Social Assistance 4,415 16.5 12.3 3,362 15.8 10.3 +1,052
Arts and Recreation Services 584 2.2 1.8 404 1.9 1.6 +180
Other Services 1,337 5.0 4.1 1,009 4.8 4.1 +329
Total Industries 26,775 100.0 100.0 21,214 100.0 100.0 +5,561
Source: National Institute of Economic and Industry Research (NIEIR) ©2018. Compiled and presented in economy.id by .id.
183.2 Description of the Environment and Bushfire Context
3.2.1 Topography and Landscape Features
Mandurah lies within the Swan Coastal Plain Bioregion and possesses an array of vegetation communities,
from coastal dunes and sand plains to Banksia and eucalypt woodlands. Dune systems dominate the coastline,
with limestone outcrops found to the north of the City. Coastal dune vegetation is characterised by scrub-
heath communities associated with low woodlands dominated by Banksia while inland is dominated by
eucalypt woodlands. Given the tendency for some of these vegetation communities to accumulate fuel loads,
the potential for fire to spread and produce fires of greater intensity increases thus reducing the likelihood of
rapid suppression. Treatment options in many of these areas are limited by the presence of peat soils,
Threatened Ecological Communities such as the Ramsar listed Peel-Harvey Estuary and areas of
Commonwealth (EPBC Act) listed Banksia Woodlands TEC.
Topography throughout the Swan Coastal Plain is predominantly flat to gently undulating with slopes
averaging around 0-5 degrees; however, steep topography does exist throughout coastal dune areas and
limestone outcrops with slopes up to 15 degrees. These areas are problematic as steep, sandy hills are difficult
to negotiate with heavy machinery and fire appliances.
The steepest topography with the City of Mandurah occurs along the coastal strip in association with dune
systems, as well as throughout limestone ridges that occur predominantly along the southern section of Old
Coast Road. Elevation throughout the municipality ranges from 0-60m AHD (Australian Height Datum)
(Strategen Environmental Consultants 2015).
3.2.2 Climate and Bushfire Season
City of Mandurah experiences a Mediterranean climate characterised by mild, wet winters and warm to hot,
dry summers. The Bureau of Meteorology (BoM) weather station that records the full suite of mean monthly
climate statistics for coastal areas in the vicinity of Mandurah is located in the suburb, Halls Head. Figure 4
demonstrates the annual temperatures and rainfall for Mandurah.
The City undertakes annual reviews of the Bush Fire Prevention and Control Policy EMS01 (Appendix 6) to
ensure that it aligns with best practice and seasonal changes. Restricted burning is permitted from 1 April and
30 November each year, with the prohibited burning period extending from 1 December and 31 March each
year. To reduce the risk of escape, land owners are not permitted to undertake running or mosaic burns at
any time of year without the assistance of the local bush fire brigade.
Predominant and worst case fire weather conditions are based on long term climate statistics recorded by
Bureau of Meteorology (BoM). These statistics provide insight into potential bushfire scenarios and fire
behaviour during the designated bushfire season, as well as conditions appropriate for prescribed burning
during the cooler months of late autumn, winter and early spring, taking into consideration wind speed and
direction, relative humidity, temperature and moisture content.
19Figure 5: Annual temperatures and rainfall for Mandurah 2001 – 2019 (BOM)
Southwest Western Australia generally experiences a cool to mild growing season in the months of August
through to November of each year, followed by four months of summer drought conditions. During this period,
the potential for bushfire is considered to be at its peak.
The worst fire weather conditions occur during this dry period when a low pressure trough forms off the west
coast and strong winds develop from the north and northeast. These conditions are sometimes associated
with ‘Extreme’ or ‘Catastrophic’ fire dangers, which are consistent with very high temperatures, low relative
humidity and very strong winds. Based on the predominant summer climatic conditions of the local area,
‘Extreme’ or ‘Catastrophic’ fire dangers occur less than 5% of the time during the designated bushfire season,
which equates to around six days between December and March. Table 7 summarises the statistics rainfall
and temperature for Mandurah.
Table 7: Mandurah Long-Term Averages for Temperature and Rainfall 2001 – 2019 (BOM)
Statistics Jan Feb Mar Apr May Jun Jul Aug Sep Oct Nov Dec Annual
Mean maximum temperature (°C) 29.4 29.7 27.8 24.1 21.2 18.7 17.5 18.0 19.0 21.9 24.8 27.0 23.3
Mean minimum temperature (°C) 18.9 19.3 18.1 15.8 13.5 11.5 10.7 11.0 11.7 13.5 15.6 17.1 14.7
Mean rainfall (mm) 18.4 12.1 16.5 39.1 90.6 115.7 117.2 97.7 64.2 30.7 22.7 16.7 666.7
Decile 5 (median) rainfall (mm) 3.1 2.9 13.1 33.5 76.3 113.4 126.4 96.5 57.7 27.8 19.2 5.4 654.7
Mean rainy days ≥ 1 mm 1.6 1.3 2.6 5.4 8.4 11.6 15.2 12.4 10.2 5.4 4.1 2.2 80.4
Predominant fire weather conditions are those that occur 95% of the time during the designated bushfire
season. For the City of Mandurah municipality, these generally correlate with average January climatic
conditions (Strategen Environmental Consultants 2015).
DFES Weekly Intelligence Briefings, which are now shared with Local Governments provide a State Wide
Intelligence Overview including the likelihood of bushfires for the Metropolitan Region.
203.2.3 Vegetation
The Mandurah environment is particularly unique as it has a high diversity of ecosystems inclusive of riverine,
estuarine and coastal foreshores, wetlands and bushlands, coastal heathland, and Tuart-Jarrah-Marri-Banksia
woodlands as reflected in Table 8 (or refer to maps provided in Appendix 2).
Of the 16 725 ha of vegetated land that existed within the local government area prior to European settlement
only 8600 hectares of natural areas remain, approximately 50 per cent of the original extent. Of these
remaining areas approximately 3840 ha is within land managed for conservation by the State Government and
650 ha is managed for conservation and passive recreation by the City of Mandurah.
Within the modified landscape of Mandurah just over 2000 ha is managed by the City as sporting ovals,
parkland cleared open spaces, playgrounds and developed reserves with the balance being urban
development and rural residential development.
Given the patterns of development within the City, there are several areas where urban develop intersects
with undeveloped bushland, this includes the interface between houses and coastal reserves along most of
the 50km of coast within the City and development in Dawesville adjacent the Tim’s Thicket reserve.
Table 8: Vegetation complexes occurring in Mandurah
Pre-
Current % Extent of
European
Vegetation Complex & Description Extent
Extent Remainin BRM Plan
(ha) g area (%)
(ha)
Central & South - ranges from woodland of Jarrah - Sheoak -
Bassendean
Banksia species to low woodland of Melaleuca species, & 73.08 23.64 32.35 0.46
Complex
sedge lands on the moister sites.
Central & South - Mosaic of woodland of Tuart and open
Cottesloe
forest of Tuart - Jarrah - Marri; closed heath on the 4,696.10 1,805.94 38.46 29.9
Complex
Limestone outcrops.
Herdsman Sedgelands (closed tussock grassland) and fringing woodland
245.35 53.16 21.67 1.56
Complex of Flooded Gum - Melaleuca species.
Karrakatta Central & South - Predominantly open forest of Tuart - Jarrah
1,760.00 1,174.80 66.75 11.22
Complex - Marri & woodland of Jarrah - Banksia species
Coastal dune complex consisting mainly of two alliances - the
Quindalup strand & fore-dune alliance and the mobile & stable dune
1,897.63 1,267.75 66.81 12.1
Complex alliance. Varies between closed scrub of Acacia rostellifera
(Summer-scented Wattle) & closed or open heath
Mixture of the closed scrub of Melaleuca species fringing
Vasse woodland of Flooded Gum - Melaleuca species &open forest
506.80 188.82 37.26 3.22
Complex of Tuart - Jarrah - Marri. Will include areas dominated by
Tecticornia & Sarcocornia (Samphire) near Mandurah
Woodland to tall woodland of Tuart with Peppermint in the
Yoongarillup
second storey. Less consistently an open forest of Tuart - 6,501.01 3,060.84 47.08 41.46
Complex
Jarrah - Marri.
213.2.4 Bushfire Frequency and Causes of Ignition
A report provided by DFES Operational Information System Branch summarises landscape fire ignitions from
June 2015 to March 2019. The number of ignitions has trended downward since 2016/17, this may be
attributed to a changing weather conditions, increased community education and awareness, targeted arson
programs and improved reporting.
Mandurah’s gazetted fire district is from the northern boundary to the northern prolongation of Williams
Street Melros, this is serviced by one career fire brigade and two volunteer fire and rescue units. The
Mandurah Southern Districts bush fire brigade are first response to bushfires south of William Street, Melros
to the southern border at Herron. The size and nature of fires attended may be influenced early reporting,
rapid response times and largely developed areas.
There were 353 bushfires attended to across Mandurah between mid-2015 and 2019, as listed in Table 9. Of
these, 56.9% of ignitions (recorded in Table 10) were reported as suspicious/deliberate behaviour (201), 18.5%
cigarette butts (65); and 13% re-ignition from a previous fire (27). Mitigation works undertaken in connection
with the BRM Plan aim to minimize the impact of bushfires when they occur.
Table 9: City of Mandurah Landscape Ignition Data Summary 2015 - 2019 2015/ 2016/ 2017/ 2018/ Total
2016 2017 2018 2019
Total Number of Bushfires: 71 118 81 83 353
Burn off fires 2 9 1 2 14
Campfires/bonfires/outdoor cooking 3 0 2 2 7
Cigarette 17 7 26 15 65
Construction, installation, design deficiency 0 1 0 0 1
Equipment - Mechanical or electrical fault 0 1 0 0 1
Fireworks/flares 0 0 1 1 2
Hot works (grinding, cutting, drilling etc.) 1 0 1 0 2
Human Error (Left on, knock over, unattended etc.) 0 1 0 2 3
Improper Fueling / Cleaning/Storage/Use of material ignited 0 0 0 1 1
Other open flames or fire 1 6 1 4 12
Power lines 1 0 0 1 2
Reigniting of previous fire 5 11 4 7 27
Suspicious/Deliberate 38 72 43 48 201
Undetermined 1 4 0 0 5
Unreported 1 1 0 0 2
Vehicles (incl. Farming Equipment/Activities) 0 2 0 0 2
Weather Conditions - Lightning 1 0 1 0 2
Weather Conditions (High winds, natural combustion etc. Excludes Lightning) 0 3 1 0 4
22Table 10: Mandurah Bushfires Summary of Size 2015 – 2019
Only available where reported. The size of a fire is an estimation from the attending Officer in Charge.
2015/2016 2016/2017 2017/2018 2018/2019 Total
Total Number of Bushfires: Size
71 118 81 83 353
Reported (hectares)
1 or less 58 98 45 62 263
2-5 1 6 2 0 9
6 to 10 1 0 0 0 1
10+ 1 1 0 0 2
Not Known 10 13 34 21 78
234. Asset Identification and Risk Assessment
4.1 Planning Areas
The City of Mandurah Bushfire Risk Management Plan has been divided into two planning areas, Mandurah
North and South. The Planning areas are divided by the Dawesville Cut. Appendix 2 includes maps of bushfire
prone areas occurring within each planning area.
4.1.1 Priorities for Asset Identification and Assessment
Assets were identified and assessed across Mandurah, based on the order of priority outline in Table 11,
informed by Asset Category and Subcategory.
Table 11 Priorities for Asset Identification and Assessment
Planning
Priority Asset Category Asset Subcategory
Area
First Priority Human Settlement Special Risk and Critical Facilities All
Second Priority Human Settlement All other subcategories All
Third Priority Economic Critical Infrastructure All
Fourth Priority Economic All other subcategories All
Fifth Priority Environmental All subcategories All
Sixth Priority Cultural All subcategories All
4.2 Asset Identification
Asset identification and risk assessment has been conducted at the local level, using the risk assessment
methodology described in the Bushfire Risk Management Plan Guidelines. Identified assets have been mapped
recorded and assessed in the Bushfire Risk Management System (BRMS). Identified assets are categorised into
the subcategories (Table 12).
Table 12: Asset Categories and Subcategories
Asset Category Asset Subcategories
Human Settlement Residential areas
Rural properties and urban interface areas.
Places of temporary occupation
Commercial, mining and industrial areas located away from towns and population
centres (i.e. not adjoining residential areas).
Special risk and critical facilities
Hospitals, nursing homes, schools and childcare facilities, tourist accommodation
and facilities, prison and detention centres, local government administration
centres and depots, incident control centres, designated evacuation centres,
emergency services.
Economic Agricultural
Pasture, grazing, livestock, crops, wineries and other farming, silos and sales yards.
Commercial and industrial
24Major industry, waste treatment plants, mines, mills and processing/manufacturing
facilities, cottage industry.
Critical infrastructure
Power lines and substations, water and gas pipelines, telecommunications
infrastructure, railway lines, bridges, port facilities and waste water treatments
plants.
Tourist and recreational
Tourist attractions and recreational sites that generate significant tourism and/or
employment within the local area.
Commercial forests and plantations
Drinking water catchments
Environmental Protected
Rare and threatened flora and fauna, ecological communities and protected
wetlands.
Priority
Fire sensitive species and ecological communities.
Locally important
Nature conservation and research sites, habitats, species and communities
considered to be of local importance.
Cultural Aboriginal heritage
Places of indigenous significance.
Recognised heritage
Assets afforded legislative protection through identification by the National Trust,
State Heritage List or Local Planning Scheme Heritage List.
Local heritage
Assets identified in a Municipal Heritage Inventory or identified by the local
community.
Other assets of cultural value e.g. Halls, community centres, clubs, places of
worship and recreation facilities.
4.3 Assessment of Bushfire Risk
Risk assessments have been undertaken for each asset or group of assets identified using the methodology
described in the Bushfire Risk Management Plan Guidelines. Where an asset falls into more than one asset
category, a risk assessment is completed under each category selected. The risk assessment that results in the
highest risk rating will be used as the overall risk rating and treatment priority for the asset. While not assets
in Mandurah have been identified and mapped, some 68% of those currently recorded are Human Settlement.
Asset Category Percentage of identified assets
Human Settlement 68%
Economic 6%
Environmental 24%
Cultural 2%
254.3.1 Likelihood Assessment
Likelihood is described as the chance of a bushfire igniting, spreading and reaching an asset. The approach
used to determine the likelihood rating is the same for each asset category; Human Settlement, Economic,
Environmental and Cultural. There are four possible likelihood ratings: unlikely, possible, likely and almost
certain (see Table 13).
Table 13: Likelihood Ratings
Likelihood Rating Description
Almost Certain Is expected to occur in most circumstances;
High level of recorded incidents and/or strong anecdotal evidence; and/or
(Sure to Happen) Strong likelihood the event will recur; and/or
Great opportunity, reason or means to occur;
May occur more than once per year.
Likely Will probably occur in most circumstances; and/or
(Probable) Regular recorded incidents and strong anecdotal evidence; and /or
Considerable opportunity, reason or means to occur;
May occur at least once per year.
Possible Should occur at some stage; and/or
(feasible but < probable) Few, infrequent, random recorded incidents or little anecdotal evidence; and/or
Some opportunity, reason or means to occur;
May occur once every 2 to 4 years.
Unlikely Could occur only on exceptional circumstances;
(Improbable, not likely) May occur once in 5 years or more.
4.3.2 Consequence Assessment
Consequence is described as the outcome or impact of a bushfire event. The approach used to determine the
consequence rating is different for each asset category; Human Settlement, Economic, Environmental and
Cultural. There are four possible consequence ratings: minor, moderate, major and catastrophic (Table 14).
Table 14: Consequence Ratings
Consequence Descriptions
Rating
Minor No fatalities.
Near misses or minor injuries with first aid treatment possibly required.
No persons are displaced.
Little or no personal support (physical, mental, emotional) required.
Inconsequential or no damage to an asset, with little or no specific recovery efforts
required beyond the immediate clean-up.
Inconsequential or no disruption to community.
Inconsequential short-term failure of infrastructure or service delivery. (Repairs occur
within 1 week, service outages last less than 24 hours.)
Inconsequential or no financial loss. Government sector losses managed within standard
financial provisions. Inconsequential disruptions to businesses.
Moderate Isolated cases of serious injuries, but no fatalities. Some hospitalisation required,
managed within normal operating capacity of health services.
Isolated cases of displaced persons who return within 24 hours.
Personal support satisfied through local arrangements.
26You can also read