Classification and mapping of European fuels using a hierarchical, multipurpose fuel classification system
←
→
Page content transcription
If your browser does not render page correctly, please read the page content below
Earth Syst. Sci. Data, 15, 1287–1315, 2023
https://doi.org/10.5194/essd-15-1287-2023
© Author(s) 2023. This work is distributed under
the Creative Commons Attribution 4.0 License.

           Classification and mapping of European fuels using a
           hierarchical, multipurpose fuel classification system
             Elena Aragoneses1 , Mariano García1 , Michele Salis2 , Luís M. Ribeiro3 , and Emilio Chuvieco1
            1 Universidadde Alcalá, Environmental Remote Sensing Research Group, Departamento de Geología,
                         Geografía y Medio Ambiente, Colegios 2, 28801 Alcalá de Henares, Spain
       2 National Research Council (CNR), Institute of BioEconomy (IBE), Traversa La Crucca 3, 07100 Sassari, Italy
       3 Universidade de Coimbra, Association for the Development of Industrial Aerodynamics (ADAI), Department

                   of Mechanical Engineering, Rua Luís Reis Santos, Pólo II, 3030-788 Coimbra, Portugal
                                 Correspondence: Elena Aragoneses (e.aragoneses@uah.es)

                                     Received: 27 May 2022 – Discussion started: 25 July 2022
                        Revised: 5 December 2022 – Accepted: 21 February 2023 – Published: 22 March 2023

       Abstract. Accurate and spatially explicit information on forest fuels becomes essential to designing an inte-
       grated fire risk management strategy, as fuel characteristics are critical for fire danger estimation, fire propa-
       gation, and emissions modelling, among other aspects. This paper proposes a new European fuel classification
       system that can be used for different spatial scales and purposes (propagation, behaviour, and emissions). The
       proposed classification system is hierarchical and encompasses a total of 85 fuel types, grouped into six main
       fuel categories (forest, shrubland, grassland, cropland, wet and peat/semi-peat land, and urban), plus a nonfuel
       category. For the forest cover, fuel types include two vertical strata, overstorey and understorey, to account for
       both surface and canopy fuels. In addition, this paper presents the methods to map fuel types at the European
       scale, including the first-level of the classification system. Land cover, biogeographic datasets, and bioclimatic
       modelling were used. The final map, which is publicly available (https://doi.org/10.21950/YABYCN; Aragone-
       ses et al., 2022a), included 20 fuel categories at 1 km spatial resolution. A first assessment of this map was
       performed using field information obtained from LUCAS (Land Use and Coverage Area frame Survey), com-
       plemented with high-resolution data. This validation exercise provided an overall accuracy of 88 % for the main
       fuel types and 81 % for all mapped fuel types. To facilitate the use of this fuel dataset in fire behaviour modelling,
       an assignment of fuel parameters to each fuel type was performed by developing a crosswalk to the standard fuel
       models defined by Scott and Burgan (2005; FBFMs – Fire Behavior Fuel Models), considering European climate
       diversity. This work has been developed within the framework of the FirEUrisk project, which aims to create a
       European-integrated strategy for fire danger assessment, reduction, and adaptation.

1   Introduction                                                    (van Wees et al., 2021). Wildland fires also threaten human
                                                                    lives and properties and can cause important socioeconomic
Fire is a key disturbance factor for the dynamics (Thonicke         impacts (Bowman et al., 2017, 2020).
et al., 2001; Pausas and Keeley, 2009) and distribution (Bond          Estimations based on coarse-resolution satellite obser-
et al., 2005) of the vegetation ecosystems globally. Wildland       vations indicate that around 4 Mkm2 (million kilometres
fires affect forests’ function (Bowman et al., 2009), structure     squared) are burnt globally every year (Giglio et al., 2018;
(Koutsias and Karteris, 2003), and adaptation (Pausas and           Lizundia-Loiola et al., 2020), although this evaluation is very
Keeley, 2009), while significantly contributing to emissions        conservative, as they are based on coarse-resolution satellite
of greenhouse gases (van Der Werf et al., 2017; Zheng et al.,       data, which have shown to include significant omission er-
2021), soil erosion (Shakesby, 2011), water and air pollution       rors (Boschetti et al., 2019; Franquesa et al., 2022). The Eu-
(Smith et al., 2011; Duc et al., 2018), and land cover change

Published by Copernicus Publications.
1288                                                      E. Aragoneses et al.: Classification and mapping of European fuels

ropean territory is highly affected by wildland fires, which       Models (FBFMs; Scott and Burgan, 2005), which have been
cause environmental, societal, and economical losses (San-         created for the United States. Other commonly used fuel
Miguel-Ayanz et al., 2020, 2021). In 2021, about 500 000 ha        classification systems are the Fuel Characteristic Classifica-
were burnt in the European Union, of which 20 % affected           tion System (FCCS; Ottmar et al., 2007), the Canadian Fire
Natura 2000 and other protected sites, especially in southern      Behaviour Prediction System (Forestry Canada Fire Danger
Europe. August was the worst month, including very large           Group, 1992), and the Mediterranean–European Prometheus
fires. Around 28 % of the total burnt area affected forest, and    system (European Commission, 1999; Arroyo et al., 2008).
25 % belonged to agricultural land types (San-Miguel-Ayanz         Although they have been developed for specific regions and
et al., 2022). In addition, global climate change will likely      conditions, they have been widely used to map fuel types in
increase the wildland fire risk and impacts in most of the Eu-     other regions (García et al., 2011; Palaiologou et al., 2013;
ropean territory (Jones et al., 2022; IPCC, 2022). This justi-     Marino et al., 2016; Aragoneses and Chuvieco, 2021).
fies the necessity of improving the current efforts to prevent        Fuel types have been usually mapped through fieldwork,
and contain wildland fires in Europe (San-Miguel-Ayanz et          aerial photointerpretation, ecological modelling, and exist-
al., 2021).                                                        ing datasets and/or remote sensing (Arroyo et al., 2008). Re-
   As it is well known, the fire environment concept defines       mote sensing methods previously applied to fuel type map-
the three key elements influencing fire initiation, propaga-       ping include a wide range of techniques and input data,
tion, and effects. These are weather, topography, and fuel         from medium (Palaiologou et al., 2013; Alonso-Benito et al.,
(Countryman, 1972). Fire behaviour is highly dependent on          2013; Marino et al., 2016; Aragoneses and Chuvieco, 2021)
fuel (vegetation) characteristics, which is the only variable      to high spatial resolutions (Arroyo et al., 2006; Mallinis et al.,
that can be managed to reduce fire propagation. In addition,       2008). Both passive (Alonso-Benito et al., 2013; Aragoneses
fuel properties play a critical role in fire ignition (Alvarado    and Chuvieco, 2021) and active sensors (Riaño et al., 2003;
et al., 2020) and in the atmospheric emissions derived from        González-Olabarria et al., 2012) have been used, in addition
fires, particularly in the smouldering–flaming ratio of fire be-   to a combination of sensors (Mutlu et al., 2008; García et al.,
haviour (Zheng et al., 2021).                                      2011; Palaiologou et al., 2013; Marino et al., 2016).
   Vegetation types with similar fire behaviour are grouped           Fuel maps exist for continental scales, such as South
into fuel types and models (Pyne, 1984). The former indi-          America (Pettinari et al., 2014) and Africa (Pettinari and
cate categories of vegetation with similar characteristics from    Chuvieco, 2015), and global scales but include categories
a fire behaviour perspective. The latter refer to the specific     that are too coarse to be operationally applicable to Euro-
parameters required to model their fire behaviour (height,         pean conditions (Pettinari and Chuvieco, 2016). However, in
load, bulk density, and particle size, among others). Fuel         Europe, fuel mapping has been mostly developed for local
types refer to the surface or canopy layers. Forest understorey    and regional scales (Roulet, 2000; García et al., 2011; Ste-
and low vegetation formations are surface fuels, while forest      fanidou et al., 2020). The only European-level fuel cartogra-
crowns and tall shrubs represent canopy fuels. Fire usually        phy is the 2000 EFFIS (2017) fuel map (European Forest Fire
starts in surface fuels but may transfer to canopy fuels, caus-    Information System), which is based on land cover and veg-
ing crown fires, which are more dangerous than surface fires       etation maps and using the NFFL system. Other works have
as they release more energy and propagate in larger fronts,        mapped FBFM fuel models (Scott and Burgan, 2005) for the
making them harder to control (Scott and Reinhardt, 2001).         European subcontinental scale, such as the Iberian Peninsula
   Fuel type mapping is essential in fire risk prevention, plan-   (Aragoneses and Chuvieco, 2021).
ning, and real-time fire management across multiple spatial           The lack of an adapted-to-Europe fuel classification strat-
scales (Keane et al., 2001) because it allows us to spatially      egy is limiting, since fuel models are site specific and should
describe a key factor in fire management (Keane and Reeves,        be applied to the region for which they were developed to ob-
2012), while fire scientists require accurate and updated fuel     tain the most realistic fuel mapping and modelling (Arroyo et
maps to support fire strategic planning within a comprehen-        al., 2008). In this context, the ArcFUEL project (Bonazoun-
sive fire danger assessment system. However, fuel mapping          tas et al., 2014) proposed a methodology to enable consis-
is challenging due to the high temporal and spatial variability    tent fuel mapping production over Europe, based on a hier-
in fuels (Keane et al., 2001).                                     archical vegetation fuel classification system adapted to Eu-
   The starting point of fuel mapping is the definition of         ropean conditions (Toukiloglou et al., 2013). Nevertheless, a
a consistent fuel classification system, which includes fuel       European fuel map was not generated; only southern Euro-
types and models (parameters). Many fuel classification sys-       pean countries at national (Portugal and Greece) and regional
tems have been developed, although the most common refer           (Spain and Italy) scales were mapped (Bonazountas et al.,
just to surface fuels (Arroyo et al., 2008), thus limiting their   2014).
capability to prevent and manage crown fires (the most se-            Considering the current limitations of European fuel map-
vere).                                                             ping, this paper had three objectives. The first one was gen-
   This is the case of the Northern Forest Fire Laboratory         erating a fuel classification system to facilitate the integra-
(NFFL) system (Anderson, 1982) and the Fire Behavior Fuel          tion of continental wildfire risk assessment, including both

Earth Syst. Sci. Data, 15, 1287–1315, 2023                                          https://doi.org/10.5194/essd-15-1287-2023

E. Aragoneses et al.: Classification and mapping of European fuels                                                          1289

surface and canopy fuel types. The proposed classification         each resulting fuel type category and would also lead to dif-
system should be hierarchical to facilitate the integration of     ferent fire behaviour. The first-level main categories were de-
fuel maps at different spatial scales, include both surface and    fined as follows:
canopy fuel types, and be suitable for different purposes,
                                                                     – Forest, which includes areas with tree canopy cover
from fire behaviour simulation to fire emissions or fire danger
                                                                       above 15 %, with a mean tree height ≥ 2 m, follow-
assessment. The second objective was to develop a European
                                                                       ing the Copernicus Global Land Cover legend (Tsend-
fuel map at 1 km spatial resolution, following the proposed
                                                                       bazar et al., 2020), which is based on the UN LCCS
fuel classification system. We aimed to develop a methodol-
                                                                       (United Nations Land Cover Classification System)
ogy that, by combining expert knowledge, a geographic in-
                                                                       from the UNESCO (United Nations Educational, Sci-
formation system (GIS), available datasets, and bioclimatic
                                                                       entific and Cultural Organization; UNESCO, 1973) and
modelling, might be easily replicable and updated with low
                                                                       the FAO (Food and Agriculture Organization, 2000).
time and economic costs. Finally, the third objective was to
                                                                       Understorey type refers to the fuel type with which the
assign surface fuel parameters to the derived fuel types, by
                                                                       surface fire will spread in the forest.
relating them to existing fuel models. We chose the FBFM
standard fuel models (Scott and Burgan, 2005), as this sys-          – Shrubland, which includes shrubs and scrub. It may
tem is widely used and very flexible. These three objectives           have small trees ≤ 2 m and tree canopy cover
1290 E. Aragoneses et al.: Classification and mapping of European fuels
Figure 1. General overview of the structure of this work.
It was not found relevant to further disaggregate non- detailed information can be available. In this paper, the Eu-
fuels by mapping water, snow, ice, bare soil, and sparse ropean fuel map was generated for the first level of the pro-
vegetation, but it could be easily introduced if desired at posed fuel classification system, covering all European conti-
high spatial resolutions. nental countries at 1 km spatial resolution. This product was
developed to help the strategic planning of fire management
Forest categories were divided into two vertical strata, for in Europe through generating a continental map with a ho-
which the first level referred to the overstorey (canopy) char- mogeneous and integrated fuel classification system for all
acteristics and the second level to the understorey character- countries, which would allow us to carry out standardised
istics. Further subdivisions were included in the first level fire risk analysis and inform fire managers and policy-makers
by considering the leaf type (broadleaf or needleleaf), the from a risk-wise holistic perspective for Europe.
leaf deciduousness (evergreen or deciduous), and the frac-
tional cover (open or closed). The lower stratum referred to
3 The European fuel map
the understorey characteristics by identifying the type of sur-
face vegetation (grassland, shrubland, or timber litter) and its 3.1 Study area
height. This allowed us to define the surface and canopy char-
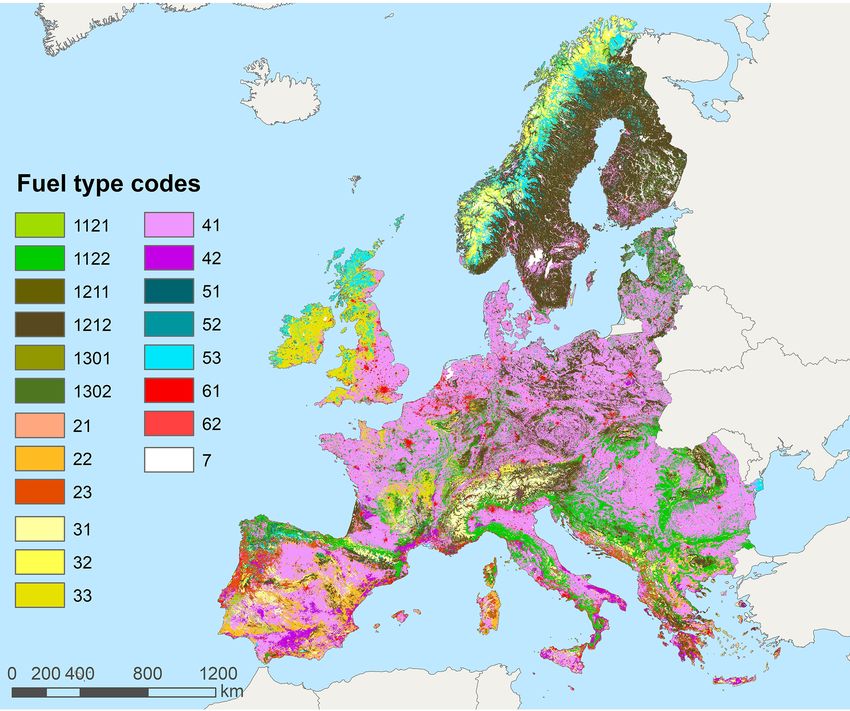
acteristics of the fuels in the forest, which can help to account The study area is the European territory, as defined by the
for both surface and crown fires. For the rest of the main fuel FirEUrisk project, with around 5 Mkm2 of land covering 33
types, only one vertical stratum (first level) was identified. countries (Fig. 2). The European countries historically most
For shrubland and grassland fuel types, subcategories were affected by wildland fires have been Portugal, Spain, Italy,
created based on fuel bed depth (height of the surface fuel Greece, and France. However, a recent increase in fire activ-
layer). ity in higher latitudes has been observed, e.g. fires in Sweden
Discriminating all the proposed categories may be quite in 2018 (San-Miguel-Ayanz et al., 2021) and the fire between
challenging and should be adapted to the working scale of the Czech Republic and Germany in 2022 (Global Disaster
the fuel type product and, accordingly, to the quality of the Alert and Coordination system, 2022). The most dangerous
input data available to produce it. The fuel type categories fire conditions in the European territory, and particularly in
of the first level (Table 1) should be more suitable for conti- the most-affected southern European Union countries, are
nental or global fuel products, while the second level should usually observed during the summer months, which repre-
be better adapted to local or regional studies, where more sent the period in which fuel conditions are most favourable
Earth Syst. Sci. Data, 15, 1287–1315, 2023 https://doi.org/10.5194/essd-15-1287-2023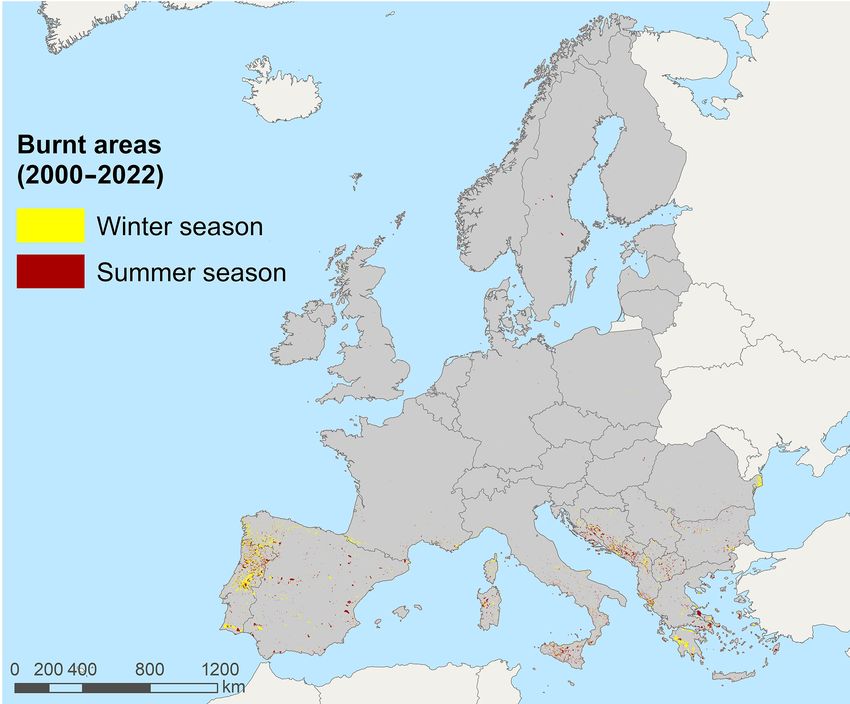
E. Aragoneses et al.: Classification and mapping of European fuels                                                              1291

Table 1. A total of 24 first-level FirEUrisk fuel types expected to be mapped at continental scale. See Table A1 in Appendix A for the
complete FirEUrisk fuel classification system.

                                 FirEUrisk fuel type                              FirEUrisk fuel type
                      Code    Description                          Code     Description
                      1111    Open broadleaf evergreen forest      23       High shrubland [≥ 1.5 m)
                      1112    Closed broadleaf evergreen forest    31       Low grassland [0–0.3 m)
                      1121    Open broadleaf deciduous forest      32       Medium grassland [0.3–0.7 m)
                      1122    Closed broadleaf deciduous forest    33       High grassland [≥ 0.7 m)
                      1211    Open needleleaf evergreen forest     41       Herbaceous cropland
                      1212    Closed needleleaf evergreen forest   42       Woody cropland
                      1221    Open needleleaf deciduous forest     51       Wet and peat/semi-peat land – tree
                      1222    Closed needleleaf deciduous forest   52       Wet and peat/semi-peat land – shrubland
                      1301    Open mixed forest                    53       Wet and peat/semi-peat land – grassland
                      1302    Closed mixed forest                  61       Urban continuous fabric
                      21      Low shrubland [0–0.5 m)              62       Urban discontinuous fabric
                      22      Medium shrubland [0.5–1.5 m)         7        Nonfuel

                                                                           Due to the similarity between the fuel types of the
                                                                        FirEUrisk fuel classification system and the 2019 discrete
                                                                        Copernicus Global Land Cover map (Copernicus GLC map)
                                                                        legend (Buchhorn et al., 2020), this land cover dataset was
                                                                        used as the main information source for the generation of
                                                                        the European fuel map. The Copernicus GLC map has 100 m
                                                                        resolution and is based on the PROBA-Vegetation (PROBA-
                                                                        V) sensor (Buchhorn et al., 2020), with an overall accuracy
                                                                        of 79.9 % for continental land cover categories and 72.8 %
                                                                        for regional land cover categories over Europe (Tsendbazar
                                                                        et al., 2020). We used the Copernicus GLC map to extract the
                                                                        information on fuel types, and whenever the land cover infor-
                                                                        mation of this source was insufficient to map a FirEUrisk fuel
                                                                        type, we used the three following input datasets to derive the
                                                                        required information.

                                                                          1. The 2020 global Climate Change Initiative Land Cover
                                                                             map (CCI LC map) at 300 m resolution is based on the
Figure 2. Study area and burnt areas from 1 January 2000 up to
                                                                             Medium Resolution Imaging Spectrometer (MERIS),
27 January 2022 in winter and summer seasons. Note: source data
for the burnt area have been taken from EFFIS (2021).
                                                                             PROBA-V, and Sentinel-3 Ocean and Land Colour In-
                                                                             strument (OLCI; Copernicus Climate Change Services,
                                                                             2020), with an overall accuracy of 70.5 % (Defourny et
                                                                             al., 2021).
for fire ignition and spread. The peak of the fire season can
be different in other European areas, as observed in winter               2. The 2018 pan-European CORINE Land Cover raster
(e.g. Alps and Pyrenees) or spring (central and northern Eu-                 map (CLC map) at 100 m resolution is based on the
rope; San-Miguel-Ayanz et al., 2021).                                        Sentinel-2 MultiSpectral Instrument (MSI) and Land-
                                                                             sat 8 Thematic Mapper (TM) images (European Union
                                                                             Copernicus Land Monitoring Service, 2018), with an
3.2     Methods to obtain the European fuel map                              overall accuracy of 92.67 % (European Union Coperni-
                                                                             cus Land Monitoring Service, 2021).
3.2.1    Input data
                                                                          3. The 2019 fraction cover Copernicus Global Land Cover
The generation of the European fuel map with the targeted                    map at 100 m resolution for the built-up category (built-
first-level fuel types (Table 1) was based on the combination                up fraction cover Copernicus GLC map; Buchhorn et
of existing land cover and biogeographic regions datasets                    al., 2020) is based on the World Settlement Footprint
covering European territory and bioclimatic models.                          2015 map (Marconcini et al., 2020) and yearly updated

https://doi.org/10.5194/essd-15-1287-2023                                              Earth Syst. Sci. Data, 15, 1287–1315, 2023
1292                                                      E. Aragoneses et al.: Classification and mapping of European fuels

     OpenStreetMap images, with a mean absolute error of                forest from the CCI LC map for forest cover. The pix-
     0.8 % (Tsendbazar et al., 2020).                                   els identified as unknown forest in the Copernicus GLC
                                                                        map but not as forest in the CCI LC map were assigned
   The Copernicus GLC map (Buchhorn et al., 2020) and the               the category of the CCI LC map.
built-up fraction cover Copernicus GLC map (Buchhorn et
al., 2020) were downloaded in tiles for the study area and           b. Shrubland fuel types. The shrubland cover was ex-
mosaicked. All input datasets were reprojected to ETRS89                tracted from the Copernicus GLC map (Buchhorn et
Lambert azimuthal equal area, using the nearest-neighbour               al., 2020). To our knowledge, no global or European
method, with the same spatial resolution as the Copernicus              datasets on shrubland fuel bed depth, which is the
GLC map. The input datasets were also clipped to the study              height of the shrubland layer, are available. This vari-
area.                                                                   able is quite important, as shrubland depth is directly
   Also, to account for fuel bed depth categories (low,                 related to shrubland productivity (Radloff and Mucina,
medium, and high shrubland and grassland fuel types),                   2007; Saglam et al., 2008; Ali et al., 2015), which is
we used bioclimatic models (Saglam et al., 2008; Smit et                mainly determined by the mean annual precipitation
al., 2008; Fick and Hijmans, 2017; Bohlman et al., 2018;                (MAP; Shoshany and Karnibad, 2015; Paradis et al.,
H. Zhang et al., 2018) to relate environmental conditions               2016; Bohlman et al., 2018; X. Zhang et al., 2018)
with fuel bed depth.                                                    through biomass accumulation (Keeley and Keeley,
   To account for bioclimatic variations across Europe, we              1977; Schlesinger and Gill, 1980; Gray and Schlesinger,
used the 2016 dataset of Europe’s biogeographic regions by              1981; Bohlman et al., 2018). This is especially rele-
the EEA (European Environment Agency, 2016). The study                  vant in the arid/semi-arid regime like the Mediterranean
area had nine biogeographic regions, namely alpine, Arc-                (Shoshany and Karnibad, 2011). Therefore, shrubland
tic, Atlantic, Black Sea, boreal, continental, Mediterranean,           fuel bed depth was obtained from a bioclimatic model
Pannonian, and Steppic. For each biogeographic region, we               adapted to arid/semi-arid conditions with three steps,
analysed climate graphs from 1861 to 2019 of several rep-               which are, first, mapping the European MAP, second,
resentative cities using the ClimateCharts.net platform (Zep-           estimating the shrubland productivity from MAP, and
ner et al., 2020). The biogeographic regions, whose climate             third, estimating the shrubland fuel bed depth from pro-
graphs presented at least 1 dry summer month, were assigned             ductivity. Bioclimatic models adapted to the whole of
to the arid/semi-arid regime. A dry summer month is inter-              Europe’s conditions do not exist, so we used the re-
preted as a month for which the sum of monthly precipi-                 gional, already-calibrated models which best related
tation (mm yr−1 ) is less than twice the mean month tem-                to European shrubland conditions (mostly located in
perature (◦ C; Zepner et al., 2020). The biogeographic re-              arid/semi-arid zones) as an approximation.
gions not meeting this condition were assigned to the sub-              Global 1970–2000 MAP at 1 km resolution was ob-
humid/humid regime. The final general bioclimatic regimes               tained from the WorldClim version 2 dataset (Fick and
were rasterised to 100 m and 1 km resolution using the max-             Hijmans, 2017). The data were reprojected from the
imum area method.                                                       World Geodetic System 1984 (WGS84) geographic lat-
                                                                        itude/longitude to ETRS89 Lambert azimuthal equal
3.2.2   Generation of the European fuel map
                                                                        area using the bilinear method and clipped using the Eu-
                                                                        ropean shrubland mask.
Methods to generate the European fuel map are summarised                The estimation of shrubland productivity was based on
in Fig. 3.                                                              a linear model (Eq. 1) that related shrubland produc-
                                                                        tivity and MAP for California (Bohlman et al., 2018).
  a. Forest fuel types. Information on the leaf type, leaf de-          This model was derived from a literature review, and
     ciduousness, and fractional cover of forest fuels was ob-          Californian bioclimatic conditions are similar to those
     tained from the Copernicus GLC map (Buchhorn et al.,               of European arid/semi-arid regions, as can be checked
     2020). This dataset defines all the first-level forest fuel        in the ClimateCharts.net platform (Zepner et al., 2020).
     types in the FirEUrisk fuel classification system, plus            Therefore, it was used to calculate the mean potential
     two more categories only referring to fractional cover,            shrubland productivity for each pixel.
     i.e. unknown open forest and unknown closed forest.
     Pixels falling in these two categories were overlapped             Biomass (g m−2 ) = 9.6696 MAP (mm yr−1 ) − 1301.7 (1)
     with the CCI LC map (Copernicus Climate Change Ser-
     vices, 2020), previously resampled from 300 to 100 m               Finally, we used a linear empirical model (Eq. 2) that
     using the nearest-neighbour method to match the reso-              related the shrubland fuel bed depth and productivity
     lution of the Copernicus GLC map. This allowed deter-              for two study areas in Türkiye (Saglam et al., 2008),
     mining the leaf type (broadleaf or needleleaf) and leaf            which are similar to European conditions, with 650
     deciduousness (evergreen or deciduous) of the unknown              and 1200 mm yr−1 mean precipitation. We applied this

Earth Syst. Sci. Data, 15, 1287–1315, 2023                                        https://doi.org/10.5194/essd-15-1287-2023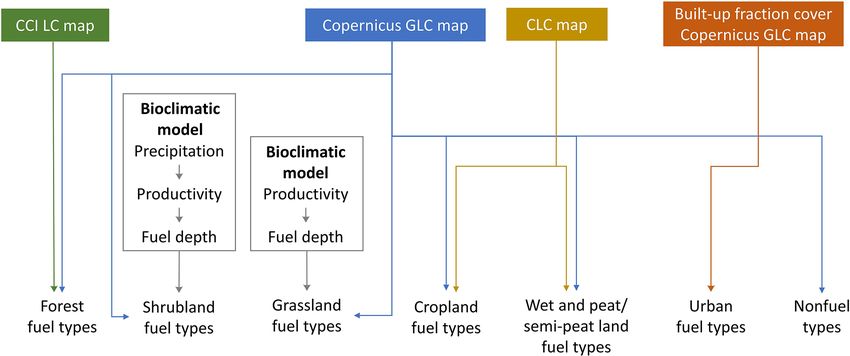
E. Aragoneses et al.: Classification and mapping of European fuels                                                            1293

Figure 3. Methodology used to generate the European fuel map. The input sources are in the text.

     model to the estimate shrubland fuel bed depth, con-                   Second, to estimate European grassland fuel bed depth,
     straining the outputs to the 0–6 m range. Last, each                   we used a linear empirical model (Eq. 3) that relates
     shrubland fuel bed depth pixel was assigned to its cor-                grassland depth and biomass for China (H. Zhang et
     responding shrubland group of the FirEUrisk fuel clas-                 al., 2018). We considered this model appropriate for Eu-
     sification system.                                                     rope because Chinese grasslands are also generally tem-
                                                                            perate, and the model was developed considering three
     Depth (m) = ((Biomass (g m−2 )/1000) − 0.708)/2.8        (2)           study areas that relate to European conditions, i.e. (1)
                                                                            80–220, (2) 600, and (3) 850–1000 mm yr−1 mean pre-
  c. Grassland fuel types. The Copernicus GLC map (Buch-                    cipitation. With this model, we estimated the grassland
     horn et al., 2020) was used to identify grassland areas.               fuel bed depth for every pixel. Finally, each pixel was
     To our knowledge, no global or European datasets on                    assigned to a FirEUrisk grassland group according to
     grassland fuel bed depth, i.e. the height of the grass-                fuel bed depth. Outliers (pixels with
1294 E. Aragoneses et al.: Classification and mapping of European fuels
f. Urban fuel types and nonfuel types. The built-up frac- 3.2.4 Validation methods
tion cover Copernicus GLC map (Buchhorn et al., 2020)
was used to extract the location of the pixels with ≥ We followed a two-step validation approach for the final
15 % and ≥ 80 % of urban cover. Pixels with ≥ 80 % European fuel map at 1 km resolution. Considering the in-
of urban cover were assigned to the urban continuous feasibility of the ground validation of the final product, we
fabric, and the rest of the identified urban pixels were first validated the six main fuel types (forest, shrubland,
assigned to the urban discontinuous fabric. grassland, cropland, wet and peat/semi-peat land, and urban)
The permanent waterbodies, open sea, snow and ice, of our classification, plus the nonfuel category, using LU-
and bare/sparse vegetation (E. Aragoneses et al.: Classification and mapping of European fuels 1295
Table 2. Combination of fuel types used to resample the 100 m resolution European fuel map to the target 1 km spatial resolution.
Original fuel map (100 m) Target fuel map (1 km)
Category A Category B Resampling category
Broadleaf forest Needleleaf forest Mixed forest
Evergreen forest Deciduous forest Mixed forest
Mixed forest Any other type of forest Mixed forest
Open forest Closed forest Open forest
Low shrubland Medium shrubland Medium shrubland
Low shrubland High shrubland Medium shrubland
Medium shrubland High shrubland High shrubland
Low grassland Medium grassland Medium grassland
Low grassland High grassland Medium grassland
Medium grassland High grassland High grassland
Herbaceous cropland Woody cropland Herbaceous cropland
Wet and peat/semi-peat land – tree Wet and peat/semi-peat land – shrubland Wet and peat/semi-peat land – shrubland
Wet and peat/semi-peat land – tree Wet and peat/semi-peat land – grassland Wet and peat/semi-peat land – grassland
Wet and peat/semi-peat land – shrubland Wet and peat/semi-peat land – grassland Wet and peat/semi-peat land – grassland
Urban continuous fabric Urban discontinuous fabric Urban discontinuous fabric
Forest Shrubland Shrubland
Forest Grassland Grassland
Shrubland Grassland Grassland
Each point was assigned to a fuel category by visual interpre- for herbaceous wetlands, whose producer accuracy increased
tation of four information sources, namely (1) the 2018 LU- and user accuracy decreased between 2015 and 2019 (Tsend-
CAS photos at a maximum distance of 200 m, (2) the latest bazar et al., 2021).
Google Earth images to observe the 1 km2 pixel, (3) Google
Street View images, and (4) the 2020 global land cover Glo-
beLand30 map (30 m resolution; Chen and Ban, 2014), with 3.3 Results
85.72 % of overall accuracy, based on Landsat and Huan- The analysis of bioclimatic conditions led to the European
jing (HJ-1) images, to help to validate forest and urban cov- Black Sea, Mediterranean, and Steppic biogeographic re-
ers. The GlobeLand30 tiles for the European territory were gions be assigned to the arid/semi-arid regime (19.83 % of
downloaded (http://www.globallandcover.com, last access: the territory in southern Europe), and the European alpine,
11 February 2022), mosaicked, and reprojected from WGS84 Arctic, Atlantic, boreal, continental, and Pannonian biogeo-
geographic latitude and longitude to ETRS89 Lambert az- graphic regions be assigned to the sub-humid/humid regime
imuthal equal area using the nearest-neighbour method. We (80.17 % of the territory in central and northern Europe;
generated binary layers for forest and urban covers and com- Fig. B1 in Appendix B).
puted the percentage of each cover within each 1 km2 pixel The application of the bioclimatic models for estimating
of the final European fuel map. Some fuel types with low the shrubland and grassland fuel bed depth in the European
representation in Europe had an insufficient number of pix- fuel map at 100 m resolution yielded the distribution of the
els with suitable LUCAS points. To analyse at least 10 pixels depth of these fuel types in Europe. Medium and high shrub-
of each fuel type, we also used LUCAS points not matching land predominate in Europe, with 2.28 % of the shrubland
all quality criteria for those fuel types. Quantitative analysis fuel types being low, 51.80 % medium, and 45.92 % high.
through a confusion matrix was performed. Although shrubland is generally considered up to 5 m, ex-
Finally, in the discussion section, the two confusion matri- ceptions are allowed, subject to the plant’s physiognomic as-
ces (one for the main fuel types and another for all mapped pect (Food and Agriculture Organization, 2000). Therefore,
fuel types) were compared to the results obtained from the here we allowed for plants higher to 5 m to be classified as
validation of the 2015 Copernicus GLC map over Europe shrubland if they have a clear physiognomic aspect of shrub.
(Tsendbazar et al., 2020). We used the 2015 map instead of The grassland fuel bed depth representation is similar for all
the 2019 one because the confusion matrix of the 2019 map groups; 35.81 % of the grassland fuel types are low, 31.94 %
was not available. This was considered reasonable, as the are medium, and 32.25 % are high, with the maximum grass-
categories’ accuracies show consistency between the 2015 land fuel bed depth being 1 m approximately (Fig. 4).
and 2019 Copernicus GLC maps and vary by less than 2 %, The application of the tested smoothing window sizes
with a stability index of1296 E. Aragoneses et al.: Classification and mapping of European fuels
Figure 4. Histograms for shrubland and grassland fuel bed depth (m) in Europe obtained from the application of the bioclimatic models.
The blue lines represent the fuel bed depth threshold used to subdivide shrubland and grassland fuel types.
groups of pixels with unimodal distributions after resam- type relates to cities, and the urban discontinuous fuel type
pling, although, in all cases, the increase was marginal (Ta- is distributed over all of Europe, referring to the outskirts of
ble B1 in Appendix B). For all window sizes, more than cities and rural areas.
99 % of the pixel groups presented a unimodal distribution, In the final European fuel map at 1 km (Table B2 in Ap-
less than 1 % presented a bimodal distribution, and only a pendix B), the fuel type dominating over Europe is crop-
few pixel groups presented a multimodal distribution of co- land (38.70 %), mostly herbaceous (36.33 %), followed by
dominant categories. These results recommended the use of the forest fuel types (32.67 %), mostly represented by the
the 5 × 5 window for the generation of the European fuel closed needleleaf evergreen forest (17.59 %). The fuel types
map at 1 km resolution, as it provided a good compromise with lower representation in Europe are urban (3.70 %) and
between the generalisation and the level of detail preserved, wet and peat/semi-peat land (4.94 %). The only fuel types
thus maintaining important fuel types for fire behaviour typ- predominating in the arid/semi-arid regime are shrubland
ically made up of small clusters of pixels, such as urban dis- (>83 %) and woody cropland (>82 %).
continuous fabric. The validation of the European fuel map at 1 km resolu-
The final European fuel map at 1 km resolu- tion yielded a high overall agreement, 88.40 %, between the
tion was generated and is publicly available at FirEUrisk European fuel map and the LUCAS points. The
https://doi.org/10.21950/YABYCN (Aragoneses et al., individual fuel type accuracy ranged from 30 % to 100 %
2022a), including 20 first-level fuel types (Fig. 5). The (Table 3). As for the second validation exercise, including
forest fuel types predominate in mountainous areas and all mapped first-level FirEUrisk fuel types, a medium to
the Scandinavian countries. The open and closed broadleaf high quantitative agreement was observed (overall accuracy
deciduous forest, the open needleleaf evergreen forest, of 81.22 %). The individual fuel type accuracy ranged from
and the mixed forest are distributed over all Europe, while 20 % to 100 % (Tables 4, B3 in Appendix B).
the closed needleleaf evergreen forest stands out in the
Scandinavian region. The shrubland fuel types dominate in
4 Fuel parameterisation
arid/semi-arid Europe. Most shrublands present a medium
and high depth. The grassland fuel types appear in cold
4.1 Development of the crosswalk to standard fuel
areas (the Alps, the Scandinavian mountains, the Pyrenees,
models
etc.) and are also important in Great Britain and Ireland
as rangelands. They are low in the arid/semi-arid region, Once the fuel classification system was developed and used
medium in northern Europe, and high in central Europe. The to map the European fuel types, we assigned each first-level
herbaceous cropland fuel type is present all over Europe, FirEUrisk fuel type to a surface fuel model. This allowed
while the woody cropland has lower importance, referring us to define surface fuel parameters at the continental scale.
to fruit trees, vineyards, and olive trees in the Mediterranean These parameters could be the input to run fire behaviour
area. The tree, shrubland and grassland, wet and peat/semi- simulations and for the estimation of fire risk conditions and
peat land fuel types occupy the Scandinavian Peninsula and fire effects. The main purpose of the crosswalk is to serve fire
northern Great Britain. Finally, the urban continuous fuel modelling activities (e.g. spread and behaviour, emissions,
Earth Syst. Sci. Data, 15, 1287–1315, 2023 https://doi.org/10.5194/essd-15-1287-2023E. Aragoneses et al.: Classification and mapping of European fuels 1297
Figure 5. FirEUrisk European fuel map at 1 km resolution. See Table 1 for the fuel type code identification.
Table 3. Confusion matrix for the FirEUrisk main fuel types.
Forest Shr. Grass. Crop. Wet. Urban Non. Total UA∗ CE∗
Forest 1313 0 2 15 0 0 0 1330 98.72 1.28
Shr. 102 71 6 9 0 0 0 188 37.77 62.23
Grass. 15 20 196 17 2 0 0 250 78.40 21.60
Crop. 80 22 266 2836 3 0 2 3209 88.38 11.62
Wet. 2 6 3 0 6 0 0 17 35.29 64.71
Urban 2 0 0 1 0 9 0 12 75.00 25.00
Non. 1 2 3 0 1 0 3 10 30.00 70.00
Total 1515 121 476 2878 12 9 5 50 016
PA∗ 86.67 58.68 41.18 98.54 50.00 100.00 60.00
Overall accuracy = 88.40 %
OE∗ 13.33 41.32 58.82 1.46 50.00 0.00 40.00
∗ UA is for user accuracy (%), PA is for producer accuracy (%), CE is for commission error (%), and OE is for omission error (%).
and post-fire activity) because it allows mapping fuel models include 40 fuel models classified into seven different groups,
and their associated parameters. according to the predominant fire-carrying surface fuel type,
The fuel types defined in this paper were matched to i.e. grass (GR), grass–shrub (GS), shrub (SH), timber under-
the Scott and Burgan (2005) Fire Behavior Fuel Models storey (TU), timber litter (TL), slash–blowdown (SB), and
(FBFMs), which is a widely used fuel model classification nonburnable (NB). Overall, the differences in fire behaviour
system in Europe (Palaiologou et al., 2013; Aragoneses and among the surface fuel groups are mainly related to fuel load
Chuvieco, 2021; Alcasena et al., 2021). The FBFMs were and its distribution among the particle size categories, sur-
based on the NFFL system (Anderson, 1982) and created face area to volume ratio, and fuel bed depth. Compared to
to address fire behaviour predictions based on Rothermel’s NFFL models, the FBFM allows having a number of fuel
(1972) surface fire spread model for the United States. They models not fully cured or applicable in high-humidity areas.
https://doi.org/10.5194/essd-15-1287-2023 Earth Syst. Sci. Data, 15, 1287–1315, 20231298 E. Aragoneses et al.: Classification and mapping of European fuels
Table 4. Accuracy summary for all mapped FirEUrisk fuel types. Table 5. Suggested attribution of the first-level FirEUrisk fuel types
See Table 1 for the fuel type code identification. to the FBFM standard fuel models in Europe.
FirEUrisk CE OE FirEUrisk CE OE FirEUrisk Crosswalk FirEUrisk Crosswalk
fuel type (%)∗ (%)∗ fuel type (%)∗ (%)∗
fuel type A∗ H∗ fuel type A∗ H∗
1121 66.67 70.00 32 40.00 80.00
1111 SH7 SH8 23 SH5 SH9
1122 14.12 2.67 33 80.00 28.57
1112 TU1 TU2 31 GR2 GR6
1211 22.22 75.86 41 7.58 0.38
1121 SH5 SH9 32 GR4 GR8
1212 23.57 4.46 42 16.67 9.09
1122 TU5 TU3 33 GR7 GR9
1301 30.00 56.25 51 80.00 50.00
1211 SH7 SH8 41 GR4 GR6
1302 42.86 71.43 52 80.00 60.00
1212 TU1 TU2 42 GR2 GR6
21 40.00 57.14 53 16.67 23.08
1221 SH5 SH9 51 SH7 SH8
22 68.18 69.57 61 44.44 0.00
1222 TU5 TL3 52 SH5 SH9
23 50.00 68.75 62 20.00 50.00
1301 SH7 SH8 53 GR7 GR9
31 35.29 79.25 7 30.00 12.50
1302 TU5 TL3 61 NB NB
Overall accuracy = 81.22 % 21 SH2 SH3 62 SH2 SH3
22 SH7 SH8 7 NB NB
∗ CE is for commission error (%), and OE is for omission error (%).
∗ A is the arid/semi-arid regime, and H is the sub-humid/humid regime.
See Table 1 for the fuel type code identification and Table C2 in
Appendix C for the FBFM descriptions and parameters.
Regarding this point, to further improve the matching pos-
sibility and account for variations in fuel types and mois-
ous areas and other nonburnable zones (e.g. water, snow, ice,
ture conditions across Europe, we distinguished arid/semi-
bare soils, and sparse vegetationE. Aragoneses et al.: Classification and mapping of European fuels 1299
Figure 6. European fuel models based on the FBFM fuel models (Scott and Burgan, 2005) at 1 km resolution. See Table C2 in Appendix C
for the fuel descriptions and parameters.
and high live load grasslands of sub-humid/humid areas and ropean territory. The map provides more detailed categories
is characterised by high moisture values, and the nonburnable than those of existing global fuel maps (Pettinari and Chu-
fuels, which refer to urban continuous areas and other non- vieco, 2016) or the 2000 EFFIS fuel map (European Forest
burnable areas including bare soil, water, and glaciers. The Fire Information System, 2017), which only referred to sur-
other FBFMs used in this work characterise approximately face fuels and did not consider forest canopy characteristics.
the remaining 29 % of the European territory and range from In addition, the FirEUrisk fuel map includes new categories
0.22 Mkm2 of TL3 to 7734 km2 of GR7. such as wet and peat/semi-peat land fuel types, which are key
A description of the parameters of the FBFM fuel mod- to understanding fire emissions, and urban fuel types, crucial
els used for the crosswalk is presented in Table C2 in Ap- to prevent fire affecting humans, which were not considered
pendix C. As an example, we mapped the 1 h dead fuel load in previous continental and global fuel maps.
and the surface fuel bed depth over Europe (Fig. 7). The hierarchical nature of the system aims to define a com-
mon fuel type classification for different scales and study ar-
eas. It also offers high versatility, as it enables mapping fu-
5 Discussion els with different disaggregation of categories, depending on
the detail and quality of the input data, while allowing us to
The proposed FirEUrisk hierarchical fuel classification sys- overlap fuel maps for the same area at different scales, which
tem was designed to be adapted to a wide range of environ- would help the integration and comparison of fuel maps be-
mental conditions, including those found in the European ter- cause of the common legend. Thus, whereas the fuel map
ritory, describing both surface and canopy fuels. In this pa- developed at the European scale was based on existing Eu-
per, we present a first product based on this classification, ropean and global datasets integrated into a GIS framework,
covering the whole European territory for the first level of the same classification scheme could be applied to provide a
the classification. We did not consider the forest understorey, more comprehensive fuel classification using a multi-sensor
the second level of the classification, which is better suited approach in a machine learning framework (García et al.,
to regional and local scales where more detailed informa- 2011; Marino et al., 2016; Domingo et al., 2020). Its struc-
tion, particularly lidar data, can be available. In any case, the ture has similarities (e.g. hierarchical scheme) with the Arc-
obtained results constitute an improvement in European fuel FUEL classification (Toukiloglou et al., 2013), although this
mapping compared to existing fuel maps covering the Eu-
https://doi.org/10.5194/essd-15-1287-2023 Earth Syst. Sci. Data, 15, 1287–1315, 20231300 E. Aragoneses et al.: Classification and mapping of European fuels
Figure 7. Surface dead 1 h fuel load and fuel bed depth over Europe obtained from the crosswalk from the FirEUrisk fuel types to the FBFM
models. Note that surface fuel bed depth for the forest fuels refers to the understorey and not the crowns.
was only prepared for southern European conditions. In ad- Regarding European fuel mapping, the combination of ex-
dition, the involvement of expert knowledge in the develop- isting land cover and biogeographic datasets and bioclimatic
ment of the FirEUrisk hierarchical fuel classification system models facilitated the generation of the fuel type dataset, with
suggests high acceptance, and therefore usage, among the some of these data being specifically developed for the Eu-
fire risk management community in the foreseeable future. ropean conditions (i.e. Europe’s biogeographic regions map,
It also allowed the development of a useful classification, in- the CLC map). Nevertheless, the input datasets are a gener-
tended to fill the actual gaps of the European fuel mapping, alisation of the complex reality, with their own uncertainties
towards a homogeneous and integrated fire risk prevention and errors, which are transferred to the final European fuel
strategy. Nevertheless, it must be considered that the group- map. In fact, the errors in the final fuel type dataset are sim-
ing of vegetation types into fuel types is a balance between ilar to or even lower than those found in the main input land
the generalisation of the landscape reality and loss of detailed cover map used to obtain the fuel categories.
information, which may not be the most suitable system for Estimating shrubland and grassland fuel bed depth was
all study areas. challenging. To the best of our knowledge, there are no large-
The predicted increase in fire intensity and the occurrence scale, reliable datasets in Europe on these variables, which is
of the so-called mega-fires (San-Miguel-Ayanz et al., 2013), limiting to our purposes. However, despite the models chosen
which usually evolve from surface to crown fires, makes it to estimate surface fuel bed depth not being specifically de-
necessary to improve our information on canopy fuels. As- veloped for European areas, the biogeographical similarity of
sessing the potential transition from surface to crown fires is the regions for which they were developed, compared to Eu-
key to prevent crown fires. For this reason, our classification ropean conditions, make them acceptable for our purposes.
approach includes both surface and canopy fuel types for the Almost all of the shrubland fuels belong to the arid/semi-arid
forest fuel types. Crown fires are highly influenced by the regime, which justifies the selection of a bioclimatic model
characteristics of understorey and ladder fuels, and by wild- developed for an arid/semi-arid area. To avoid unrealistic es-
fire intensity (e.g. flame length), which is information that is timations, we constrained the outputs to the range 0–6 m for
not available at the European scale. However, we encourage the shrublands and to >0 m for the grasslands, while no max-
others to complement the proposed fuel types with additional imum cut-off threshold was applied to the grassland category,
data for the regions where data may be available. This would as the obtained maximum value (1 m) was considered reason-
require determining the vertical continuity of fuels, in addi- able. In addition, the distribution of shrubland and grassland
tion to identifying the existence (or not) of a gap between pixels led to considering the bioclimatic models to be ade-
the understorey and the canopy fuels strata. This might be quate. The histogram for shrubland fuel bed depth showed
subject of future work. The rest of the fuel types are disag- the continuity of the input variable (precipitation). The his-
gregated based on their fuel bed depth, with the thresholds togram for the grassland fuel bed depth had an aggregated
suggested by experts. However, fuel mapping is still a chal- structure due to the input productivity data by biogeographic
lenge because of the high spatiotemporal variability in fuels region. Obviously, the direct measurement of the shrubland
and the need to generalise the great variety of vegetation con- or grassland fuel bed depth would be more desirable. In this
ditions related to fire behaviour. sense, airborne lidar should provide a better estimation, but
it is not yet available for the whole European territory, and
Earth Syst. Sci. Data, 15, 1287–1315, 2023 https://doi.org/10.5194/essd-15-1287-2023E. Aragoneses et al.: Classification and mapping of European fuels 1301
its temporal resolution may be insufficient to capture the dy- Copernicus GLC map. Croplands present higher (+7 % and
namics of these covers. 11 %) producer and user accuracies than the 2015 Coperni-
Concerning the final European fuel map (1 km spatial res- cus GLC map, mostly confused with grassland, with the pro-
olution), only 20 out of the 24 possible first-level fuel types ducer accuracy being higher than the user accuracy, as in the
were mapped because the remainder did not cover a contin- Copernicus GLC map. Wet and peat/semi-peat land omis-
uous large enough area to be represented at 1 km resolution. sion errors are 3 % lower and commission errors are 11 %
The herbaceous cropland and the closed needleleaf evergreen higher than in the 2015 Copernicus GLC map for herbaceous
forests are the most extended fuel types in Europe, which is wetland, in agreement with the observed accuracy tendencies
related to the land use activities of the European society and (Tsendbazar et al., 2021). Urban fuel types have the lowest
the natural distribution of vegetation species due to biocli- omission error (0 %) and only 25 % commission errors. The
matic conditions (García-Martín et al., 2001). Also, the large nonfuel category errors are mostly referred to pixels over the
extension of forest fuel types constitutes an increasing poten- coastline caused by the different spatial resolutions of the Eu-
tial risk in light of the growing trends of land abandonment, ropean fuel map and the LUCAS points. This also happens to
particularly in remote areas; forests with a high surface fuel the rest of the fuel types and is considered to be the main lim-
load can more easily turn into crown fires (Scott and Rein- itation of the validation method. Some validation errors are
hardt, 2001; Weise and Wright, 2014), characterised by high also caused by the different dates of the input sources and the
intensity, and emit vast amounts of the stored carbon. Urban validation data.
fuel types are the least represented in Europe, but they are The quantitative assessment of all mapped FirEUrisk fuel
the most dangerous from an economic, societal, and human types obtained a medium–high overall accuracy of 81.22 %,
health point of view (Bowman et al., 2011). Mapping urban with average commission errors of 40 % (highest for the high
fuel types represents an advance of the proposed classifica- grasslands and tree and shrubland wet and peat/semi-peat
tion system, as it allows the assessment of residential and land fuel types and lowest for the herbaceous cropland fuel
non-natural fuels, which can, in turn, help in the identifica- type) and average omission errors of 43 % (highest for the
tion of anthropic areas where fires can affect human settle- medium grassland fuel type and lowest for the urban contin-
ments and lives. uous fabric fuel type). These results are higher than those of
Finally, the quantitative assessment of the European fuel the Copernicus GLC map (Tsendbazar et al., 2020), but nei-
map obtained a high overall accuracy of 88.40 %, with av- ther surpass the ideal 85 % minimum overall accuracy, nor
erage commission errors of 37 % (highest for the nonfuel do all fuel types have ≥ 70 % accuracy (Thomlinson et al.,
category and lowest for the forest fuel types) and average 1999). However, the visual assessment improved the valida-
omission errors of 29 % (highest for the grassland and lowest tion method because it considered the entire 1 km2 pixels and
for the urban fuel types). Although the obtained accuracy is not only the area of the LUCAS points. This method could
higher than the one for our main information source, which only be applied to a subset of the validation points because of
was the Copernicus GLC map (Tsendbazar et al., 2020), and its temporal and human cost compared to the previous valida-
it surpassed the ideal 85 % minimum overall accuracy, not all tion method. The results are similar to the confusion matrices
fuel types presented the ideal ≥ 70 % accuracy (Thomlinson of the FirEUrisk main fuel types and the Copernicus GLC
et al., 1999). The overall accuracy was higher than the one for map over Europe (Tsendbazar et al., 2020), although errors
the 2019 Copernicus GLC map over Europe (79.9 %), prob- are higher and different due to the dissimilar validation meth-
ably due to the validation approach. The confusion matrix is ods and reference data, and confusion appears between fuel
aligned with the confusion matrix of the 2015 global Coper- types belonging to the same main fuel type. Most errors are
nicus GLC maps over Europe (Tsendbazar et al., 2020), due to pixels with a mixed cover of fuel types and low qual-
when considering most similar categories. The errors in the ity of the reference data (unclear and blurred Google images
Copernicus GLC map have been transferred to the European and LUCAS photos and pixels not meeting all ideal condi-
fuel map, as it was our main information source. tions for validation – that was needed to have a representative
With similar accuracies to the 2015 Copernicus GLC map sampling for every fuel type). Input and reference data tem-
over Europe, forest fuel types present low omission and com- poral differences may also have affected the accuracy. The
mission errors, although there is some confusion with shrub- obtained errors present the typical pattern for land cover and
land, grassland, and cropland. The shrubland omission and vegetation classifications with remote sensing (used to de-
commission errors (mostly confused by the Mediterranean velop the input data), dependent on the separability of the
sclerophyllous and xerophilic forest) are significant; how- spectral signatures of the land types. This explains why er-
ever, our validation approach obtained 31 % and 2 % less, rors are dominant for fuel types belonging to the same main
respectively, compared to the 2015 Copernicus GLC map. fuel type instead of fuel types from different main fuel types.
The grassland omission errors (mostly confused by herba- Forest fuel types have acceptable accuracy, except for the
ceous cropland) are 15 % higher than the ones for herbaceous closed mixed forest, which is highly confused with closed
vegetation in the 2015 Copernicus GLC map. In addition, needleleaf evergreen forest. Many errors refer to the omis-
grassland commission errors are 17 % lower than in the 2015 sion of open forest, assigned to the closed forest, as in
https://doi.org/10.5194/essd-15-1287-2023 Earth Syst. Sci. Data, 15, 1287–1315, 20231302 E. Aragoneses et al.: Classification and mapping of European fuels the Copernicus GLC map over Europe (Tsendbazar et al., tinental United States (see, for instance, https://www.wfas. 2020). Shrubland and grassland fuel type errors are signif- net/index.php/nfdrs-fuel-model-static-maps-44, last access: icant, mostly between fuel bed depth categories. Therefore, 7 March 2023). Work is in progress to develop higher- care must be taken with these results, as estimating fuel bed resolution products over Europe that combine a set of remote depth from photos is challenging, and fuel bed depth varies sensing tools and data. This latter development at the Euro- with time. These limitations especially affect grassland due pean scale is highly complicated by the huge heterogeneity to its low depth and rapid growth and the fact that high grass- in the availability of high-quality and high-resolution ground land is frequently cut. Thus, grassland fuel bed depth is very and measured data, which vary a lot among and within the changeable, so we assume the European fuel map may only different regions. be accurate for some periods of the year. We validated the The FirEUrisk fuel classification system can provide a proposed fuel map considering the mean potential fuel bed number of insights and information for wildfire risk moni- depth. Moreover, short grassland is generally confused with toring and assessment at the European scale, including fuel the herbaceous cropland of fodder crops of agriculturally im- parameters, such as dead and live surface fuel load, the sur- proved grasslands and temporary pasture such as legumes. face to area volume ratio, or surface fuel bed depth. This Cropland fuel types are the most accurate, with no signif- is mostly related to the identified fuel categories crosswalk icant errors. Wet and peat/semi-peat land fuel types have to the FBFM system (Scott and Burgan, 2005), which is moderate accuracy. The most important confusions are be- specifically designed for the above purpose. In fact, the pa- tween the tree wet and peat/semi-peat land with other wet rameters included in each FBFM model allow the char- and peat/semi-peat land fuel types and between the shrubland acterisation of surface fuels and can serve as a baseline wet and peat/semi-peat land with shrubland. The urban con- for surface wildfire spread and behaviour modelling. The tinuous fuel type has no omission errors, while some com- full surface fuel set information needed to run fire propa- mission errors are in favour of the urban discontinuous fuel gation models can be extracted from the crosswalk to the type in the outskirts of the residential areas of cities. The ur- FBFM and complemented with other canopy fuel parame- ban discontinuous fuel type presents a higher omission than ters (such as crown base height or crown bulk density) and commission errors, which is mostly omitted by cropland in other necessary input data (e.g. weather conditions, topogra- agricultural rural areas. Similar to the confusion matrix for phy, and ignitions) to run fire spread models (e.g. FlamMap, the main fuel types, both commission and omission errors Finney, 2006; FARSITE, Finney, 2004), as embedded in for the nonfuel category are low and relate to mixed pixels. FlamMap 6.2 (https://www.firelab.org/project/flammap, last The different levels of disaggregation of the proposed clas- access: 7 March 2023). This should be the subject of an ex- sification system, and the main fire behaviour characteris- tension of this paper and could be based on the calibration of tics of the diverse fuels, made the crosswalk challenging models that estimate canopy fuel parameters using airborne and did not allow us to assign a specific standard model to and satellite lidar systems for which regional airborne lidar each FirEUrisk fuel type. Moreover, the FBFM standard fuel would be key to consider the heterogeneity of European fuels models (Scott and Burgan, 2005) were originally developed before using the global satellite lidar data for the continental for the United States, so care must be taken when using the scale. crosswalk in Europe (Santoni et al., 2011; Salis et al., 2016). The fuel map is also expected to provide estimations of From this point of view, our proposed approach can be im- fire-caused carbon emissions and pollution and estimations proved in specific areas if customised information and data of biomass consumption. The Consume model (Prichard et on given fuel types are available (Arca et al., 2007; Fernan- al., 2006) could be used for this if a crosswalk to FCCS des, 2009; Duguy Pedra et al., 2015; Kucuk et al., 2015; As- fuels is previously made, including the necessary fuel pa- coli et al., 2020). In other words, we propose a generic cross- rameters such as the combustion percentage. In addition, the walk scheme, but users are free to wisely choose or modify FirEUrisk fuel map would be useful for regions that do not the best-fitting standard fuel models according to their study have fuel cartography. The mapped fuel types and the fuel area and expertise or to use different parameters from the parameters obtained from the crosswalk to FBFM can serve standard ones if they have better information for given study as input for fire propagation models and help rate fire dan- areas. Moreover, the main limitation of the crosswalk scheme ger and risk conditions. It is also important to note that the relies on the reference to general bioclimatic regimes, which maps of fuel parameters at the European scale are examples is not able to fully consider all inherent differences among of what can be done, but the crosswalk is intended to be use- European regions in terms of fuel characteristics, while mois- ful for areas where technologies and resources such as lidar ture values can be spatially modified according to the specific data are not available. status of each fuel type. Overall, we highlight that the main use of the map is pro- This work represents one of the first attempts to adopt viding a dataset able to rate fire danger and risk conditions a standardised fuel model mapping approach over Europe, across large geographic areas, while the application of wild- similar to the National Fire Danger Rating fuel model prod- fire spread models to very local scales or small areas may ucts that have been available since the 1990s for the con- Earth Syst. Sci. Data, 15, 1287–1315, 2023 https://doi.org/10.5194/essd-15-1287-2023
You can also read