A global database of marine isotope substage 5a and 5c marine terraces and paleoshoreline indicators - ESSD
←
→
Page content transcription
If your browser does not render page correctly, please read the page content below

Earth Syst. Sci. Data, 13, 3467–3490, 2021
https://doi.org/10.5194/essd-13-3467-2021
© Author(s) 2021. This work is distributed under
the Creative Commons Attribution 4.0 License.

        A global database of marine isotope substage 5a and 5c
             marine terraces and paleoshoreline indicators
                                       Schmitty B. Thompson and Jessica R. Creveling
          College of Earth, Ocean, and Atmospheric Sciences, Oregon State University, Corvallis, 97331 OR, USA
                           Correspondence: Schmitty B. Thompson (thomschm@oregonstate.edu)

                                   Received: 15 January 2021 – Discussion started: 1 February 2021
                               Revised: 7 June 2021 – Accepted: 10 June 2021 – Published: 16 July 2021

       Abstract. In this review we compile and document the elevation, indicative meaning, and chronology of marine
       isotope substage 5a and 5c sea level indicators for 39 sites within three geographic regions: the North American
       Pacific coast, the North American Atlantic coast and the Caribbean, and the remaining globe. These relative sea
       level indicators, comprised of geomorphic indicators such as marine and coral reef terraces, eolianites, and sedi-
       mentary marine- and terrestrial-limiting facies, facilitate future investigation into marine isotope substage 5a and
       5c interstadial paleo-sea level reconstruction, glacial isostatic adjustment, and Quaternary tectonic deformation.
       The open-access database, presented in the format of the World Atlas of Last Interglacial Shorelines (WALIS)
       database, can be found at https://doi.org/10.5281/zenodo.5021306 (Thompson and Creveling, 2021).

1   Introduction                                                     tological indicators for the purpose of measuring the local
                                                                     peak sea level achieved during these ice-volume minima
Two orbitally modulated peaks in Northern Hemisphere                 (Griggs, 1945; Alexander, 1953; Bretz, 1960; Land et al.,
summer insolation, occurring ∼ 100 and ∼ 80 ka, brought              1967; Mesolella, 1967; Chappell, 1974; Chappell and Veeh,
warmer temperatures and reduced ice volumes that briefly             1978; Cronin et al., 1981). Here we adopt the standardized
interrupted earth’s transition from the last interglacial into       framework provided by the World Atlas of Last Interglacial
the last glacial maximum (Hays et al., 1976; Chappell and            Shorelines (WALIS) database (WALIS, https://warmcoasts.
Shackleton, 1986; Lambeck and Chappell, 2001; Cutler                 eu/world-atlas.html, last access: 23 June 2021) to compile
et al., 2003). These interstadials induced δ 18 Obenthic excur-      the English-language publications of globally outcropping
sions, designated as marine isotope stages (MISs) 5c and 5a,         relative sea level (RSL) indicators ascribed by the primary
coincident with highstands in sea level inferred from uplifted       authors as MIS 5a and 5c in age. The open-access database,
reefs and shore platforms and additional sedimentological in-        which includes site descriptions, elevation and geochrono-
dicators (Mesolella et al., 1969; Railsback et al., 2015). In-       logical constraints, and associated metadata, is available at
quiry into MIS 5a and 5c sea level highstands enriches our           this link: https://doi.org/10.5281/zenodo.5021306 (Thomp-
understanding of last interglaciation (sensu lato) paleocli-         son and Creveling, 2021). Database field descriptors can be
mate (e.g., Potter et al., 2004) and tectonic deformation (e.g.,     queried at this link: https://doi.org/10.5281/zenodo.3961543
Simms et al., 2016), and faunal assemblages preserved on             (Rovere et al., 2020). This database builds on foundational
and within marine terraces reveal ocean paleo-temperature            regional syntheses of MIS 5a and 5c sea level indicators for
and paleo-circulation pathways (Muhs et al., 2012), all of           the Atlantic coast of North America and the Caribbean (Pot-
which complement insight gained from the preceding MIS               ter and Lambeck, 2004), Pacific coast of the United States
5e substage (Kopp et al., 2009; Dutton and Lambeck, 2012;            and Baja California in Mexico (Muhs et al., 2012; Simms
Dutton et al., 2015).                                                et al., 2016), and a subset of far-field localities (Creveling
   A rich literature catalogues the legacy of mapping glob-          et al., 2017) in compiling a global dataset of 39 sites (Fig. 1).
ally distributed MIS 5a and 5c reef tracts, shore plat-              The database includes sites excluded from previous reviews.
forms, and other marine- and terrestrial-limiting sedimen-

Published by Copernicus Publications.
3468                                                      S. B. Thompson and J. R. Creveling: MIS 5a and 5c indicator database

Figure 1. Locations of MIS 5a (a–c) and MIS 5c (d, e) RSL indicator sites for (a, d) the Pacific coast of North America, (b, e) Atlantic coast
of North America and the Caribbean, and (c, f) the remaining globe atop the Matplotlib Basemap Shaded Relief map (Hunter, 2007).

   The following sections include a summary of the types                 construction of peak global mean sea level and assessments
of geomorphic and sedimentological sea level indicators in-              of the sensitivity of Quaternary ice sheets to the influence of
cluded in this review (Sect. 2); details on how elevation mea-           Milankovitch forcing on climate over sub-100 kyr timescales
surements, measurement uncertainty, and sea level data are               (Lambeck and Chappell, 2001; Potter and Lambeck, 2004;
reported (Sect. 3); and an overview of the dating methods                Potter et al., 2004; Muhs et al., 2012; Simms et al., 2016;
utilized in the primary publications (Sect. 4). The majority             Creveling et al., 2017). We emphasize that this database re-
of this publication (Sect. 5) reports the current measured ele-          ports measurements of uncorrected, present-day elevation of
vations and chronologies, along with the history of the liter-           various relative sea level indicators that will enable the user
ature, for individual sites. Section 6 addresses the data avail-         to apply corrections based on the most current data- and
ability. Section 7 summarizes future research directions.                model-based predictions.
   The present elevation of MIS 5a and 5c sea level indica-
tors reflects a number of convolved processes, including, but            2   Sea level indicators
not limited to, tectonic deformation and glacial isostatic ad-
justment (GIA), which require carefully applied corrections              The data detailed in this review (and the associated database)
to reconstruct peak global mean sea level (GMSL). Tectonic               comprise a set of geomorphic and sedimentological indica-
deformation can alter the elevation of an indicator by tens to           tors of past sea level, for which a comprehensive overview
hundreds of meters (Alexander, 1953; Chappell, 1974) and                 can be found in Rovere et al. (2016). Marine platforms make
glacial isostatic adjustment by similar magnitudes (Crevel-              up the largest portion of these data, particularly for the North
ing et al., 2015; Simms et al., 2016). For active margins, this          American Pacific coast (see Muhs et al., 1992b, for a detailed
convolution serves as an opportunity to constrain rates of               description of this indicator). Constructional coral reef ter-
Quaternary tectonic deformation (Adams, 1984; Marquardt                  races are prevalent across the North American Atlantic coast,
et al., 2004; Muhs et al., 2014) given robust assumptions of             the Caribbean, and the far-field regions (see Chappell, 1974,
the magnitude and source of MIS 5e ice-volume melt and                   for an example of this indicator). Additional sedimentary fea-
glacial isostatic adjustment (Broecker et al., 1968; Dodge               tures, such as eolianites, submerged beach ridges, and expo-
et al., 1983; Chappell and Shackleton, 1986; Creveling et al.,           sure surfaces, make up the remainder of the local inferences.
2015; Simms et al., 2016). Similarly after correction for tec-
tonic uplift, discrepancies in the local elevation of globally
distributed MIS 5a and 5c indicators of peak sea level re-
tain a meaningful signal of glacial isostatic adjustment (Pot-
ter and Lambeck, 2004), which, in turn, allows for the re-

Earth Syst. Sci. Data, 13, 3467–3490, 2021                                                 https://doi.org/10.5194/essd-13-3467-2021

S. B. Thompson and J. R. Creveling: MIS 5a and 5c indicator database                                                       3469

3   Elevation measurements                                         numeric chronologies through luminescence dating (Duller,
                                                                   2004; Grove et al., 2010). Amino acid racemization (AAR)
Here we catalogue the elevation, with uncertainty (if listed),     creates relative chronologies, especially in conjunction with
of a given indicator as reported in the primary publica-           other amino acid ratios from sea level indicators bench-
tion(s) without modification. Methods adopted to measure           marked by radiometric ages (Mitterer, 1974; Miller et al.,
the present-day elevation range of reported indicators vary        1979; Kennedy et al., 1982). Stratigraphic relationships be-
from hand level and altimeter surveys to mapping with mod-         tween adjacent sea level indicators have been extensively
ern differential GPS and digital elevation models. The ma-         used to develop relative chronologies for sea level indica-
jority of publications summarized herein did not report the        tors, especially for sites with marine terrace sequences con-
sea level datum that the elevation references, and, thus, these    sisting of adjacent MIS 5e, 5c, and 5a terraces (Adams, 1984;
methods are reported in the WALIS database as “Not Re-             Merritts and Bull, 1989; McInnely and Kelsey, 1990). Other
ported”. For those sites for which primarily field workers         sparingly used dating methods for MIS 5a and 5c indica-
did not report elevation uncertainty, we noted this absence in     tors include electron spin resonance (ESR) (Mirecki et al.,
the database and assigned a measurement uncertainty based          1995), terrestrial cosmogenic nuclide dating (Perg et al.,
upon the defined accuracy of the elevation measurement             2001), protactinium-231 dating, (Edwards et al.,1997), pale-
method. When available in the original publication, latitude       omagnetic stratigraphy (see sources discussed in Choi et al.,
and longitude coordinates for indicator sites are reproduced       2008), soil development stages (Kelsey et al., 1996), radio-
for the WALIS database; when unavailable, coordinates were         carbon dating (Hanson et al., 1992), and geomorphic models
interpreted from publication maps using Google Earth and           (Hanks et al., 1984; Valensise and Ward, 1991).
noted accordingly.                                                    For each site we rated the quality of the RSL chronol-
   For each site we rated the quality of the RSL elevation         ogy following criteria established by the World Atlas of
data following criteria established by the World Atlas of Last     Last Interglacial Shorelines project documentation (see Rel-
Interglacial Shorelines project documentation (see Relative        ative Sea Level at https://doi.org/10.5281/zenodo.3961544).
Sea Level at https://doi.org/10.5281/zenodo.3961544). Qual-        Quality assessment of indicator age reflects how well the
ity assessments for RSL elevation reflect a combination of         geochronology translates to a stage vs. substage assignment.
measurement precision, the specificity of the reference da-        An excellent rating (5) attributes an RSL indicator to a nar-
tum for the elevation, and the range of and uncertainty in the     row window within a substage of MIS 5, whereas a good
indicative meaning (sensu Rovere et al., 2016). When these         rating (4) more generally assigns an RSL indicator to a sub-
three variables constrain total RSL uncertainty to < 1 or 1–       stage. If geochronology only assigns an indicator to a generic
2 m, then WALIS defines the RSL elevation quality as ex-           interglacial (such as MIS 5), then this warrants an average
cellent (5) or good (4), respectively. If, however, uncertain-     rating (3). A poor rating (2) applies to incomplete chrono-
ties in these three variables lead to an RSL elevation of 2–3      logic data or data that provide only a minimum or maximum
or > 3 m, then a rating of average (3) or poor (2) applies,        age on the RSL indicator. Conflicting age assignments be-
respectively. For sites without a specified reference datum        tween marine isotope stages warrant a very poor quality rat-
(e.g., 3 m below sea level rather than 3 m below mean high         ing (1). Finally, chronologic data unable to distinguish be-
tide), we limited the maximum quality rating to 3 and as-          tween two or more Pleistocene epoch interglacials warrant a
signed a rating based on the remaining factors. Any RSL in-        rejected quality rating (0).
dicator of poorer quality than described above receives a very
poor quality rating (1). Any terrestrial- or marine-limiting in-
dicator that serves only as an upper or lower bound on RSL         5     A global database of marine isotope substage 5a
receives a rating of rejected (0). Not all primary references            and 5c relative sea level indicators
report the indicative meaning of an RSL indicator, and thus
                                                                   5.1    North American Pacific coast
for a subset of sites we calculated the indicative meaning
with the IMCalc software (Lorscheid and Rovere, 2019) in           Field observers first documented emergent marine terraces
order to assign an elevation quality rating.                       on the North American Pacific coast in the early 20th century.
                                                                   Early mapping efforts documented terraces along much of
4   Dating techniques                                              the California coastline (Ellis, 1919; Davis, 1932; Woodring
                                                                   et al., 1946). Alexander (1953) pioneered the interpretation
Age assignments for MIS 5a and 5c sea level indicators             of west coast marine terraces as indicators of paleo-sea level
arise from a wide variety of radiometric and non-traditional       and tectonic uplift. Since then, extensive documentation of
geochronologic methods. Numeric chronologies for indica-           regional MIS 5a and 5c paleo-sea level indicators has yielded
tors composed of in situ carbonate utilize uranium-series dat-     18 sites, which are included in the present review. As noted
ing (Barnes et al., 1956; Broecker and Thurber, 1965; Os-          below, many such studies reported geomorphic or chronolog-
mond et al., 1965; Thurber et al., 1965; Muhs et al., 2002;        ical data that apply to multiple adjacent sites. Griggs (1945)
2012). Sediment-mantling sea level indicators can also yield       completed early work on the Oregon coast, documenting four

https://doi.org/10.5194/essd-13-3467-2021                                         Earth Syst. Sci. Data, 13, 3467–3490, 2021
3470                                                 S. B. Thompson and J. R. Creveling: MIS 5a and 5c indicator database

terraces, of which we focus on the Whisky Run and Pio-            the sediment packages overlying both terraces and revised
neer terraces. McInelly and Kelsey (1990) provided further        the mapped faults that displace each terrace.
geomorphic cross-sections for the Whisky Run and Pioneer
terraces at the Cape Arago and Coquille point sites. Early        5.1.3   Coquille Point, Oregon
chronologies for many west coast sites come from Kennedy
et al. (1982), who provided leucine D : L ratios for individual   This entry focuses on the Pioneer and Whisky Run terraces
sites plotted against isochrons independently constrained by      documented in Griggs (1945). Attribution of the Whisky Run
uranium-series ages. These sites were summarized by Simms         terrace to the MIS 5a substage first appeared in Kennedy
et al. (2016), who compared tectonically corrected RSL sites      et al. (1982) based on leucine D : L ratios on Saxidomus and
to models of Pacific coast glacial isostatic adjustment.          a single uranium-series age on a coral (Fig. 4). Subsequently,
                                                                  6 uranium-series ages on corals and bryozoans, 10 amino
5.1.1   Newport, Oregon
                                                                  acid ratios on bivalve mollusks Mya truncata and Saxido-
                                                                  mus giganteus, and oxygen isotope stratigraphy on mollusk
Kelsey et al. (1996) utilized topographic maps and altimeter      shells supported the MIS 5a age assignment for the Whisky
surveys to map and document the platform elevation ranges         Run terrace (Kennedy et al., 1982; Muhs et al., 1990, 2006;
of six emergent bedrock terraces which crop out discon-           Fig. 4). McInelly and Kelsey (1990) revisited the region
tinuously through the region due to faulting; we focus on         and presented a representative geomorphic cross-section that
the lowest two of the surveyed platforms, the Newport and         documented deformation of the Whisky Run terrace by the
Wakonda terraces. Kennedy et al. (1982) first dated the New-      Pioneer anticline. This survey reported a Whisky Run terrace
port terrace using AAR. The leucine D : L ratio was plotted       maximum elevation of 18 m a.p.s.l. (Fig. 2), a small upward
against isochrons of other AAR ages from proximal loca-           revision from the 17 m a.p.s.l. reported by Muhs et al. (1990).
tions, assigning the Newport terrace to MIS 5a. Kelsey et al.     No elevation for the Pioneer terrace was reported in the text
(1996) assigned terraces to MISs based on soil development        of this article, though Simms et al. (2016) extracted an ele-
stages. Namely, this study assigned the Newport terrace (0–       vation of 70 m a.p.s.l. from the cross-section of McInelly and
45 m a.p.s.l., above present-day sea level), which is extensive   Kelsey (1990). Based on their similar elevations, McInelly
north of Yaquina Bay and discontinuous between Cape Foul-         and Kelsey (1990) correlated the Pioneer terrace at Coquille
weather and Siletz Bay, to MIS 5a; the Wakonda terrace (0–        Point with the MIS 5c Pioneer terrace at Cape Blanco, it-
85 m a.p.s.l.) – which is discontinuous from Newport north        self dated through amino acid ratios and faunal assemblages
to Otter Rock and then crops out just above modern beach          (Muhs et al., 1990; Fig. 5).
elevation between Yaquina and Alsea bays before gradually
descending below sea level south of Alsea Bay – was as-           5.1.4   Brookings, Oregon
signed to MIS 5c. Based on these age assignments, Kelsey
et al. (1996) correlated the Newport and Wakonda terraces to      Kelsey and Bockheim (1994) utilized topographic maps to
the Whisky Run and Pioneer terraces (see Sect. 5.1.2 Cape         document seven shore platforms; the lowest two terraces,
Arago). Figures 2 and 3 include the terrace elevations re-        Harris Butte and Brookings, crop out at bedrock platform el-
ported by Kelsey et al. (1996), and Figs. 4 and 5 illustrate      evations of 30–62 and 57–90 m a.p.s.l. (see Figs. 2 and 3),
the MIS assignments for the Newport and Wakonda terraces,         respectively, south of the Whaleshead fault zone. No radio-
respectively (Kennedy et al., 1982; Kelsey et al., 1996).         metric ages constrain the age of the Harris Butte and Brook-
                                                                  ings terraces. These terraces were assigned to MIS 5a and 5c,
5.1.2   Cape Arago, Oregon
                                                                  respectively, based upon similar soil development stages to
                                                                  the Whisky Run and Pioneer terraces at Cape Arago (Figs. 4
Griggs (1945) mapped four emergent shore platforms along          and 5).
the central Oregon coastline, of which we focus on the low-
est two, the Pioneer and Whisky Run terraces. Adams (1984)        5.1.5   Bruhel Point, California
documented landward tilting of the Pioneer and Whisky Run
terraces and the faults that vertically displace them. No ra-     Merritts and Bull (1989) surveyed the 14 marine ter-
diometric ages directly constrain the Pioneer and Whisky          races cropping out at Bruhel Point, of which the 10 and
Run terrace chronology at Cape Arago; instead, these ter-         23 m a.p.s.l. terraces (surveyed from the inner edge of the
races are assigned to MIS 5a and MIS 5c based on correlation      terrace) have been assigned to the MIS 5a and 5c highstands
to terraces cropping out at Coquille Point (see Sect. 5.1.3 and   (Figs. 2 and 3). A leucine D : L ratio on the 10 m a.p.s.l. ter-
Figs. 4 and 5). McInelly and Kelsey (1990) published altime-      race indicates either an MIS 5a or 5c substage designation
ter surveys that revised the peak shoreline angle elevations      (Kennedy et al., 1982). In contrast, Merritts and Bull (1989)
of the Whisky Run and Pioneer terraces reported by Adams          supported age assignments of MIS 5a and 5c for the 10 and
(1984) to 31 and 68 m a.p.s.l., respectively (Figs. 2 and 3).     23 m a.p.s.l. terraces, respectively (see Figs. 4 and 5), based
McInelly and Kelsey (1990) also reported the thickness of         upon correlations made using diagrams of inferred uplift of

Earth Syst. Sci. Data, 13, 3467–3490, 2021                                        https://doi.org/10.5194/essd-13-3467-2021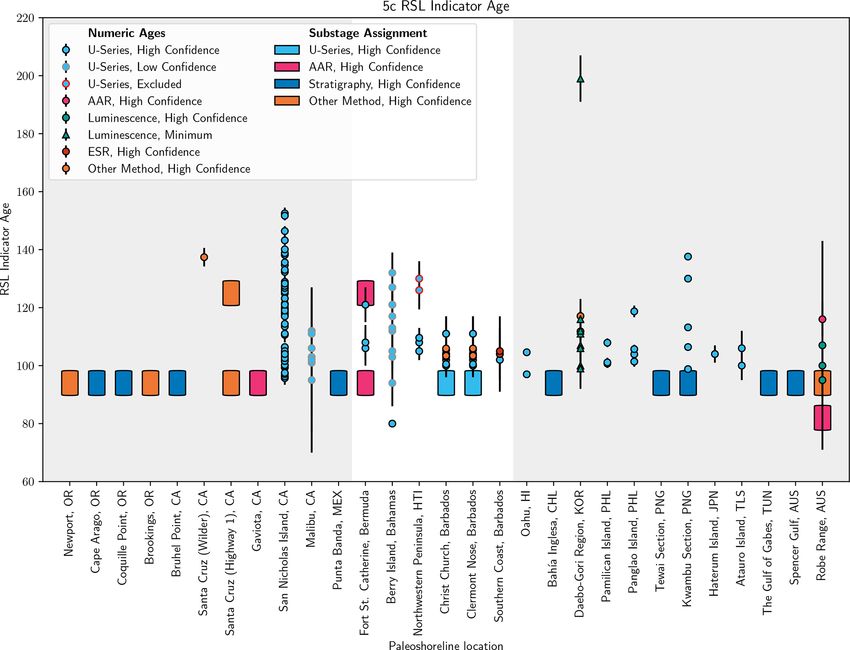
S. B. Thompson and J. R. Creveling: MIS 5a and 5c indicator database                                                                    3471

Figure 2. The present elevation of MIS 5a RSL indicators, in meters, at the field locations listed on the horizontal axis. Teal bars represent
the full elevation range reported in the primary publications along with the corresponding measurement error, if any, in black bars. Note the
scale break on the vertical axis necessary to present indicator elevations for sites with rapid tectonic uplift.

Figure 3. The present elevation of MIS 5c RSL indicators, in meters, at the field locations listed on the horizontal axis. Teal bars represent
the full elevation range reported in the primary publications along with the corresponding measurement error, if any, in black bars. Note the
scale break on the vertical axis necessary to present indicator elevations for sites with rapid tectonic uplift.

the Bruhel Point terraces vs. inferred ages (uplift-rate dia-            5.1.6    Point Reyes, California
grams) to the New Guinea sea level curve (see Sect. 5.3.6
Tewai and Kwambu).                                                       Grove et al. (2010) utilized differential GPS to map nine ma-
                                                                         rine terraces across five transects for which the inner edge
                                                                         of the lowest terrace, of purported MIS 5a age, was sur-
                                                                         veyed between 38–77 m a.p.s.l. (Fig. 2). Five sediment sam-
                                                                         ples overlying the lowest terrace yielded three ages per sam-
                                                                         ple from three energy stimuli: optically stimulated blue-light

https://doi.org/10.5194/essd-13-3467-2021                                                 Earth Syst. Sci. Data, 13, 3467–3490, 2021
3472 S. B. Thompson and J. R. Creveling: MIS 5a and 5c indicator database
Figure 4. Age assignments for MIS 5a RSL indicators cropping out at the locations listed on the horizontal axis. For each location, the
geochronological method is indicated by color; numeric, minimum, and maximum age type by shape; and the confidence of the age by
border color. Symbols represent numerical ages, whereas, in the absence of a numeric chronology, bars represent general marine isotope
substage assignments (MIS 5c 98–90 ka, MIS 5a 86–72 ka).
luminescence (OSL), optically stimulated infrared lumines- 5.1.7 Santa Cruz, California
cence (IRSL), and thermoluminescence (TL). Grove et al.
(2010) discounted the OSL ages as being too young (MIS 2– Alexander (1953) first mapped the emergent marine terraces
3), whereas these authors interpreted TL ages as maximum cropping out in the Santa Cruz, CA, region, for which we fo-
ages; the IRSL ages were identified as the most accurate es- cus on (often conflicting) interpretations for the age of the lat-
timates of the time of deposition. The sample identified as erally extensive, sediment-mantled terrace formerly named
the best indicator of terrace age (PR-2) assigns the lowest the Santa Cruz terrace as well as the two higher-elevation
terrace to MIS 5a; the other four samples yield ages rang- Western and Wilder terraces later documented by Bradley
ing from MIS 3 to MIS 5a or show internal inconsistencies and Griggs (1976). Bradley and Addicott (1968) presented
(Fig. 4). four uranium-series ages on mollusks that assigned an age
to the Santa Cruz terrace – referred to as the “first” terrace
Earth Syst. Sci. Data, 13, 3467–3490, 2021 https://doi.org/10.5194/essd-13-3467-2021S. B. Thompson and J. R. Creveling: MIS 5a and 5c indicator database 3473 Figure 5. Age assignments for MIS 5c RSL indicators cropping out at the locations listed on the horizontal axis. See Fig. 4 caption for a description of symbols. in their nomenclature – consistent with either MIS 5a or 5c. et al. (2006) contested these cosmogenic ages, arguing that Bradley and Griggs (1976) utilized seismic surveys to sub- they date the deposition of alluvium overlying the terraces divide the Santa Cruz terrace into three constituent terraces, and therefore provide a minimum age for terrace formation. which, in ascending order of elevation, include the Daven- We report Davenport and Highway 1 as well as Western and port, Highway 1, and Greyhound terraces. A rich literature Wilder terrace elevations and chronologies as separate en- discusses the chronostratigraphic assignment of the Daven- tries in the database (see Figs. 2–5) to most accurately repre- port and Highway 1 terraces. Most authors have concluded, sent the existing body of literature. For each terrace all of the on the basis of amino acid ratios, diffusion modeling of reported numeric ages and age assignments are represented, paleo-sea cliffs, and 15 U-series ages on corals, that the Dav- even when conflicting. enport terrace, which crops out at 5–10 m a.p.s.l. (see Muhs et al., 2006), formed during MIS 5a (Kennedy et al., 1982; Hanks et al., 1984; Muhs et al., 2006). The Highway 1 ter- 5.1.8 San Simeon, California race, at an inner-edge elevation of 26–39 m a.p.s.l. (Bradley Hanson et al. (1992) mapped five shore platforms along the and Griggs, 1976), has been alternately assigned to MIS San Simeon fault zone. North and south of the fault zone 5c using models of the diffusion of paleo-sea cliffs (Hanks the San Simeon terrace shoreline angle crops out discontinu- et al., 1984) or to MIS 5e based upon a geologic fault mod- ously between 5–7 and 9–24 m a.p.s.l., respectively (Fig. 2). eling (Valensise and Ward, 1991). In contrast to the above While a uranium-series age on bone and a radiocarbon age chronology, Perg et al. (2001) presented 10 cosmogenic nu- on detrital charcoal provide a minimum terrace age of MIS 3 clide ages that assigned the Santa Cruz (undifferentiated), (Hanson et al., 1992), two thermoluminescence ages on sedi- Western (87 m a.p.s.l.; Fig. 2), and Wilder (132 m a.p.s.l.; ment underlying the emergent platform place the San Simeon Fig. 3) terraces to MIS 3, 5a, and 5c, respectively. Muhs terrace within the range of MIS 5a to 5c (Berger and Hanson, https://doi.org/10.5194/essd-13-3467-2021 Earth Syst. Sci. Data, 13, 3467–3490, 2021
3474                                                  S. B. Thompson and J. R. Creveling: MIS 5a and 5c indicator database

1992). Of these possibilities, Simms et al. (2016) elected for     terrace to MIS 5a (Fig. 4). The lowest San Miguel terrace
the MIS 5a San Simeon terrace age assignment (Fig. 4).             is overlain by a veneer of fossiliferous cemented gravel and
                                                                   marine sand, which itself is overlain in areas by alluvium
5.1.9    Point Buchon, California
                                                                   (Johnson, 1969; Muhs et al., 2014). Based on stratigraphic
                                                                   position, Muhs et al. (2014) assigned the San Miguel terrace
Hanson et al. (1992) mapped a flight of marine terraces            to MIS 5a (Fig. 4).
across south-central California; the lowest terrace, Q1, with
surveyed shoreline angles between 5–14 m a.p.s.l., is over-        5.1.12   Palos Verdes Hills, California
lain by up to 2 m of marine sediment and 15–30 m of
non-marine sediment and is cut by several reverse faults           Woodring et al. (1946) conducted early mapping of the 13
(Fig. 2). The Q1 terrace was assigned to MIS 5a based upon         emergent shore platforms of the Palos Verdes Peninsula;
three uranium-series minimum ages on marine and terrestrial        seven early uranium-series ages, each corrected for open-
mammal teeth and bones found in the overlying sediment             system behavior, assigned the first (lowest) terrace to MIS 5a
deposits (Fig. 4). We included in the WALIS database two           (Szabo and Rosholt, 1969). Muhs et al. (1992a) showed, on
uranium-series ages on corals considered unreliable by the         the basis of aminostratigraphy on Tegula and Protothaca and
authors.                                                           oxygen isotope data on Epilucina, that the “first terrace”, as
                                                                   mapped by Woodring et al. (1946), instead represents high-
5.1.10    Gaviota, California
                                                                   stand deposits of both MIS 5a and 5e. Muhs et al. (2006) re-
                                                                   fined map units and assigned place-based names to supplant
Rockwell et al. (1992) mapped five well-expressed marine           the counting scheme of Woodring et al. (1946), redefining the
abrasion platforms using transit-stadia surveys; the lowest        lowest horizontally continuous surface as the Paseo del Mar
instance, the Cojo terrace (10–17 m a.p.s.l. shoreline angle;      terrace (the “second” terrace of Woodring et al., 1946) with
Fig. 2), is found west of the South Branch Santa Ynez fault        an estimated shoreline elevation angle of ∼ 45–47 m a.p.s.l.
(SBSYF) and crosses the hinge of the Government Point syn-         (Fig. 2). A combination of 13 uranium-series ages on Bal-
cline. Seven uranium-series ages on bone and mollusk (two          anophyllia and extralimital northern species within the fau-
of which are maximum ages), eight amino acid ratios, and           nal assemblage assigns the Paseo del Mar terrace to MIS 5a
the cool-water aspect of the terrace fauna assign the Cojo ter-    (Fig. 4). Around Lunada Bay, Muhs et al. (2006) estimated
race to MIS 5a (Rockwell et al., 1992; Kennedy et al., 1992;       a ∼ 60–70 m a.p.s.l. elevation shoreline angle for the “third”
Fig. 4). Rockwell et al. (1992) correlated the first emergent      terrace of Woodring et al. (1946), an unnamed intermediate
terrace east of the SBSYF to the Cojo terrace based upon           terrace between the Paseo del Mar (MIS 5a) and Gaffey (MIS
similar amino acid ratios and terrace faunal aspect. While         5e; the “fifth” terrace of Woodring et al., 1946); as this terrace
the elevation of the overlying second terrace at this locale       does not have geochronological control, we do not include it
was not reported by Rockwell et al. (1992), Simms et al.           as an MIS 5c indicator.
(2016) extracted an elevation of 25 m a.p.s.l. from an illustra-
tion of the shore-parallel terrace profile (see Fig. 2 of Rock-    5.1.13   San Joaquin Hills, California
well et al., 1992; Fig. 3). No radiometric ages exist for the
second terrace; Rockwell et al. (1992) inferred an MIS 5c          Vedder et al. (1957) first mapped the emergent marine ter-
age for the second terrace using stratigraphic correlation to      races at San Joaquin Hills. Grant et al. (1999) extended the
the 5a terrace and the cool-water aspect of the terrace fauna      mapping of previous unpublished surveys (see the litera-
(Fig. 5).                                                          ture discussed therein) and revised the shoreline angle eleva-
                                                                   tion of the first emergent terrace to 19–22 m a.p.s.l. (Fig. 2).
5.1.11    California Channel Islands (San Miguel and
                                                                   Based on a single uranium-series age on coral and correla-
          Santa Rosa islands)
                                                                   tions between terrace height and presumed eustatic sea level,
                                                                   Grant et al. (1999) argued that either the first terrace formed
Orr (1968) first mapped marine terraces on northwestern            during MIS 5a and hosts reworked MIS 5c coral or that the
Santa Rosa Island, and later efforts by Dibble and Ehren-          MIS 5a and 5c highstands occupied the same terrace (Fig. 4).
speck (1998) and Pinter et al. (2001) elaborated on both
terrace mapping and the geology of the island. Muhs et al.         5.1.14   San Nicolas Island, California
(2014) utilized differential GPS to map the flight of emer-
gent marine terraces on San Miguel and Santa Rosa Island,          Vedder and Norris (1963) mapped 14 emergent bedrock-
of which we focus on the lowest terrace at Santa Rosa Island,      incised marine terraces on San Nicolas Island and docu-
with a shoreline angle mapped between 5.4–7.4 m a.p.s.l.,          mented their associated faunal assemblages. Muhs et al.
and the lowest terrace at San Miguel Island, with a shoreline      (1994, 2006) reported 56 uranium-series ages on corals
angle mapped at ∼ 3.5 m a.p.s.l. (Fig. 2). Two amino acid ra-      found in multiple outcroppings of the lowermost two ter-
tios on Chlorostoma shells assigned the lowest Santa Rosa          races (terraces 1 and 2) which assign these to MIS 5a and

Earth Syst. Sci. Data, 13, 3467–3490, 2021                                          https://doi.org/10.5194/essd-13-3467-2021
S. B. Thompson and J. R. Creveling: MIS 5a and 5c indicator database 3475
5e, respectively (Fig. 4). Muhs et al. (2012) utilized differen- these radiometric ages imply that the Dume terrace corre-
tial GPS measurements to revise previously reported shore- lates with San Nicolas Island terrace 2 (Birkeland, 1972; see
line angle elevations for terraces 1 and 2 and subdivided ter- above). Szabo and Rosholt (1969) and Birkeland (1972) doc-
race 2 into two distinct geomorphic units (terraces 2a and umented a higher adjacent terrace, referred to as “terrace C”
2b). Muhs et al. (2012) argued that, together, the geomor- or “Corral terrace”, which crops out between the Malibu and
phic relationships and the 65 new uranium-series ages on Dume terraces. Szabo and Rosholt (1969) utilized the same
solitary corals supported the conclusions that (i) terrace 2a corrected uranium-series methods to assign the Corral terrace
(36–38 m a.p.s.l.) formed during MIS 5e; (ii) terrace 2b (28– to MIS 5e.
33 m a.p.s.l.), which hosts corals of ∼ 120 and ∼ 100 ka age
clusters, formed during MIS 5c and captures reworked fossils 5.1.17 Punta Banda, Mexico
from the adjacent, formerly more extensive 5e terrace (ter-
race 2a); and (iii) terrace 1 (8–13 m a.p.s.l.) formed during Lindgren (1889) first documented Punta Banda marine ter-
MIS 5a. Muhs et al. (2012) argued that the distinctive faunal races, and Allen et al. (1960) and Rockwell et al. (1989)
assemblages of terraces 1, 2a, and 2b serve to further support mapped the lowest 13 and 12 terraces in detail, respec-
their different ages. The terrace elevations reported by Muhs tively. The Lighthouse terrace, the lowest mapped terrace
et al. (2012) are shown in Figs. 2 and 3; Figs. 4 and 5 show (15–17.5 m a.p.s.l. shoreline angle; Fig. 2), is well preserved
the full suite of uranium-series ages reported for San Nico- on the south side of the peninsula, though discontinuous
las Island terraces 1, 2a, and 2b (Muhs et al., 1994; 2006; on the north side (Rockwell et al., 1989). Fifteen uranium-
2012). The MIS 5a and 5c WALIS entries include uranium- series ages on Balanophyllia elegans assign the Lighthouse
series ages MH12-001-001–MH12-055-001 and MH12-057- terrace to MIS 5a, and extralimital northern species in the
001 from Chutcharavan and Dutton (2021). faunal assemblage support this designation (Rockwell et al.,
1989; Fig. 4). A fragmented, narrow second terrace crops out
5.1.15 Point Loma and Oceanside, California
across the Punta Banda peninsula with a shoreline angle of
22 m a.p.s.l. (Rockwell et al., 1989; Fig. 3). No radiometric
Ellis (1919) first mapped five marine terraces at Point Loma. ages exist for the second terrace, though stratigraphic rela-
Hertlein and Grant (1944) briefly revisited the lower terraces. tionships imply an age of MIS 5c (see discussion in Rockwell
Carter (1957) extended the mapping to include an additional et al., 1989; Fig. 5).
terrace cropping out lower than the lowest terrace surveyed
by Ellis (1919), later named Bird Rock terrace (Kern, 1977). 5.1.18 Punta Cabras, Mexico
Kern (1973) documented deformation of the Point Loma ter-
races. Kern and Rockwell (1992) utilized hand levels to re- At Punta Cabras, Baja California, Mexico, Addicott and
vise the shoreline angle elevation of the Bird Rock terrace to Emerson (1959) first documented a narrow, discontinuous
9–11 m a.p.s.l. (Fig. 2). The outcropping of Bird Rock terrace marine terrace with inner-edge elevations of 4.5–17 m a.p.s.l.
to the west at Oceanside is also mapped at 9–11 m a.p.s.l. (Fig. 2). No radiometric ages exist for this terrace, though a
(Fig. 2). Ku and Kern (1974) reported two uranium-series limited number of radiocarbon ages and extralimital north-
ages on mollusks but did not utilize these to assign an age ern species in the faunal assemblage of overlying marine and
to Bird Rock terrace due to secondary uptake of uranium in non-marine deposits support a terrace assignment to MIS 5a
the mollusk shells. Uranium-series ages MH02-056-001 de- (Addicott and Emerson, 1959; Mueller et al., 2009; Fig. 4).
rive from Chutchavaran and Dutton (2021). In the absence of
radiometric ages, calibrated amino acid ratios support a Bird 5.1.19 Summary
Rock terrace age assignment to MIS 5a (Kern, 1977; Kern
and Rockwell, 1992; Fig. 4). Marine terraces comprise the entirety of MIS 5a and 5c rela-
tive sea level indicators cropping out along the North Amer-
5.1.16 Malibu, California
ican Pacific coast. While in principle marine terraces can
serve as excellent quality indicators (see 3 and 4), Pacific
Davis (1932) mapped three emergent marine terraces around coast marine terraces receive quality ratings from very poor
Malibu, California, which, in ascending order, are named (1) to average (3) (Fig. 6a and d and Tables 1 and 2). These
the Monic, Dume, and Malibu terraces, of which we focus ratings reflect four systematic uncertainties. First, no primary
on the westward-tilting Dume terrace. Birkeland (1972) re- reference reports a terrace’s indicative range, the distance
visited the Dume terrace, of which the shoreline angle sits between the storm wave swash height and the wave break-
between ∼ 7 and 40 m a.p.s.l. (Fig. 3). Szabo and Rosholt ing depth (Vacchi et al., 2014; Rovere et al., 2016), and this
(1969) reported seven uranium-series ages on mollusks sam- precludes a calculation of indicative meaning. Given this ab-
pled from the Dume terrace consistent with an MIS 5c age sence, we used the IMCalc software to quantify the indicative
(Fig. 5), though these ages utilized an open-system model meaning of all Pacific coast marine terraces (WALIS RSL
to compensate for mobile uranium within shells. If correct, IDs 3473–3503; Lorscheid and Rovere, 2019). The arising
https://doi.org/10.5194/essd-13-3467-2021 Earth Syst. Sci. Data, 13, 3467–3490, 20213476 S. B. Thompson and J. R. Creveling: MIS 5a and 5c indicator database
Figure 6. MIS 5a (a–c) and MIS 5c (d–f) sea level indicator elevation quality ratings atop the Matplotlib Basemap Shaded Relief map
(Hunter, 2007). For the five Iranian subsites we plotted the lowest quality ratings of those listed in Tables 1 and 2.
indicative ranges tend to vary between 4 and 7.5 m, which We assigned the chronologies of the North American Pa-
necessitates quality ratings of poor (2) and lower (as for MIS cific coast marine terrace ratings from good (4) to poor (2)
5a and 5c terraces at Cape Arago, Coquille Point, Bruhel (Fig. 7a and d and Tables 1 and 2). The three methods
Point, Gaviota, and San Nicolas Island; MIS 5a terraces at that conferred good quality (4) ratings for this region in-
Santa Cruz (Western and Davenport), San Miguel Island, clude first, reproducible, high-precision uranium-series ages
Santa Rosa Island, Oceanside, and Point Loma; and the MIS on solitary coral skeletal carbonate (as for MIS 5a terraces at
5c terrace at Santa Cruz, and Wilder). The MIS 5a and 5c Coquille Point, Santa Cruz (Davenport terrace), Palos Verdes
terraces at Punta Banda are the sole exception as these ele- Hills, San Nicholas Island, and Punta Banda); second, high-
vation measurements are sufficiently precise to warrant aver- precision luminescence ages (as for the MIS 5a Point Reyes
age quality (3) ratings. Second, the primary literature rarely marine terrace); and third, AAR on mollusks (the MIS 5a and
reports the reference datum for the RSL indicator elevation. 5c terraces at Gaviota and the MIS 5a terraces at Newport,
Third, the use of altimetry and topographic map measure- Santa Rosa Island, and Oceanside). For chronologic methods
ment techniques before the widespread adoption of differ- that yielded age uncertainty beyond the bounds of an MIS 5
ential GPS means that literature-reported measurement un- substage – often arising from substrate experiencing open-
certainties generally exceed ∼ 3 m (as for the MIS 5a ter- system diagenesis – we applied an average (3) quality rating.
races at Palos Verdes Hills and San Joaquin Hills). Fourth, Examples of this include uranium-series ages on coral (the
many regional terraces also crop out over a range of eleva- MIS 5a terrace at San Joaquin Hills and the MIS 5c terrace
tions due to faulting or tilting, and this range further con- at Malibu) or mollusks (the MIS 5a terrace at Point Loma),
tributes to RSL uncertainty (such as for MIS 5a and 5c ter- cosmogenic ages (the MIS 5a and 5c terraces at Santa Cruz,
races at Newport and Brookings; MIS 5a terraces at Point Western, and Wilder), radiocarbon ages (the MIS 5a terrace
Reyes, San Simeon, Point Buchon, and Punta Cabras; and at Punta Cabras), luminescence ages (the MIS 5a terrace at
MIS 5c terraces at Santa Cruz (Highway 1) and Malibu). As San Simeon), and AAR on mollusks (the MIS 5a terrace at
all four systematic uncertainties apply to many Pacific coast Bruhel Point). While Muhs et al. (2012) interpreted the MIS
marine terraces, and at least one uncertainty applies to all ter- 5c and 5e uranium-series ages on corals from San Nicholas
races, the Pacific coast yields quality ratings of very poor (1) Island Terrace 2b as an indication of terrace reoccupation,
to average (3). From this we conclude that revisiting indica- which could afford a good (4) quality rating, here we as-
tor elevation measurements with modern mapping methods sign Terrace 2b an average (3) quality rating given that these
could better constrain Pacific coast MIS 5a and 5c terrace ages span a time interval longer than either individual MIS.
elevations, indicative meanings, and RSL uncertainties. Poor quality (2) chronology ratings arise from the relative
dating method of terrace counting (MIS 5a and 5c terraces
Earth Syst. Sci. Data, 13, 3467–3490, 2021 https://doi.org/10.5194/essd-13-3467-2021S. B. Thompson and J. R. Creveling: MIS 5a and 5c indicator database 3477
Table 1. The location name, latitude and longitude, elevation, indicator type, dating method, and assigned elevation and age quality ratings
for marine isotope stage 5a indicators.
Site Latitude Longitude Elevation Indicator Dating method Indicator Age
typea quality quality
Newport 44.63 −124.05 (0–45) ± 3.3 SLI AAR, other 1 4
Cape Arago 43.306531 −124.401657 31 ± 2 SLI Other 2 2
Coquille Point 43.114117 −124.437096 18 ± 2 SLI U-series, AAR 2 4
Brookings 42.05 −124.28 (30–62) ± 6 SLI Other 1 2
Bruhel Point 39.607469 −123.786856 10 ± 2 SLI Stratigraphy, AAR 2 3
Point Reyes 37.9 −122.6938 (38–77) ± 3.4 SLI Luminescence 1 4
Santa Cruz (Western terrace) 36.96 −122.09 87 ± 3.3 SLI Other 2 3
Santa Cruz (Davenport terrace) 37.0294755 −122.1923133 (5–10) SLI U-series, AAR, other 2 4
San Simeonb 35.639462 −121.1848936 (5–24) ± 2 SLI U-series, luminescence, other 1 3
Point Buchon 35.2552529 −120.8990702 (5–14) ± 2 SLI U-series, other 1 2
Gaviota 34.4675398 −120.2674989 (10–17) ± 2 SLI U-series, AAR, other 2 4
Santa Rosa Island 34.003812 −120.195602 (5.4–7.4) ± 1 SLI AAR 2 4
San Miguel Island 34.0191768 −120.3177209 3.5 SLI Stratigraphy 2 2
Palos Verdes Hills 33.7246996 −118.3552086 (45–47) SLI U-series, AAR 2 4
San Joaquin Hills 33.5696784 −117.8385408 (19–22) SLI U-series 2 3
San Nicolas Island 33.2472453 −119.5070695 (8–13) ± 0.3 SLI U-series 2 4
Oceanside 33.17 −117.35 (9–11) ± 2 SLI AAR 2 4
Point Loma 32.67 −117.24 (9–11) ± 2 SLI U-series, AAR 2 3
Punta Banda 31.7455541 −116.7394247 (15–17.5) ± 0.2 SLI U-series 3 4
Punta Cabras 31.33 −116.44 (4.5–17) SLI Other 1 3
Virginia Beach 36.7823 −76.1966 7.5 ± 3 SLI U-series, AAR, ESR 3 4
Moyock 36.508 −76.153 5±3 SLI U-series 3 4
Pamlico Sound 35.4828287 −75.951469 (9–14) SLI Luminescence 2 4
Charleston 32.8586 −79.7803 5±3 SLI U-series 3 4
Skidaway 31.916 −81.071 3±3 SLI U-series 2 4
Freeport Rocks 27.7852552 −96.9132876 −18.9 TL Luminescence 0 4
Fort St. Catherine 32.390733 −64.674732 (1–2) ± 1 TL U-series, AAR 0 4
Sand Key Reef 24.4977811 −81.8477838 (−12 to −10) SLI U-series 3 4
Eleuthera Island 25.0090818 −76.3780482 (−5–0) SLI AAR 3 4
Northwestern Peninsula 19.8039797 −73.3097345 23.4 SLI U-series 2 4
Christ Church 13.0699141 −59.5693843 3 +1/−2 SLI U-series, other 4 4
Clermont Nose 13.1350465 −59.6345479 20 +3/−2 SLI U-series, other 3 3
Southern coast 13.0698341 −59.5409821 (2–3) ± 1 SLI U-series, ESR 3 4
Oahu 21.4477881 −158.1997812 (−30 to −20) SLI U-series 2 4
Bahía Inglesa −27.1142508 −70.8742622 10 ± 5 SLI Stratigraphy 2 2
Daebo–Gori region 36.0554812 129.5444388 (8–11) SLI Luminescence 3 2
Pamilacan Island 9.4951118 123.9281264 6±1 SLI U-series 3 4
Tewai section −6.2206748 147.6766172 260 SLI U-series, stratigraphy 2 4
Kwambu section −6.0704502 147.5171788 117 SLI U-series, stratigraphy 2 3
Hateruma Island 24.058648 123.7817205 23 ± 2 SLI U-series 3 3
Atauro Island −8.3012532 125.5565624 20 SLI Other 2 2
Lipar 25.2567922 60.80393 20 ± 2.1 SLI U-series, luminescence 3 4
Lipar 25.2591769 60.7979098 45 ± 2.1 SLI Luminescence 3 4
Ramin 25.2694195 60.763467 −2 ± 4.3 SLI Luminescence 2 3
Gurdim 25.3390736 60.1665682 62 ± 2.1 SLI Luminescence 3 4
Jask 25.6552358 57.7874395 −3 ± 4.3 SLI Luminescence 2 4
Bsissi 33.7171283 10.313814 −8 ± 1 TL Stratigraphy 0 2
Ghannouche 33.7072534 10.3343664 −9 ± 1 TL Stratigraphy 0 2
Teboulbou 33.7007635 10.3519874 −8 ± 1 TL Stratigraphy 0 2
Kettana 33.6785967 10.4125647 −9 ± 1 TL Stratigraphy 0 2
Zarat 33.6785967 10.4125647 −8 ± 1 TL Stratigraphy 0 2
Spencer Gulf −33.9120079 136.8615574 −8 ML Other 0 2
Robe Range −37.219789 139.787838 (−6–2) TL AAR, other 0 3
a SLI: sea level indicator; TL: terrestrial-limiting; ML: marine-limiting. b Terrace chronology does not differentiate MIS 5 substage.
at Bruhel Point; the MIS 5a terrace at San Miguel Island; methods and maximum and minimum limiting ages confer
and the MIS 5c terraces at Cape Arago, Coquille Point, and a poor (2) rating for MIS 5a and 5c terraces at Newport,
Punta Banda). For this region, chronologic assignment by Brookings, and Gaviota; the MIS 5a terrace at Cape Arago;
terrace counting is especially common for MIS 5c terraces and the MIS 5c terrace at Santa Cruz (Highway 1 terrace).
with an adjacent, well-dated MIS 5a terrace. Non-traditional Likewise, minimum limiting uranium-series age on mammal
https://doi.org/10.5194/essd-13-3467-2021 Earth Syst. Sci. Data, 13, 3467–3490, 20213478 S. B. Thompson and J. R. Creveling: MIS 5a and 5c indicator database
Table 2. Marine isotope stage 5c.
Site Latitude Longitude Elevation Indicator Dating method Indicator Age
typea quality quality
Newport 44.63 −124.05 (0–85) ± 6 SLI Other 1 2
Cape Arago 43.306531 −124.401657 68 ± 2 SLI Stratigraphy 2 2
Coquille Point 43.114117 −124.437096 70 ± 2 SLI Stratigraphy 2 2
Brookings 42.05 −124.28 (57–90) ± 6 SLI Other 1 2
Bruhel Point 39.607469 −123.786856 23 ± 2 SLI Stratigraphy 2 2
Santa Cruz (Wilder terrace) 36.96 −122.09 132 ± 3.3 SLI Other 2 3
Santa Cruz (Highway 1 terrace) 37.0294755 −122.1923133 26 SLI Other 1 2
Gaviota 34.4675398 −120.2674989 25 ± 5 SLI AAR, other 2 4
San Nicolas Island 33.2472453 −119.5070695 (28–33) ± 0.3 SLI U-series 2 3
Malibu 34.03 −118.71 (7.6–39.6) SLI U-series 1 3
Punta Banda 31.7455541 −116.7394247 22 ± 0.2 SLI Stratigraphy 3 2
Fort St. Catherine 32.390733 −64.674732 Not Reported TL U-series, AAR 0 3
Berry Islands 25.6250042 −77.8252203 (0.2–2.3) ± 1 SLI U-series 4 3
Northwestern Peninsula 19.8039797 −73.3097345 37.2 SLI U-series 2 4
Christ Church 13.0699141 −59.5693843 6 +5/ − 1 SLI U-series, other 2 4
Clermont Nose 13.1350465 −59.6345479 30 +3/−2 SLI U-series, other 3 4
Southern coast 13.0698341 −59.5409821 (4–16) ± 1 SLI U-series, ESR 2 4
Oahu 21.4477881 −158.1997812 (−30 to −20) SLI U-series 2 4
Bahía Inglesa −27.1142508 −70.8742622 31 ± 5 SLI Stratigraphy 2 2
Daebo–Gori region 36.0554812 129.5444388 (17–22) SLI Luminescence, other 3 2
Pamilacan Island 9.4951118 123.9281264 13 ± 1.6 SLI U-series 3 4
Panglao Island 9.573798 123.8221394 5 SLI U-series 3 4
Tewai section −6.2206748 147.6766172 338 SLI Stratigraphy 2 2
Kwambu section −6.0704502 147.5171788 160 SLI U-series, stratigraphy 2 3
Hateruma Island 24.058648 123.7817205 30 ± 2 SLI U-series 3 4
Atauro Island −8.3012532 125.5565624 36 SLI U-series 2 4
Zarat 33.6785967 10.4125647 −18 ± 1 TL Stratigraphy 0 2
Zerkine 33.6785967 10.4125647 −18 ± 1 TL Stratigraphy 0 2
Zerkine 33.6785967 10.4125647 −20 ± 1 TL Stratigraphy 0 2
Spencer Gulf −33.9120079 136.8615574 −14 ML Other 0 2
Robe Range −37.219789 139.787838 −2 TL AAR, luminescence, other 0 4
a SLI: sea level indicator; TL: terrestrial-limiting; ML: marine-limiting.
teeth and bone and unreliable uranium-series dates on coral port an age assignment of MIS 5 sensu lato, without a spe-
(see Hanson et al., 1992) assign Point Buchon a poor quality cific substage designation (Mirecki et al., 1995). No MIS 5c-
rating (2). For the North American Pacific coast, MIS 5a ter- equivalent coral terraces were recognized across this region.
races generally received higher quality ratings than MIS 5c
terraces (Tables 1 and 2). 5.2.2 Pamlico Sound, North Carolina
Parham et al. (2013) utilized outcrops and sediment cores to
5.2 North American Atlantic coast and the Caribbean map late Quaternary beach deposits, of which we focus on a
5.2.1 Virginia Beach, Virginia; Moyock, North Carolina; deposit primarily composed of a thin veneer of sand and lam-
Charleston, South Carolina; and Skidaway, inated sand. The sequence appears discontinuously through
Georgia the study site at an elevation of 9–14 m a.p.s.l. (Fig. 2): east
of the Chowan River, the deposit forms a prograding spit,
Cronin et al. (1981) mapped emergent coral terraces along whereas further east of the Suffolk shoreline the deposit
the Atlantic coast of the United States, from Virginia to Geor- forms a seaward-thickening wedge, and the deposit is not
gia, and reported reconstructions of paleo-sea level based well preserved in the northern and southern portions of the
upon their documented terrace elevations. Wehmiller et al. study area. Shelly marine material within the deposit was
(2004) revisited the Virginia Beach, Moyock, Charleston, assigned to MIS 5a using calibrated amino acid racemiza-
and Skidaway sites and reported the maximum elevation tion and optically stimulated luminescence dating (Fig. 4).
of the four coral-bearing units as ∼ 7.5, ∼ 5, ∼ 5, and Two uranium-series ages now support an MIS 5a age assign-
∼ 3 m a.p.s.l., respectively (Fig. 2). A total of 27 uranium- ment for these beach deposits (Wehmiller et al., 2021a). See
series ages on corals assign the terraces at these 4 sites to Wehmiller (2021b) for a comprehensive database of AAR
MIS 5a (Cronin et al., 1981; Szabo, 1985; Wehmiller et al., ages for the North American Atlantic coast.
2004; see Fig. 4). Further, five electron spin resonance ages
and eight amino acid ratios at the Virginia Beach site sup-
Earth Syst. Sci. Data, 13, 3467–3490, 2021 https://doi.org/10.5194/essd-13-3467-2021S. B. Thompson and J. R. Creveling: MIS 5a and 5c indicator database 3479
5.2.3 Freeport Rocks, Texas 5.2.5 Sand Key Reef, Florida
Simms et al. (2009) documented a sedimentary deposit Seismic-reflection profiles documented submerged outlier
within offshore sediment cores, referred to as the Freeport reefs along the windward side of the modern Florida Keys
Rocks Bathymetric High, consisting of barrier island facies. (Lidz et al., 1991; Ludwig et al., 1996; Toscano and Lund-
The deposit appears at its highest elevation within the core berg, 1999). While the Sand Key Reef shows geomorphic
at 18.9 m b.p.s.l. (below present-day sea level; Fig. 2). The complexity, the primary reef crest sits ∼ 10–12 m b.p.s.l.
authors assign the Freeport Rocks Bathymetric High to MIS (Fig. 2). The reef primarily comprises Montastrea annularis,
5a based upon a single optically stimulated luminescence age with a thin overgrowth of reef crest Acropora palmata (Lud-
(Fig. 4). wig et al., 1996). Two radiocarbon ages along with eight
uranium-series ages on Montastrea annularis, Acropora pal-
5.2.4 Fort St. Catherine, Bermuda mata, and Colpophyllia natans assign the main reef growth
to MIS 5a (Lidz et al., 1991; Ludwig et al., 1996; Toscano
A rich literature describes the evolution of the stratigraphic and Lundberg, 1999; Fig. 4).
nomenclature of Bermuda, comprised of six carbonate units
separated by terra rosa paleosols (Land et al., 1967; Vacher
5.2.6 Eleuthera Island, Bahamas
and Hearty, 1989; Hearty, 2002). The marine member of the
Southampton Formation, mapped at 1 m a.p.s.l. (Vacher and Skeletal eolianites comprising Eleuthera Island are inter-
Hearty, 1989), was tentatively assigned to MIS 5a or 5c us- preted as eolian dunes and are separated from the underlying
ing amino acid stratigraphy (Harmon et al., 1983; Hearty formations by paleosols (Kindler and Hearty, 1996; Hearty,
et al., 1992), though, subsequently, 24 uranium-series ages 1998; Hearty and Kaufman, 2000). The authors report an in-
reported across multiple studies have indicated an MIS 5a ferred paleo-sea level of 0–5 m b.p.s.l. rather than the modern
age assignment (Harmon et al., 1983; Ludwig et al., 1996; elevation of the deposit (Hearty and Kaufman, 2000; Fig. 2).
Muhs et al., 2002; see Fig. 4). The Pembroke unit of the The stratigraphic position, location, and amount of diage-
Rocky Bay Formation, previously classified as the Pembroke netic alteration of the eolianite, along with whole-rock amino
Formation (with a proposed alternate name of the Hungry acid ratios, assign the unit to MIS 5a (Fig. 4).
Bay Formation), has generated more debate. Amino acid ra-
tios on Poecilozonites support a MIS 5c age assignment (Har- 5.2.7 Berry Islands, Bahamas
mon et al., 1983), while whole-rock amino acid ratios sup-
port an age assignment of MIS 5e (Hearty et al., 1992). Four Newell (1965) reported a single uranium-series age for a
uranium-series ages yielded one MIS 5e coral, two MIS 5c- coral welded with caliche to a platform on the Berry Islands,
aged corals, and one modern coral (Harmon et al., 1983; see which assigned the coral to MIS 5a. Neumann and Moore
Fig. 5), though Vacher and Hearty (1989) argued that pub- (1975) reported 11 additional uranium-series ages on corals
lished uranium-series ages were unable to resolve an MIS 5 found at 0.2–2.3 m a.p.s.l. (Fig. 3) as MIS 5 in age, though
substage for the Rocky Bay Formation and instead hypothe- the range of ages could not assign the ridge to a specific sub-
sized that this unit represents MIS 5e. For the purposes of this stage highstand. Creveling et al. (2017) noted that an MIS 5c
review, the Pembroke unit chronology is included in Fig. 5, age assignment for the Berry Islands corals fits the published
with both 5c and 5e age assignments included. No elevation age uncertainty (Fig. 5).
was reported for the Pembroke unit.
Moreover, controversy exists over the classification of 5.2.8 Northwestern Peninsula, Haiti
both the Southampton Formation and the Pembroke unit of
the Rocky Bay Formation. Harmon et al. (1983) hypothe- Woodring et al. (1924) first documented the geology of the
sized that both units formed from storm wave activity, and, Northwestern Peninsula, which was followed by further re-
thus, the deposits do not serve as indicators of a sea level search summarized by Dodge et al. (1983). Dodge et al.
highstand. Toscano and Lundberg (1999) supported this hy- (1983) mapped seven constructional coral reef terraces com-
pothesis, further specifying that the units were formed in the posed primarily of Acropora palmata, of which we focus on
Holocene and incorporated corals of many different ages. the lowest two, the Mole and Saint terraces. Dumas et al.
Alternatively, other studies argued the location of Fort St. (2006) published altimeter surveys for the Mole and Saint
Catherine relative to the platform margin, and the narrow terraces (also referred to as T1 and T2), revising the previ-
range of MIS 5a ages on corals found within the Southamp- ously reported inner-edge elevations to 23 and 37 m a.p.s.l.,
ton Formation reveal that these units represent a sea level respectively (Figs. 2 and 3). Dodge et al. (1983) and Dumas
highstand (Vacher and Hearty, 1989; Ludwig et al., 1996; et al. (2006) argued that 15 uranium-series ages on corals
Muhs et al., 2002). Here we include both units within the support the conclusion that (i) the Mole terrace formed dur-
database. ing MIS 5a; (ii) the Saint terrace formed during MIS 5c; and
(iii) both terraces host corals reworked from the adjacent MIS
5e terrace (see Figs. 4 and 5).
https://doi.org/10.5194/essd-13-3467-2021 Earth Syst. Sci. Data, 13, 3467–3490, 20213480 S. B. Thompson and J. R. Creveling: MIS 5a and 5c indicator database
5.2.9 Christ Church and Clermont Nose traverses, Pacific coast indicators, we support revisiting coral reef ter-
southern coast of Barbados races and beach deposits with quality ratings of average (3) to
poor (2) to improve uncertainty by applying modern methods
Mesolella (1967) first mapped the coral reef terraces of the for elevation measurement and adopting an updated frame-
Christ Church and Clermont Nose traverses. Bender et al. work to constrain indicative meaning.
(1979) revisited nine reef tracts at Christ Church and seven We assigned the North American Atlantic coast and
reef tracts at Clermont Nose. A total of 28 uranium-series Caribbean chronologies ratings of good (4) to average (3)
ages on corals, along with 12 protactinium-231 ages, assign (Fig. 7b and e and Tables 1 and 2). For this region, good rat-
the Worthing and Ventor terraces at both traverses to MIS 5a ings (4) arose from one of three methods: first, high-precision
and 5c, respectively (Broecker et al., 1968; Mesolella, 1969; uranium-series ages from skeletal coral (from MIS 5a and
Bender et al., 1979; Bard et al., 1990; Edwards et al., 1997; 5c indicators at Northwestern Peninsula, Christ Church, and
see Figs. 4 and 5). The elevations of the Worthing and Ventor southern coast; MIS 5a indicators at Virginia Beach, Moy-
terraces are mapped at 3 and 6 m a.p.s.l. at Christ Church and ock, Charleston, Skidaway, Sand Key Reef, and Fort St.
20 and 30 m a.p.s.l. at Clermont Nose (Figs. 2 and 3). Schell- Catherine; and the MIS 5c indicator at Clermont Nose); sec-
mann and Radtke (2004) mapped additional terraces on the ond, high-precision luminescence ages (on MIS 5a indicators
southern coast. The two sub-terraces T-1a1 and T-1a2 were at Pamlico Sound and Freeport Rocks); and third, AAR dat-
collectively mapped at 2–3 m a.p.s.l. and assigned to MIS 5a ing (at Eleuthera Island). Sites that receive an average qual-
based on two averaged ESR ages and one uranium-series age ity rating (3) have uranium-series-based chronologies which
(Figs. 2 and 4). The sub-terraces T-1b, T-2, and T-3 were col- span MIS 5 (the MIS 5a indicator at Clermont Nose and the
lectively mapped at 4–16 m a.p.s.l. and assigned to MIS 5c MIS 5c indicators at Fort St. Catherine and the Berry Is-
based on three averaged ESR ages and one uranium-series lands). We advocate continued focus on sites with average
age (Figs. 3 and 5). quality ratings (3) – those that have substrate amenable to
geochronology yet have imprecise ages – to improve chrono-
5.2.10 Summary logic assignments.
The North American Atlantic coast and Caribbean sea level 5.3 Far field
indicators, which consist of coral reef terraces, beach de-
posits, and terrestrial-limiting beach ridges, received eleva- 5.3.1 Oahu, Hawaii
tion quality ratings from good (4) to rejected (0) (Fig. 6b Sherman et al. (2014) utilized offshore drill cores to docu-
and e and Tables 1 and 2). Since none of the primary litera- ment and date two submerged coral reef terraces on Oahu.
ture sources report indicative ranges for the relative sea level A single uranium-series age assigned one terrace to MIS 5a;
indicators along the North Atlantic coast and Caribbean, we two uranium-series ages assigned a second terrace to MIS 5c
calculated these values with the IMCalc software and re- (Figs. 4 and 5), though distinct elevations were not reported
ported these for WALIS RSL IDs 3504–3508, 3511–3519, for the MIS 5a and 5c terraces. Instead, a range of elevations
3556, and 3983–3984 (Lorscheid and Rovere, 2019). The from 20–30 m b.p.s.l. were provided for both terraces (Figs. 2
clear reference datum for the Berry Islands and MIS 5a Christ and 3).
Church coral reef terraces (Neumann and Moore, 1975; Ben-
der et al., 1979) warrants the only good quality (4) ratings
for this region. For MIS 5a and 5c Clermont Nose and those 5.3.2 Bahía Inglesa, Chile
coral reef terraces with no reference data reported (as for MIS Marquardt et al. (2004) utilized altimeter surveys to map
5a RSL indicators at Virginia Beach, Moyock, Charleston, eight emergent marine terraces and the overlying fossilifer-
Sand Key Reef, Eleuthera Island, and southern coast of Bar- ous terrace deposits. The shoreline angle of the two lowest
bados), the assigned quality ratings of average (3) reflect the terraces found above the Holocene beach is mapped at 10
precision of the elevation measurement reported in the pri- and 31 m a.p.s.l. (Figs. 2 and 3). Uranium-series and electron
mary literature and indicative ranges equal to or less than spin resonance ages from a neighboring region assign the two
∼ 2 m as calculated by IMCalc. Coral reef terraces and beach terraces to MIS 5, and their stratigraphic position, assuming
deposits with a poor quality rating (2) reflect either a greater uniform uplift rate, further assigns the 10 and 31 m terraces
elevation measurement uncertainty (as for the MIS 5a and to MIS 5a and 5c (see discussion in Marquardt et al., 2004;
5c RSL indicators at Northwestern Peninsula; the MIS 5a Figs. 4 and 5).
indicator at Pamlico Sound; and the MIS 5c indicators at
Christ Church and southern coast of Barbados) or an indica-
5.3.3 Daebo–Gori region, Korea
tive range greater than ∼ 2 as calculated by IMCalc (as for
MIS 5a Skidaway). The terrestrial-limiting MIS 5a indicator Choi et al. (2008) utilized differential GPS to map marine
at Freeport Rocks and the MIS 5a and 5c indicators at Fort platforms in the Daebo–Gori region. The T2 terrace, with
St. Catherine warrant a rejected (0) quality rating. As with the a shoreline angle mapped at 8–11 m a.p.s.l. (Fig. 2), is a
Earth Syst. Sci. Data, 13, 3467–3490, 2021 https://doi.org/10.5194/essd-13-3467-2021You can also read


