CRASHING THE CLIMATE - #ClimateEmergency - HOW THE CAR INDUSTRY IS DRIVING THE CLIMATE CRISIS - ES ...
←
→
Page content transcription
If your browser does not render page correctly, please read the page content below
CRASHING THE CLIMATE: HOW THE CAR INDUSTRY IS DRIVING THE CLIMATE CRISIS

         CRASHING
        THE CLIMATE
                     HOW THE CAR INDUSTRY
                 IS DRIVING THE CLIMATE CRISIS

                        #ClimateEmergency
“RIGHT NOW, WE ARE FACING A
MAN-MADE DISASTER OF GLOBAL SCALE.
OUR GREATEST THREAT IN THOUSANDS OF YEARS.
CLIMATE CHANGE.
IF WE DON’T TAKE ACTION THE COLLAPSE OF OUR
CIVILISATIONS AND THE EXTINCTION OF MUCH OF
THE NATURAL WORLD IS ON THE HORIZON.”
—Sir David Attenborough, COP24, December 2018
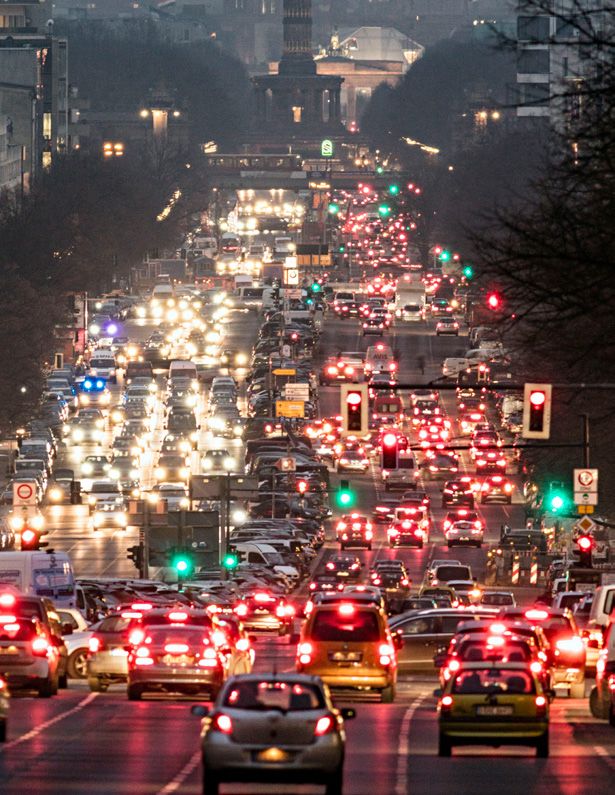
BERLIN AT RUSH HOUR
© PAUL LANGROCK / GREENPEACE
CRASHING THE CLIMATE:
HOW THE CAR INDUSTRY IS
DRIVING THE CLIMATE CRISIS
Greenpeace is an independent global campaigning network of independent organisations that acts
to change attitudes and behaviour, to protect and conserve the environment and to promote peace.

For more information contact:
South Korea contact: press.kr@greenpeace.org
Germany contact: presse@greenpeace.de

Authors: Benjamin Stephan, Insung Lee, Jiseok Kim

Editor: Caroline Roberts
Design: Jayne Worth

Published in September 2019
by Greenpeace East Asia and Greenpeace Germany

Greenpeace East Asia, Seoul office
6F Cheongryong bldg 257
Hangang-daero, Yongsan-gu
Seoul, South Korea (04322)

Greenpeace Germany
Hongkongstr. 10
20457 Hamburg
CONTENTS

EXECUTIVE SUMMARY...................................................................................................... 1

CHAPTER 1: INTRODUCTION............................................................................................6

CHAPTER 2: HOW TRANSPORT IS THREATENING OUR CLIMATE................................7

CHAPTER 3: THE CAR INDUSTRY’S CARBON FOOTPRINT...........................................9

CHAPTER 4: HOW THE CAR INDUSTRY IS FAILING TO RESPOND TO THE
CLIMATE CRISIS...............................................................................................................16

CHAPTER 5: FUEL EFFICIENCY AND HYBRIDS – BAND-AID SOLUTIONS................ 21

CHAPTER 6: WHY SUVS POSE A DANGEROUS RISK TO THE CLIMATE.....................32

CHAPTER 7: STEERING IN THE RIGHT DIRECTION: GREENPEACE
RECOMMENDATIONS AND DEMANDS FOR THE CAR INDUSTRY............................... 36
CRASHING THE CLIMATE: HOW THE CAR INDUSTRY IS DRIVING THE CLIMATE CRISIS                                                                                        1

EXECUTIVE SUMMARY
For some decades, car manufacturers have claimed to understand the grave threat posed by climate change. They
have displayed many alternative greener vehicles at motor shows, attracting much positive media coverage. Their
advertising stresses their huge concern for our wellbeing and safety, especially that of our children. However, their
business decisions tell a very different story.

This report looks at the climate impacts of the world’s 12 largest car manufacturers, providing new calculations
that show the carbon footprint for which they were responsible in 2017 and 2018.1 It demonstrates how they have
repeatedly failed to respond appropriately to the climate emergency, and reviews the lack of progress made
across five major markets: the US, the EU, China, Japan, and South Korea. It sets out Greenpeace’s demands
for the industry to change radically or be consigned to history.

It has been been nearly four years since the signing of the Paris Agreement, and the transition to a climate-friendly
transport system emerged as an important priority. Carmakers must phase-out diesel and petrol cars including
hybrids urgently, with an end to new sales by 2028.2 This will also bring other benefits, such as less traffic
congestion and improved air quality. But the car industry’s inaction is robbing us of that greener, cleaner
and more survivable future.3

This transformation can’t happen overnight. But we need a firm commitment from the industry’s largest players to
phase-out internal combustion engines (ICEs) by implementing an action plan including a concrete timeframe. Car
manufacturers continually refuse to do this. They lobby against robust climate-related regulation, fail to scale up
production of zero emission vehicles effectively, and continuously promote the individual use and ownership of cars.
Therefore, it is crucial that policymakers worldwide put in place regulations that secure rapid phase-out of diesel and
petrol cars and offer alternative means of transport for the public.

As this report shows, improvements in fuel efficiency and updates to hybrid vehicles are no longer adequate solutions
to the climate crisis. Instead they delay the fundamental change that is needed. And the current surge in SUV sales
poses a further serious threat to our climate.

How manufacturers transform their business model is rapidly becoming the central question. If car companies fail to
transition and diversify, they will be history. Those surviving in the future will be the ones producing smaller, lighter,
and more energy-efficient electric vehicles. These vehicles will be designed and marketed to reduce individual use
and ownership of cars, and built to be linked into smart grids powered by 100% renewable energy.

Greenpeace has been challenging car companies to take proportionate action on climate change since the early
1990s.4 In this report, we show that, despite sustained warnings and growing scientific understanding of the gravity
of the climate crisis, the car industry is still doing too little. The transition must start right now — before it is too late.

1.
   The annual carbon footprint of a carmaker is the sum of the lifecycle GHG emissions of the cars it sells in a given year. The lifecycle emissions comprise
production, tailpipe, upstream, and recycling emissions. The lifecycle emissions comprise production, tailpipe, upstream, and recycling emissions.
2.
   See details on page 4
3.
   Freedom to Breathe: Rethinking urban transport, Greenpeace, 2018
https://storage.googleapis.com/planet4-international-stateless/2018/01/1b96c158-air_pollution-transport_report-2018.pdf
4.
   Action at car show, Greenpeace archives, 12 September 1991 https://media.greenpeace.org/archive/Action-at-Car-Show-in-Frankfurt-27MZIF3EBRY.html
CRASHING THE CLIMATE: HOW THE CAR INDUSTRY IS DRIVING THE CLIMATE CRISIS                                                                                                    2

KEY FINDINGS
•     The car industry’s 2018 carbon footprint equals 9% of total annual global greenhouse gas (GHG) emissions.
      In total, the 12 manufacturers 5 analysed in this report are responsible for 4.3 gigatons (Gt) CO2e. Extrapolating
      from this, the entire industry with the 86 million cars it sold in 2018,6 is estimated to be responsible for a
      combined carbon footprint of 4.8 Gt CO2e, equal to 9% of total global GHG emissions.7 The combined footprint
      exceeds the total annual GHG emissions of the entire European Union (4.1 Gt CO2e).8 (see chapter 3)

•     The top five emitters, VW (582m tons CO2e), Renault Nissan (577m tons CO2e), Toyota (562m tons CO2e),
      General Motors (530m tons CO2e), Hyundai-Kia (401m tons CO2e), were responsible for 55% of the industry’s
      carbon footprint. (see chapter 3)
              •      Volkswagen was the biggest climate culprit among carmakers in 2017 and 2018. Its 2018 carbon
                     footprint was 582m tons of CO2e, exceeding the total annual GHG emissions of Australia (535m
                     tons CO2e).9
              •      German manufacturers VW, Daimler and BMW had a combined carbon footprint of 878m tons CO2e
                     in 2018, exceeding the 2018 GHG emissions of Germany (866m tons CO2e).10
              •      Ford, General Motors and Fiat-Chrysler-Automobiles had the largest carbon footprint per vehicle.
                     This is no surprise as particularly in the US, their sales have been dominated by large SUVs and
                     pickup trucks.
              •      Hyundai-Kia’s plan to aggressively increase the proportion of SUVs in its product portfolio will
                     inevitably lead to higher GHG emissions. It has not announced a full, or even partial, ICE phase-out
                     plan in any market. (see chapter 4)

5.
   The resulting carbon footprint covers the car branch of these corporates. Some of the companies also have subsidiaries that are for example producing trucks and buses (e.g.
VW and Daimler). The climate impact of that part of their business has not been considered in this analysis.
6.
   Global car market remains stable during 2018, as continuous demand for SUVs offsets decline in sales of Compact cars and MPVs, JATO, 21 February 2019
https://www.jato.com/global-car-market-remains-stable-during-2018-as-continuous-demand-for-suvs-offsets-decline-in-sales-of-compact-cars-and-mpvs/
7.
   Emissions Gap Report 2018, UNEP, published on 5 December 2018, https://www.ipcc.ch/site/assets/uploads/2018/12/UNEP-1.pdf
8
   Global Annex-I map, UNFCCC 2019, https://di.unfccc.int/global_map
9.
   lbid
10.
    Klimabilanz 2018: 4,5 Prozent weniger Treibhausgasemissionen, Umweltbundesamt, 2019,
https://www.umweltbundesamt.de/presse/pressemitteilungen/klimabilanz-2018-45-prozent-weniger
CRASHING THE CLIMATE: HOW THE CAR INDUSTRY IS DRIVING THE CLIMATE CRISIS 3
TABLE 1: CAR COMPANIES 2018 CARBON FOOTPRINTS
AVERAGE LIFETIME
GHG EMISSIONS
CAR MANUFACTURER MILLION VEHICLES SOLD GHG EMISSIONS
IN MILLION TONS
PER VEHICLE IN TONS
VW Group 582 10.8 53.8
Renault-Nissan Alliance 577 10.3 55.7
Toyota 562 10.4 53.8
General Motors 530 8.6 61.3
Hyundai-Kia 401 7.4 54.0
Ford Motor Corp 346 5.6 61.4
F.C.A 305 4.8 63.1
Honda 283 5.2 54.1
PSA Group (incl Opel) 201 4.1 49.2
Suzuki 164 3.3 49.6
Daimler AG 161 2.7 58.7
BMW AG 136 2.5 54.4
• There is a need to improve the availability of manufacturers’ emissions data. Carmakers, and a number of
governments, need to improve their transparency about fleet emissions data. Comparable information about
production emissions is almost non-existent. Detailed data should be made available to the public so progress
can be tracked more easily and more precise assessments made about future transport emissions. The industry’s
lack of transparency is a significant threat to our climate and to long-term sustainability. (see chapter 3 and 7)
• Manufacturers are failing to transition and there is a lack of investment in solutions. Of the 12 manufacturers
evaluated, only one had set a timeframe to phase out ICE globally. All 12 companies have either no plans or
insufficient plans for a transition compatible with the 1.5°C target. (see chapter 4)
• The gap between official test results and on-road CO2 emissions distorts reality and threatens the climate. Test
results that significantly overestimate a car’s fuel efficiency and underestimate CO2 emissions harm the climate
and deceive customers, who end up spending more on fuel. The supposed reduction in CO2 emissions looks
much less impressive when real-world emissions are being considered. It remains to be seen whether the World-
wide Harmonised Light Vehicle Test Procedure (WLTP) will bring the improvement needed. (see chapter 4 and 5)
• Progress in fuel efficiency has stalled or even reversed. Improvements in average CO2 emissions from new cars
sold in the US, the EU, China, Japan, and South Korea, which account for over 70% of the total global market, have
stalled or even reversed. This shows that ICE technology has to be phased out as it cannot achieve the necessary
emissions reductions. (see chapter 5)CRASHING THE CLIMATE: HOW THE CAR INDUSTRY IS DRIVING THE CLIMATE CRISIS 4
• Hybrids and plug-in hybrids are not solutions. ICE hybrid vehicles, both conventional and plug-in, block the rapid
deployment of real alternatives. Conventional ICE hybrids rely entirely on ICE engines for power so they cannot
achieve the emission reductions needed. Plug-in hybrids can also produce significant CO2 emissions if not
operated in an optimal manner, with mainly short trips. Particularly in Europe, the gap between real-world and
test emissions for plug-in hybrids is significantly larger than it is for ICE cars. (see chapter 5)
• SUVs are making a difficult transition impossible. Sales of SUVs, have increased more than fourfold over the past
10 years, from 8% in 2008 to 32% in 2018 in Europe. In the US, SUVs have reached 69% of market share. Due to their
higher weight and less aerodynamic body, CO2 emissions for SUVs are significantly higher than for similar non-SUV
vehicles. An increase in sales of SUVs is one of the key reasons for stalled progress in CO2 emissions reduction. (see
chapter 6)
• Companies must phase out ICE urgently and take action to move beyond producing ever more cars. Climate change,
and rapid innovation in the transport sector, mean we will need fewer cars in the future. To survive, car manufacturers
must find alternatives to ever-increasing car production. Rather than continually promoting the purchase and
individual use of cars, they must develop and provide innovative transport solutions that help reduce ownership.
These could include car-sharing and ride-pooling services to complement public transport. (see chapter 7)
WHY DOES GREENPEACE DEMAND CAR COMPANIES PHASE-OUT INTERNAL
COMBUSTION ENGINE CARS NO LATER THAN 2028?
The German Aerospace Center (DLR) study on car transport, commissioned by Greenpeace Belgium,
concluded that to achieve a 66% likelihood of keeping global warming below 1.5°C, diesel and petrol
cars must be rapidly phased out in Europe with an end to new sales by 2025, and hybrids by 2028.
Similar global modelling for decarbonising passenger road transport in line with the 1.5°C limit does
not exist yet, but the European phase-out date provides a good benchmark for car companies.
Car manufacturers must act substantively and globally on this issue. It is not good enough to only
phase out diesel alone, or to do so in just one region. Nor is it acceptable to dump high-pollution cars
into other markets, when they are phased-out in another. The DLR target date for Europe must be
applied by the car industry globally, with ICE, including hybrids, phased-out no later than 2028.CRASHING THE CLIMATE: HOW THE CAR INDUSTRY IS DRIVING THE CLIMATE CRISIS 5
GREENPEACE DEMANDS AND RECOMMENDATIONS FOR THE
CAR INDUSTRY
GOAL: ALIGN THE CAR INDUSTRY’S BUSINESS MODEL WITH 1.5°C TARGET
ACTION STEPS
Priority 1: Phase out all ICEs, including conventional hybrids, with news sales ending by 2028 at the latest.
A. Disclose detailed annual reporting of GHG emissions, which includes brand-level CO2 fleet emissions on global
and regional car sales, product-level LCA data of every model, and supply chain emissions via its website in a
publicly available format.
B. Set a company-wide target to phase-out diesel and petrol cars, including hybrids, across all markets. Establish
a clear strategy and concrete roadmap for a 100% EV (battery and fuel cell) transition.
C. Work with employees, labour unions and other relevant third parties to minimise the impact of the transition on
the workforce, including providing necessary reskilling and reallocation packages.
D. Advocate regional, national and global policies that align with the Paris Agreement’s 1.5 °C target, such as
strengthening CO2 regulation, government ICE phase-out plans, and renewable energy procurement.
Priority 2: Build small, energy efficient EVs and do so in a sustainable manner
A. Prioritise producing small, light EVs.
B. Implement standards that minimise and prevent the social and environmental impacts of EVs and EV
battery production.
• Advocate for a renewable energy power grid (EV charging and manufacturing).
• Procure 100% renewable electricity in all production plants across all regions.
• Work with the supply chain so they move to deploying 100% renewable energy and reduce GHG emissions.
• Establish procurement standards for battery supply so resources are used in a way that is environmentally
responsible, efficient and respectful of human rights.
• Establish transparent supply chains and best practice social and environmental standards in mining
and processing raw materials for batteries.
• Increase investment in research and development in battery technology to find sustainable
alternatives to the current materials used such as cobalt and lithium.
• Increase durability, longevity, reparability, energy efficiency, reuse and recyclability of batteries
to minimise the use of virgin materials.
Priority 3: Move beyond producing more cars
A. Promote alternative business models that lead to reducing the individual use and ownership of cars.
B. Invest in mobility solutions that can reduce traffic growth.
C. Provide services that complements public transport, such as car-sharing or ride-pooling service.CRASHING THE CLIMATE: HOW THE CAR INDUSTRY IS DRIVING THE CLIMATE CRISIS 6
CHAPTER 1: INTRODUCTION
“Some people, some companies, some decision-makers in particular, have known exactly what priceless
values they have been sacrificing to continue making unimaginable amounts of money… and I think many
of you here today belong to that group of people.” Greta Thunberg, Davos, January 2019 11
The latest Special Report on Global Warming of 1.5°C by the Intergovernmental Panel on Climate Change (IPCC) stresses the
urgent need for “rapid, far-reaching, and unprecedented changes in all aspects of society.”12 To limit global warming to 1.5°C
and ensure a more sustainable and equitable society, scientists say that the international community needs to reduce global
GHG emissions by 45% by 2030. It’s a massive challenge, but we can’t afford to fail.
For some decades, car manufacturers have claimed to understand the grave threat posed by climate change. They have
displayed many alternative greener vehicles at motor shows, attracting much positive media coverage. Their advertising
stresses their huge concern for our wellbeing and safety, especially that of our children. However, their business decisions
tell a very different story.
This report looks at the climate impacts of 12 of the world’s leading car manufacturers providing new calculations showing
the carbon footprint for which they were responsible in 2017 and 2018. It demonstrates how they have repeatedly failed to
respond appropriately to the climate emergency, and reviews the lack of progress made across five major markets: the USA,
the EU, China, Japan, and South Korea. It sets out our demands for the industry to change radically or be consigned to history.
It has been nearly four years since the signing of the Paris Agreement, and the transition to a climate-friendly transport
system emerged as an important priority. Carmakers must phase out all cars with an ICE urgently. This will also bring other
benefits, such as less traffic congestion and improved air quality. But the car industry’s inaction is robbing us of that greener,
cleaner and more survivable future.13
11.
Greta Thunberg’s speech at Davos shows that if anyone is going to save the world, it’s Generation Z, The Independent, 25 January 2019
https://www.independent.co.uk/voices/davos-greta-thunberg-climate-change-global-warming-a8746536.html
12.
Summary for Policymakers of IPCC Special Report on Global Warming of 1.5°C approved by governments, IPCC Press Release, 8 October 2018,
https://www.ipcc.ch/2018/10/08/summary-for-policymakers-of-ipcc-special-report-on-global-warming-of-1-5c-approved-by-governments/
13.
Freedom to Breathe: Rethinking urban transport, Greenpeace, 2018
https://storage.googleapis.com/planet4-international-stateless/2018/01/1b96c158-air_pollution-transport_report-2018.pdfCRASHING THE CLIMATE: HOW THE CAR INDUSTRY IS DRIVING THE CLIMATE CRISIS 7
CHAPTER 2: HOW TRANSPORT IS THREATENING OUR CLIMATE
ROAD TRANSPORT IN THE GLOBAL CONTEXT
According to the International Energy Agency (IEA), CO2 emissions from the global transport sector were around 8 gigatons
(Gt) — a quarter of the total in 2016.14 Road transport, which consists of cars, trucks and buses, accounted for 74% of global
transport CO2 emissions, and 18% of total global CO2 emissions in 2016.15
The most recent publicly available data from the IEA (released in 2018) shows that transport emissions grew by 2% in 2016, a
similar amount to previous years.16 Calculations17 by the Global Carbon Project (GCP) released in December 2018 suggest that
the trend has continued, with cars, trucks and planes being part of the reason emissions continued to rise globally in 2018.18
The scale of emissions and the speed of their growth means it’s critical that road transport emissions are tackled without delay.
According to the latest statistics from the IEA, CO2 emissions from road transport increased by 71% between 1990 and 2016.19
FIGURE 1: GLOBAL TRANSPORT CO2 EMISSIONS BY TRANSPORT TYPE (UNIT: GT CO2)
Global transport CO2 emission by transport type (in GtCO2)
8.0
6.0
5.9
4.0
3.3
2.0
0.0
1990 2016
Others Marine Aviation Road
Source:CO2 Emissions Statistics: CO2 emissions from fuel combustion 2018 overview, International Energy Agency, 201820
14.
CO2 Emissions Statistics: CO2 emissions from fuel combustion 2018 overview, International Energy Agency, 2018 https://www.iea.org/statistics/co2emissions/
15.
Ibid.
16.
CO2 Emissions From Fuel Combustion Highlights (2018 edition), International Energy Agency, November 2018, p.10
https://webstore.iea.org/download/direct/2373?fileName=CO2_Emissions_from_Fuel_Combustion_2018_Highlights.pdf
17.
Global Carbon Budget 2018, Earth System Science Data, 5 December 2018, https://www.earth-syst-sci-data.net/10/2141/2018/
18.
Cars and coal help drive ‘strong’ CO2 rise in 2018, BBC, 5 December 2018, https://www.bbc.co.uk/news/science-environment-46447459
19.
CO2 Emissions Statistics: CO2 emissions from fuel combustion 2018 overview, International Energy Agency, 2018 https://www.iea.org/statistics/co2emissions/
20.
Ibid.CRASHING THE CLIMATE: HOW THE CAR INDUSTRY IS DRIVING THE CLIMATE CRISIS 8
TRANSPORT EMISSIONS BY COUNTRY/REGION
Transport emissions, and the proportion of overall emissions they represent, tend to be higher in countries where car culture is
most entrenched. Emissions from transport have become the biggest source of CO2 emissions in the US 21 and some EU member
states, such as the United Kingdom.22
This report focuses on five of the biggest car markets in the world, which are also home to all the major global carmakers.
UNITED STATES
• Transport as a percent of total country emissions: 29% 23
• Cars (sedans, SUVs and pickup trucks) account for around 59% of transport GHG emissions.24
• Transport emissions per capita is 5.39t-CO2, which is nearly five times higher than the G20 average of 1.13tCo2/capita.25
EUROPE
• Transport as a percent of total emissions: 24% 26
• 73% of GHG emissions from road transport come from cars and vans.27
• GHG emissions from the transport sector have increased over the last three years, while average CO2 emissions of new passenger cars
increased for the first time in 2017. 28
CHINA
• Transport as a percent of total country emissions: 9% 29
• Transport emissions account for a relatively small percentage of total emissions. However, the scale and growth rate in the past five
years was up to 21%, the second-highest growth rate among G20 countries.30
• In 2018, 28 million cars were sold in China, most powered by petrol or diesel engines.31 According to Germany’s nonprofit Center for
Solar Energy and Hydrogen Research Baden-Württemberg (ZSW), 1.2 million of the cars sold in 2018 were EVs and plug-in hybrid
electric vehicles (PHEVs).32
SOUTH KOREA
• Transport as a percent of total country emissions: 16%33
• Road transport accounted for around 90% of transportation GHG emissions.34
• The emissions from transport have increased over the last three years by 2.3% annually.35 Transport emissions per capita are
2.04t-CO2, nearly twice the G20 average of 1.13tCo2/capita.36
JAPAN
• Transport as a percent of total country emissions: 19% 37
• Emissions from road transport, largely cars, trucks and buses, account for around 87% of transport sector emissions, and about half
of these emissions were produced by private cars.38
21.
Transport now biggest source of US climate emissions, Transport and Environment, 10 January 2018, https://www.transportenvironment.org/news/transport-now-biggest-source-us-climate-emissions
22.
Transport becomes most polluting UK sector as greenhouse gas emissions drop overall, Independent, 6 February 2018
https://www.independent.co.uk/environment/air-pollution-uk-transport-most-polluting-sector-greenhouse-gas-emissions-drop-carbon-dioxide-a8196866.html
23.
Sources of Greenhouse Gas Emissions, US Environmental Protection Agency website https://www.epa.gov/ghgemissions/sources-greenhouse-gas-emissions
24.
Inventory of U.S. Greenhouse Gas Emissions and Sinks: 1990-2017 – Trends, US Environmental Protection Agency, 2019, p29.
https://www.epa.gov/sites/production/files/2019-04/documents/us-ghg-inventory-2019-chapter-2-trends.pdf
25.
Brown To Green: The G20 Transition to a Low-Carbon Economy 2018, Country Facts United States, Climate Transparency, 2018
https://www.climate-transparency.org/wp-content/uploads/2019/01/BROWN-TO-GREEN_2018_USA_FINAL.pdf
26.
Jacob Teter, Transport: Tracking Clean Energy Progress, IEA, 28 May 2019 https://www.iea.org/tcep/transport/
27.
Infographic—Cutting CO2 road transport emissions, Council of the European Union https://www.consilium.europa.eu/en/infographics/greenhouse-gas-emissions/
28.
Progress of EU transport sector towards its environment and climate objectives, European Environment Agency, 17 January 2019 https://www.eea.europa.eu/themes/transport/term/term-briefing-2018
29.
Brown To Green: The G20 Transition to a Low-Carbon Economy 2018, Country Facts China, Climate Transparency, 2018 https://www.climate-transparency.org/wp-content/uploads/2018/11/ChinaprofileChinese.pdf
30.
Brown To Green: The G20 Transition to a Low-Carbon Economy 2018, Climate Transparency, 2018, p21 https://www.climate-transparency.org/wp-content/uploads/2019/01/2018-BROWN-TO-GREEN-REPORT-FINAL.pdf
31.
Robert Ferris, China annual auto sales fall for first time in about two decades with more pain on the way, CNBC, 3 January 2019
https://www.cnbc.com/2019/01/03/china-annual-auto-sales-fall-for-first-time-in-about-two-decades.html
32.
Echo Huang, China buys one out of every two electric vehicles sold globally, Quartz, 18 February 2019 https://qz.com/1552991/china-buys-one-out-of-every-two-electric-vehicles-sold-globally/
33.
Brown To Green: The G20 Transition to a Low-Carbon Economy 2018, Country Facts South Korea, Climate Transparency, 2018
https://www.climate-transparency.org/wp-content/uploads/2019/01/BROWN-TO-GREEN_2018_South_Korea_FINAL.pdf
34.
Annual emissions data. KOTEMS(Korea Transport Emission Management System)
https://www.kotems.or.kr/app/kotems/forward?pageUrl=/kotems/ptl/emissionstat/total/KotemsPtlEmissionstatTotalEmissionLs&topmenu1=02&topmenu2=01&topmenu3=02
35.
Annual emissions data. KOTEMS(Korea Transport Emission Management System)
https://www.kotems.or.kr/app/kotems/forward?pageUrl=/kotems/ptl/emissionstat/total/KotemsPtlEmissionstatTotalEmissionLs&topmenu1=02&topmenu2=01&topmenu3=02
36.
Brown To Green: The G20 Transition to a Low-Carbon Economy 2018, Country Facts South Korea, Climate Transparency, 2018
https://www.climate-transparency.org/wp-content/uploads/2019/01/BROWN-TO-GREEN_2018_South_Korea_FINAL.pdf
37.
Brown To Green: The G20 Transition to a Low-Carbon Economy 2018, Country Facts Japan, Climate Transparency, 2018
https://www.climate-transparency.org/wp-content/uploads/2019/01/BROWN-TO-GREEN_2018_Japan_FINAL.pdf
38.
Transport in Japan, Foundation for Promoting Personal Mobility and Ecological Transportation, 2018, p10 http://www.ecomo.or.jp/english/pdf/tej2018.pdCRASHING THE CLIMATE: HOW THE CAR INDUSTRY IS DRIVING THE CLIMATE CRISIS 9
CHAPTER 3: THE CAR INDUSTRY’S CARBON FOOTPRINT
This report provides new calculations for the industry’s carbon footprint, using data from 2017 and 2018 for the 12 largest
car manufacturers.
HOW ANNUAL CARBON FOOTPRINTS ARE CALCULATED
The annual carbon footprint of a carmaker is the sum of the lifecycle GHG emissions of the cars it sells in a given year. The
lifecycle emissions of a car are made up of:
• The GHG emissions caused through the production of the car
• The tailpipe emissions caused by fuel consumption during its life
• The emissions caused through supplying this fuel
• The emissions caused through recycling at the end of its life.
Not all of the emissions occur in the production year, but putting these cars on the road means their future emissions have been
locked into the system.39
TABLE 2: GHG EMISSIONS OVER THE LIFETIME OF AN AVERAGE VW GROUP CAR 40
PRODUCTION USE PHASE END OF LIFE
Fuel OVERALL
Supply chain Production Fuel supply Recycling
consumption
5.7t CO2e 0.8t CO2e 5.5t CO2e 29.0t CO2e 2.7t CO2e 43.7t CO2e41
CARBON EMISSIONS DURING PRODUCTION AND RECYCLING
Production carbon emissions are mainly determined by the amount and type of materials used — the bigger the car the higher the
emissions. The Institut für Energie und Umweltforschung (IFEU) estimates that production and recycling emissions are 6t carbon
dioxide equivalent (CO2e)42 for a petrol-fuelled subcompact car, 7.1t CO2e for a compact car, and 9.9t CO2e for a premium vehicle.43
Data availability is limited as lifecycle assessments are done by manufacturers for individual models but not published systemati-
cally. Manufacturers rarely provide average numbers for their entire production. A recent exception has been VW, which provides data
for carbon emissions over the lifetime of an average VW Group car (see table 4). According to VW estimates, 6.5t of CO2e are emitted
during the production of an average VW group car — 15 % of the emissions it will cause over its lifetime. Most of this comes from the
supply chain, with only 12% emitted by the VW Group directly. Recycling adds another 2.7t CO2e bringing production and recycling
emissions for an average VW group car to 9.2t CO2e.
39.
The carbon footprint as it has been calculated here differs from the 2018 emissions of all the cars on the road from a specific manufacturer in that year.
Estimates of this are much more difficult to make as data on how many cars from a specific manufacturer are on the road and which fleet emissions they have is
not available. The total of that calculation would likely be higher as the carbon footprint calculated in this report because fleet emissions have improved over the
years. But most importantly what we analyse here focuses on the problems car manufacturers create with their current sales.
40.
Keynotes ID. INSIGHTS Sustainable E-Mobility, Volkswagen Newsroom, 15 February 2019, p5
https:/www.volkswagen-newsroom.com/de/publikationen/weitere/keynotes-id-insights-sustainable-e-mobility-169
41.
VW calculates the emissions during the use phase of their vehicles based on results from official cycles test. Cycle test results however significantly underestimate on-road
emissions (see chapter 4). We adjusted for that difference in our carbon footprint calculation. As a result, VW’s average lifetime emissions per vehicle increase by 23%.
42.
A variety of greenhouse gases with varying global warming potential are emitted during the production of a car. To be able to give a single value for all , gases other
than CO2 are converted into CO2 equivalents.
43.
IFEU as cited in Ökobilanz gängiger Antriebstechniken, ADAC, 2019,
https://www.adac.de/infotestrat/umwelt-und-innovation/abgas/oekobilanz/default.aspx?ComponentId=317354&SourcePageId=47733CRASHING THE CLIMATE: HOW THE CAR INDUSTRY IS DRIVING THE CLIMATE CRISIS 10
In addition to vehicle size, the share of renewable energy used for production and the overall energy and carbon efficiency of
parts of the production process determine how much GHG is emitted. Some manufacturers have set renewable energy goals for
their factories. But as inhouse emissions only account for a small proportion of overall production emissions, and an even smaller
fraction of lifecycle emissions for fleets dominated by ICE vehicles, these goals have little effect on their footprints.
TABLE 3: CARBON FOOTPRINT DURING PRODUCTION: BATTERY ELECTRIC VEHICLES (BEV) VS
COMPARABLE ICE MODELS
SUBCOMPACT ICE 6t CO2e
SUBCOMPACT BEV 6t + 3.2t for a 22kw/h battery = 9.2t CO2e
(eg Renault Zoe)
5t + 9.2t for a 41 kw/h battery = 15.2t CO2e
PREMIUM ICE 9.9t CO2e
PREMIUM BEV (eg TESLA MODEL S “LONG RANGE”) 9.9t + 14.5t for a 100kw/h battery = 24.4t CO2e
BATTERY ELECTRIC VEHICLES AND PRODUCTION EMISSIONS
BEVs have a larger carbon footprint during production than comparable ICE vehicles. (See table 4) According to IFEU
apart from the battery, the production footprint of a BEV is roughly similar to an ICE vehicle. But battery production is energy
intensive (80% of production emissions of a battery) and process emissions (20% of production emissions) also occur, driving up
production emissions significantly.44 Process emissions stem from the chemical reactions during a production process, such as
the reduction of iron ore to steel in a conventional blast furnace. Think tanks Agora Verkerswende and IFEU estimate that during
current battery production an average of 145kg of CO2e occurs per kw/h of battery capacity, although there is potential to reduce
this significantly.45 Therefore, a 100 kw/h battery, as included in a Tesla Model S “Long Range”, adds 14.5t of CO2e emissions,46
more than doubling the production footprint compared to a similar ICE model. Hence, to limit GHG emissions when transitioning to
large scale BEV production two aspects become crucial: a fully renewable energy supply for the production process, and a focus
on lighter vehicles that require smaller batteries.
For detailed demands on how manufacturers need to make BEV’s climate-friendly see chapter 7.
44.
Klimabilanz von Elektroautos. Einflussfaktoren und Verbesserungspotenzial., Agora Verkehrswende, 2019, p. 45, https://www.agora-verkehrswende.de/filead-
min/Projekte/2018/Klimabilanz_von_Elektroautos/Agora-Verkehrswende_22_Klimabilanz-von-Elektroautos_WEB.pdf
45.
Ibid., p42.
46.
The Tesla Model S “Long Range” is used to illustrate this as it is a popular model with a large battery. As Tesla is in the process of switching to 100% renewable
electricity supply in its battery factory, the carbon footprint of their 100 kw/h batteries can be expected to be lower than IFEU’s estimate of the industry average. Tesla
Gigafactory To Be Powered 100% By “Tesla Solar” By End Of 2019, Clean Technica, 27 August 2018
https://cleantechnica.com/2018/08/27/tesla-gigafactory-to-be-powered-100-by-tesla-solar-by-end-of-2019/CRASHING THE CLIMATE: HOW THE CAR INDUSTRY IS DRIVING THE CLIMATE CRISIS 11
TAILPIPE CARBON EMISSIONS
Tailpipe emissions make up the vast majority of a car’s lifecycle carbon emissions. Emissions are largely determined by the
type of engine, fuel efficiency, and distance driven over its lifetime. The latter can vary drastically — estimates about the
average distance range from 190,000 to 230,000km.47 48
ICE cars and hybrids produce tailpipe carbon emissions, whilst BEVs or a fuel cell electric vehicles do not. If a car is fuelled by
renewable electricity,49 or hydrogen produced through electrolysis powered by renewable electricity,50 the car can be operated
with no fuel-related carbon emissions.
Fuel efficiency is mainly determined by a car’s weight and the power of its engine. Both weight and engine power have increased over
the years, cancelling out efficiency gains made in engine technology. The fuel efficiency of an individual car is also affected by whether
it’s most often used in urban areas or on highways, and how fast it’s driven. With plug-in hybrids, usage patterns (including how often
the car is charged) have an even bigger effect on fuel efficiency than in the case of conventional ICE cars (see chapter 5).
EMISSIONS CAUSED BY FUEL SUPPLY
Supply, or ‘upstream’ fuel emissions — sometimes also referred to as well-to-tank emissions — stem from oil exploration,
refining of diesel and petrol, and its distribution. For Europe, analysts estimate average upstream emissions to be 14g of CO2e
per megajoule (MJ) for petrol and 15g of CO2e per MJ for diesel.51 For petrol, this translates into 452g CO2e per litre, an additional
19.4% over the 2,330g CO2 released from the combustion of a litre of petrol. For diesel, this translates into upstream emissions
of 561g CO2e per litre, an additional 21.3% over the 2,640g of CO2 released from the combustion of a litre of diesel.
To sum up, apart from the distance a car is driven, design decisions made by car manufacturers are the main factors that
determine how much GHGs vehicles emit during their lifecycle. Manufacturers can choose to promote small, efficient cars or
large SUVs; to build cars around 300 horsepower diesel engines or efficient electric engines. However, most of the cars they are
marketing are not climate-friendly. SUVs are becoming more common (see chapter 6) and engine sizes are increasing, while
electric alternatives are scarce.
47.
John L. Sullivan et al., Life Cycle Inventory of a Generic U.S. Family Sedan Overview of Results USCAR AMP Project, JSTOR, 1998, pp. 1909-1923
https://www.jstor.org/stable/44741137?seq=1#page_scan_tab_contents
48.
Maarten Messagie et al., A Range-Based Vehicle Life Cycle Assessment Incorporating Variability in the Environmental Assessment of Different Vehicle
Technologies and Fuels, MDPI, 2014 https://www.mdpi.com/1996-1073/7/3/1467/htm
49.
While individuals and fleet operators might power their BEVs with 100% renewable electricity, this is not yet the norm. But research from the International
Council on Clean Transportation (ICCT) for Europe has shown that even when taking the standard electricity mix and production into account, BEVs are already are
more climate friendly in most member states than comparable petrol or diesel cars. Effects of battery manufacturing on electric vehicle life-cycle greenhouse
gas emissions, The ICCT Briefing, February 2018 https://theicct.org/sites/default/files/publications/EV-life-cycle-GHG_ICCT-Briefing_09022018_vF.pdf
50.
Today most of the hydrogen is not yet produced through electrolysis but through steam reforming of fossil methane. As long as they are powered with fossil
hydrogen, fuel cell electric vehicles cannot provide the needed emissions reductions.
51.
Edwards et al., WELL-TO-TANK Report Version 4.a, European Commission, 2014, p.84
www.publications.jrc.ec.europa.eu/repository/bitstream/JRC85326/wtt_report_v4a_april2014_pubsy.pdfCRASHING THE CLIMATE: HOW THE CAR INDUSTRY IS DRIVING THE CLIMATE CRISIS 12 THE FINDINGS: HOW CAR COMPANIES ARE CRASHING THE CLIMATE In 2018, VW was the biggest climate culprit among the world’s carmakers with a carbon footprint of 582m tons CO2e resulting from the cars it produced in 2018 and the emissions caused by them over their lifetime. Renault-Nissan (577m tons CO2e) and Toyota (562m tons CO2e) came close. For comparison, the carbon footprints caused by these carmakers are greater than the total annual GHG emissions of Australia (535m tons CO2e).52 53 GM’s footprint (530m tons CO2e) exceeds that of the United Kingdom (465m tons CO2e) and even Hyundai-Kia’s footprint (401m tons CO2e), the fifth largest, still exceeds the total annual emissions of Poland (379m tons CO2e). German manufacturers VW, Daimler and BMW had a combined carbon footprint of 878m tons in 2018, exceeding the 2018 GHG emissions of Germany (866m tons CO2e).54 In total, the 12 manufacturers analysed here are responsible for 4.3 gigatons (Gt) of CO2e. Extrapolating from this, the entire industry with the 86 million cars it sold in 201855 is estimated to be responsible for a combined carbon footprint of 4.8 Gt CO2e, equal to 9% of total annual global GHG emissions including emissions from land-use change.56 57 For comparison, the US, the world’s second largest carbon emitter after China, put 5.7 Gt CO2e into the atmosphere, while the EU emitted 4.1 Gt CO2e. Compared to 2017, the carbon footprint of the industry shrank by only 1% in 2018. This corresponds to a similar drop in the combined sales of these 12 manufacturers. Ford’s sales fell by 10%, resulting in a similar decrease in its carbon footprint. For other manufacturers, such as Hyundai-Kia, Daimler and BMW, modest improvements in average fleet emissions were cancelled out by rising sales. With 7%, General Motors (GM) saw a significant spike in its average fleet emissions, mainly due to selling Opel and Vauxhall, brands with smaller, more fuel-efficient models relative to the rest of GM’s portfolio, to Groupe Peugeot Société Anonyme (PSA). US manufacturers Ford, GM and Fiat-Chrysler-Automobiles (FCA) have the highest per-vehicle carbon footprint. This comes as no surprise as SUVs and pickup trucks dominate sales in the US more than anywhere else in the world. In 2018, the top-selling car models in the US were the Ford F-Series, the Chevrolet Silverado (General Motors) and the Dodge RAM (FCA), all three of them giant, gas-guzzling pickups.58 The high share of SUV and pickup sales drive up overall fleet emissions in the US, and the fleet emissions of manufacturers whose US sales make up a large portion of their overall production. 52 Global Annex-I map, UNFCCC 2019, https://di.unfccc.int/global_map 53 Apart from GHG emissions data for Germany, for which 2018 data was available, all country GHG data is from 2017, the most recent year for which country data has been published by the UNFCCC. 54 Klimabilanz 2018: 4,5 Prozent weniger Treibhausgasemissionen, Umweltbundesamt, 2019, https://www.umweltbundesamt.de/presse/pressemitteilungen/klimabilanz-2018-45-prozent-weniger 55 Global car market remains stable during 2018, as continuous demand for SUVs offsets decline in sales of Compact cars and MPVs, JATO, 21 February 2019 https://www.jato.com/global-car-market-remains-stable-during-2018-as-continuous-demand-for-suvs-offsets-decline-in-sales-of-compact-cars-and-mpvs 56 Emissions Gap report 2018, UNEP, published on 5 December 2018 https://www.ipcc.ch/site/assets/uploads/2018/12/UNEP-1.pdf 57 These are total global greenhouse gas emissions of 2017, the most recent year data is available for. 58 USA best selling cars in 2018, Focus2Move, 18 January 2019 https://focus2move.com/usa-best-selling-cars-2018/
CRASHING THE CLIMATE: HOW THE CAR INDUSTRY IS DRIVING THE CLIMATE CRISIS                                         13

   TABLE 4: CAR COMPANIES 2018 CARBON FOOTPRINTS
                                                                           AVERAGE LIFETIME      AVERAGE FLEET
                                      EMISSIONS IN
       CAR MANUFACTURER                                  VEHICLES SOLD   EMISSIONS PER VEHICLE     EMISSIONS
                                  MILLION TONS OF CO2E
                                                                            IN TONS OF CO2E       CO2 IN G/KM
             VW Group                     582                10.8                 53.8               192.7
      Renault-Nissan Alliance             577                10.3                 55.7               196.6
              Toyota                      562                10.4                 53.8               180.8
          General Motors                  530                 8.6                 61.3               217.9
           Hyundai-Kia                    401                 7.4                 54.0               186.3
         Ford Motor Corp                  346                 5.6                 61.4               210.6
               F.C.A                      305                 4.8                 63.1               220.5
              Honda                       283                 5.2                 54.1               185.0
       PSA Group (incl Opel)              201                 4.1                 49.2               176.3
              Suzuki                      164                 3.3                 49.6               168.8
            Daimler AG                    161                 2.7                 58.7               212.0
             BMW AG                       136                 2.5                 54.4               192.3
     Top 12 car manufacturers            4246                76.0                 55.9               195.0
                                                                             Share of global
           Car industry                  4807                 86                                      9%
                                                                             GHG emissions

   TABLE 5: CAR COMPANIES 2017 CARBON FOOTPRINTS
                                                                           AVERAGE LIFETIME      AVERAGE FLEET
                                      EMISSIONS IN
       CAR MANUFACTURER                                  VEHICLES SOLD   EMISSIONS PER VEHICLE     EMISSIONS
                                  MILLION TONS OF CO2E
                                                                            IN TONS OF CO2E       CO2 IN G/KM
             VW Group                     575                10.6                 54.3               191.6
      Renault-Nissan Alliance             571                10.3                 55.7               196.9
              Toyota                      569                10.3                 55.2               185.9
     General Motors (incl Opel)           540                 9.0                 60.0               203.8
           Hyundai-Kia                    399                 7.3                 54.6               188.6
         Ford Motor Corp                  385                 6.3                 61.3               211.4
               F.C.A                      308                 4.8                 63.7               223.1
              Honda                       289                 5.3                 54.8               187.4
            PSA Group                     210                 4.2                 49.5               176.5
              Suzuki                      159                 3.2                 50.0               170.5
            Daimler AG                    158                 2.7                 58.3               212.4
             BMW AG                       133                 2.5                 54.1               193.7
     Top 12 car manufacturers            4296                76.5                 56.2               195.1
                                                                             Share of global
           Car industry                  4857                86.4                                    9.1%
                                                                             GHG emissions
CRASHING THE CLIMATE: HOW THE CAR INDUSTRY IS DRIVING THE CLIMATE CRISIS 14
How we calculated carmakers’ carbon footprints
Calculating car manufacturers’ carbon footprints is not without challenges. Apart from a few exceptions, they have
not been transparent or given much detail about their impact on the climate. In some cases they probably don’t even
have a good overview themselves.
The calculation (see figure 2) was done using the following data: fleet emissions data in China, the EU and the US;
sales data for these three markets; global sales data; data on production emissions. We used government data
where possible, other data sources where necessary and worked with proxies when comparable data was not
available. Apart from a few exceptions, car manufacturers are not transparent about their own emissions data
or give much detail about their impact on the climate. This is something that must change moving forward.
FIGURE 2: CARBON FOOTPRINT CALCULATION
A Car Manufacturer’s Carbon Footprint
=
Tailpipe Upstream Production
Emissions Emissions & Recycling
Emissions
(EU Sales X av. EU fleet emiss. X EU cycle deviation adjust.)
+
(US Sales X av. US fleet emiss. X US cycle deviation adjust.)
+
(China Sales X av. China fleet emiss. X Chin. cycle deviation adjust.) Global Sales
+
(Global Sales – EU sales – US sales – China sales) X 200.000km x 1.2 + X
x
(av. EU fleet em. X EU cycle deviation adjust.)
6.5t
+ (production emissions)
(av. US fleet em. X US cycle deviation adjust.) /3 +
+ 2.8t
(recycling emissions)
(av. China fleet em. x China cycle deviation adjust.)CRASHING THE CLIMATE: HOW THE CAR INDUSTRY IS DRIVING THE CLIMATE CRISIS 15
Emissions data for the US market was provided by the Environmental Protection Agency (EPA), which provides
timelines for the manufacturers from 1975 to 2018.59 In the case of the EU and China, official sources provided
emissions and sales data for each model sold on the respective markets, from which we needed to compute the
manufacturers’ fleet averages.60
CO2 emissions data is based on the standardised test cycles that manufacturers must use to certify each model.
Countries use different test cycles and these vary in their ability to model the fuel efficiency and CO2 emissions of
the cars on the road. The New European Driving Cycle (NEDC) used in Europe 61 and China significantly underestimates
a car’s carbon emissions under real-world conditions. However, the EPA’s test cycle used in the US is accurate (even
overestimating emissions by 1%), so we needed to correct for these deviations to get comparable figures. We used the
average deviations identified by the International Energy Agency (IEA) and the International Council on Clean Transpor-
tation (ICCT) for the cars sold in these three markets as a correction factor: EU +39%, China +37%, USA -1%.62 To account
for sales in markets beyond China, the EU and the US, for which emissions data was not available, the average of each
manufacturer’s available fleet emissions data was used as a proxy. Upstream emissions have a linear relationship to
the amount of fuel consumed and hence the tailpipe emissions. Based on the estimates by Edwards et al.,63 we
assumed a 20% increase over tailpipe emissions.
Sales data for this analysis comes from Focus2move.com (for global sales) and Carsalesbase.com (for sales in key
markets). The sales of the 12 car companies covered accounted for 88% of global car sales in 2018.
The emissions data available for 2018 for the 12 manufacturers covers 60% of their global sales. This varies from
manufacturer to manufacturer, between 78% (VW) and 19% (Suzuki) of sales. The median for data availability is 67%. As
the Japanese government does not publish fleet emissions data for the Japanese market, data availability for Japanese
manufacturers, with a high share of their global sales in Japan, is scant. As Suzuki additionally sells many vehicles in
India for which no data is available, data availability for Suzuki is the lowest. The Korean government only disclosed group
specific data for 2017 for five domestic groups and has not disclosed any data for 2018. To ensure comparability, specific
data for the Korean market had to be excluded limiting availability of fleet emissions data for Hyundai-Kia to only 47% of
their global sales.
Comparable data on production and recycling emissions is even harder to find than for fuel consumption and tailpipe
emissions. As there was not enough data available to make precise distinctions between manufacturers, we used 6.5
tons of CO2e as a proxy for production and 2.7 tons of CO2e as a proxy for recycling. These correspond to the figures
provided by the VW Group, a useful proxy as it combines both volume and premium brands. This comes with a caveat:
production emissions from manufacturers that focus on the premium segment, such as Daimler and BMW, or that
have a high share of SUVs and pickup trucks, tend to be slightly underrepresented, while the production emissions
of manufacturers that sell fewer SUVs or premium cars are slightly overrepresented.
The resulting carbon footprint covers the car branch of these corporates. Some of the companies also have
subsidiaries that are for example producing trucks and buses (e.g. VW and Daimler). The climate impact of that
part of their business has not been considered in this analysis.
59.
2018 EPA Automotive Trends Report Supplemental Table K: Estimated Real-World Fuel Economy Data Stratified by Manufacturer and Vehicle Type, EPA, 2019
https://www.epa.gov/sites/production/files/2019-06/420r19002-supp-table-k-v2.xlsx
60.
Monitoring of CO2 emissions from passenger cars - Data 2018 - Provisional data, EEA, 2019 http://ftp.eea.europa.eu/www/co2/CO2_passenger_cars_v17_csv.zip
61.
From September 2018, the NEDC will be replaced in the EU by the Worldwide Harmonized Light Vehicles Test Procedure (WLTP). WLTP is expected to reduce the gap between test results and average
real-life emissions. However, as in 2018 vehicles certified according to WLTP only made up 29% of sales and the rest had still been certified according to the NEDC, used the IEA’s and ICCT’s estimates
2017. CO2 emissions from new passenger cars in the European Union: Car manufacturers’ performance in 2018, ICCT, 2019
https://theicct.org/sites/default/files/publications/ICCT_CO2_emissions_pv_EU_2018_20190806.pdf
62.
Fuel economy in major car markets: Technology and policy drivers, 2005-2017, IEA and ICCT, 2019, p. 76-80 https://theicct.org/sites/default/files/publications/GFEI_WP19_Final_V3_Web.pdf
63.
Edwards et al., WELL-TO-TANK Report Version 4.a, European Commission, 2014, p. 84 http://publications.jrc.ec.europa.eu/repository/bitstream/JRC85326/wtt_report_v4a_april2014_pubsy.pdfCRASHING THE CLIMATE: HOW THE CAR INDUSTRY IS DRIVING THE CLIMATE CRISIS 16
CHAPTER 4: HOW THE CAR INDUSTRY IS FAILING TO RESPOND
TO THE CLIMATE CRISIS
“Preventing irreversible climate disruption is the race of our lives and for our lives […] We need rapid
and deep change in how we do business, generate power, build cities and feed the world. And – having
endured what is possibly the hottest month in recorded history – we need action now.”
—UN Secretary-General António Guterres, 1 Aug 2019 64
In 2014, the IPCC 65 set out how GHG emissions from passenger and freight transport could be reduced through avoiding
unnecessary journeys; switching to greener modes of travel, such as cycling and public transport; improvements that lower
the energy intensity of vehicles and engines; switching to lower carbon fuels, such as electricity from renewable sources.
But these changes are not happening fast enough and, five years on, global emissions from this sector are growing, not falling.66 67
We are heading for a catastrophe and all the while the car industry is still failing to plan for a phasing-out of ICE cars, lobbying
against strong climate regulation, failing to market battery electric vehicles sufficiently or shared vehicles at all.
FAILURE TO SPEED UP TRANSITION
Given the urgent need to achieve the 1.5°C global warming target, Greenpeace believes car manufacturers must step up to the
challenge. The priority is to phase-out diesel and petrol cars. A Greenpeace commissioned study by the German Aerospace Centre
in 2018 found that to achieve the target, the European passenger car sector needs to phase-out the sale of fossil-fuelled cars,
including conventional hybrids, with the last ICE cars coming off the production lines in 2028.68 While there are no comparable
assessments for other regions, the European date provides a good benchmark for companies. The impacts of climate change
are already devastating lives, and we must leave the ICE behind within the next decade.
There must also be a large reduction in cars on the road and a greater uptake of greener modes of transport. These changes
will mean that the only car manufacturers surviving into the future will be those that can make this transition and diversify
their business quickly.69 However, there appears to be little will among carmakers to change and take urgent action.
While some companies have announced moves towards electrification, these moves will not transform the industry within the
required timescale (see chapter 5). For example, at the end of 2018 Volkswagen publicly announced it will bring its last ICE
platform to market in 2026 and phase out ICE production by 2040.70 In 2019, Daimler announced it would be carbon neutral by
2039, but without giving a date by which it would phase out ICEs.71 Other corporate announcements are limited to partial plans
to expand EV models, including hybrids, by the mid-2020s, or stop selling diesel vehicles in some markets.
64.
Opening remarks at press encounter at UN Headquarters, United Nations Secretary-General, 1 August 2019
https://www.un.org/sg/en/content/sg/speeches/2019-08-01/remarks-press-encounter-un-headquarters
65.
Paraphrasing Climate Change 2014 Mitigation of Climate Change Working Group III Contribution to the Fifth Assessment Report of the Intergovernmental Panel on Climate
Change, Chapter 8: Transport, IPCC, p. 603 https://www.ipcc.ch/site/assets/uploads/2018/02/ipcc_wg3_ar5_full.pdf
66.
Cars and coal help drive ‘strong’ CO2 rise in 2018, BBC, 5 December 2018 https://www.bbc.co.uk/news/science-environment-46447459
67.
Global Carbon Budget 2018, Earth System Science Data, 5 December 2018, https://www.earth-syst-sci-data.net/10/2141/2018/
68.
Development of the car fleet in EU28+2 to achieve the Paris Agreement target to limit global warming to 1.5°C, Greenpeace, 20 September 2018
http://www.greenpeace.org/archive-belgium/Global/belgium/report/2018/20180907_GP_EUCarFleet_1.5.pdf
69.
See Chapter 6 for more detail on what the industry must do.
70.
Dr. Herbert Diess, Leading the Transformation, Volkswagen, 2019
https://www.volkswagenag.com/presence/investorrelation/publications/presentations/2019/03_march/1_CMD_Diess.pdf
71.
“Ambition2039”: Our path to sustainable mobility, Daimler website
https://media.daimler.com/marsMediaSite/en/instance/ko/Ambition2039-Our-path-to-sustainable-mobility.xhtml?oid=43348842CRASHING THE CLIMATE: HOW THE CAR INDUSTRY IS DRIVING THE CLIMATE CRISIS 17
TABLE 6: TOP 12 CAR COMPANIES’ ICE PHASE-OUT PLANS
PUBLIC COMMITMENT TO A
2019 SALES RANK NAME NOTE
GLOBAL PHASE OUT OF THE ICE
Start of production of last ICE-platform in 2026.
Will stop selling fossil fuel cars
1 VW Group Carbon neutral by 2050, including vehicle and
by 2040.72
manufacturing supply chain.
Diesel phase-out only in Europe by 2019. Plan to have
2 Toyota Group X
zero CO2 emissions in vehicle lifecycle by 2050.73
Nissan: plans to stop diesel for passenger cars at
Renault-Nissan each model’s renewal in Europe. Limit diesel sales
3 X
Alliance to commercial vehicles in Japan and US 74
Renault: reduce by 50% its diesel offer by 2022. 75
Committed to “all electric future” without a date
4 General Motors X
for ICE phase-out.76
5 Hyundai-Kia X
6 Ford Group X
7 Honda Motor X
Diesel phase-out in its passenger cars sold only in
8 FCA X the EMEA (Europe, Middle East, Africa) market by
2021 (light commercials will remain diesel).77
9 PSA Group X No new diesel engine to be developed.78
10 Daimler AG X Carbon neutral by 2039, in vehicles and factories.79
11 BMW AG X
(Maruti Suzuki India) — phase-out diesel by
12 Suzuki X
April 2020.80
By way of comparison, a number of national governments including the UK, France, and the Netherlands, have announced ICE
phase-out plans with dates.81 Although these announcements have rarely been backed up by legally binding regulations and are
often too late, it has given a strong market signal that there is no future for fossil fuel vehicles.
72.
Christoph Rauwald, Oliver Sachgau, VW Says the Next Generation of Combustion Cars Will Be Its Last, Bloomberg, 4 December 2018
https://www.bloomberg.com/news/articles/2018-12-04/vw-says-the-next-generation-of-combustion-cars-will-be-its-last
73.
What is the Toyota Environmental Challenge 2050?, Toyota website, 29 May 2019 https://blog.toyota.co.uk/toyota-environmental-challenge-2050
74.
Nissan will abandon diesel cars in Europe, Le Point, 7 May 2018
https://www.lepoint.fr/automobile/securite/nissan-va-delaisser-les-voitures-diesel-en-europe-07-05-2018-2216448_657.php
75.
Clémentine Maligorne, Isabelle de Foucaud, Diesel, electric: where is Renault today?, Le Figaro, 6 October 2017
www.lefigaro.fr/economie/le-scan-eco/dessous-chiffres/2017/10/06/29006-20171006ARTFIG00249-diesel-electrique-o-en-est-renault-aujourd-hui.php
76.
Alex Davis, General Motors Is Going All Electric, Wired, 10 July 2017 https://www.wired.com/story/general-motors-electric-cars-plan-gm/
77.
FCA Capital Markets Day, FCA, 1 June 2018 https://www.fcagroup.com/en-US/investors/Pages/capital_markets_day_2018.aspx
78.
Florian Chopin, End of diesel: the PSA Group program, l’Auto-Journal, 28 September 2018 https://news.autojournal.fr/news/1531522/Diesel-PSA-Stratégie-Electrique-Hybride
79.
David Keating, Mercedes-Benz Will Make Entire Car Fleet Carbon-Neutral by 2039, Forbes, 13 May 2019
https://www.forbes.com/sites/davekeating/2019/05/13/mercedes-benz-will-make-entire-car-fleet-carbon-neutral-by-2039/#4bd1642f4bd4
80.
Maruti’s decision to phase out diesel by April 2020 may hasten the end of the road for the fuel, Business Today, 25 April 2019
https://www.businesstoday.in/sectors/auto/maruti-decision-to-phase-out-diesel-by-april-2020-may-hasten-the-end-of-the-road-for-the-fuel/story/340488.html
81.
Greenpeace map to track ICE phase-out, car access restrictions into cities and specific cars bans within city limits. https://www.greenpeace.org/international/act/clean-air-now/You can also read