Host-influenced geochemical signature in the parasitic foraminifera Hyrrokkin sarcophaga
←
→
Page content transcription
If your browser does not render page correctly, please read the page content below
Biogeosciences, 18, 4733–4753, 2021
https://doi.org/10.5194/bg-18-4733-2021
© Author(s) 2021. This work is distributed under
the Creative Commons Attribution 4.0 License.

Host-influenced geochemical signature in the parasitic
foraminifera Hyrrokkin sarcophaga
Nicolai Schleinkofer1,2 , David Evans1,2 , Max Wisshak3 , Janina Vanessa Büscher4,5 , Jens Fiebig1,2 , André Freiwald3 ,
Sven Härter1 , Horst R. Marschall1,2 , Silke Voigt1,2 , and Jacek Raddatz1,2
1 Institut
         für Geowissenschaften, Goethe-Universität Frankfurt, Frankfurt am Main, Germany
2 FrankfurtIsotope and Element Research Center (FIERCE), Goethe-Universität Frankfurt, Frankfurt am Main, Germany
3 Marine Research Department, Senckenberg am Meer, Wilhelmshaven, Germany
4 Department of Earth and Ocean Sciences, National University of Ireland Galway, Galway, Ireland
5 Department of Biological Oceanography, GEOMAR Helmholtz Centre for Ocean Research Kiel, Kiel, Germany

Correspondence: Nicolai Schleinkofer (schleinkofer@em.uni-frankfurt.de)

Received: 23 March 2021 – Discussion started: 29 March 2021
Revised: 9 June 2021 – Accepted: 15 July 2021 – Published: 20 August 2021

Abstract. Hyrrokkin sarcophaga is a parasitic foraminifera          changes in the calcification rate, Rayleigh fractionation or
that is commonly found in cold-water coral reefs where it in-       changing oxygen conditions.
fests the file clam Acesta excavata and the scleractinian coral        While our measurements provide an interesting insight
Desmophyllum pertusum (formerly known as Lophelia per-              into the calcification process of this unusual foraminifera,
tusa). Here, we present measurements of the trace element           these data also indicate that the geochemistry of this para-
and isotopic composition of these parasitic foraminifera, an-       sitic foraminifera is unlikely to be a reliable indicator of pa-
alyzed by inductively coupled optical emission spectrome-           leoenvironmental conditions using Sr / Ca, Mn / Ca, δ 18 O or
try (ICP-OES), electron probe microanalysis (EPMA) and              δ 13 C unless the host organism is known and its geochemical
mass spectrometry (gas-source MS and inductively-coupled-           composition can be accounted for.
plasma MS).
   Our results reveal that the geochemical signature of H. sar-
cophaga depends on the host organism it infests. Sr / Ca ra-
tios are 1.1 mmol mol−1 higher in H. sarcophaga that infest         1   Introduction
D. pertusum, which could be an indication that dissolved host
carbonate material is utilized in shell calcification, given that   The foraminifera are a very diverse group of marine shelly
the aragonite of D. pertusum has a naturally higher Sr con-         organisms that are commonly used for paleoenvironmental
centration compared to the calcite of A. excavata. Similarly,       reconstructions using the isotopic or elemental composition
we measure 3.1 ‰ lower δ 13 C and 0.25 ‰ lower δ 18 O values        of their carbonate shell (Petersen et al., 2018; Hönisch et al.,
in H. sarcophaga that lived on D. pertusum, which might be          2011; Gray and Evans, 2019; Lear and Rosenthal, 2006; Rad-
caused by the direct uptake of the host’s carbonate material        datz et al., 2017). They first appeared in the Cambrian (Cul-
with a more negative isotopic composition or different pH           ver, 1991) and, over the course of the Phanerozoic, occupied
regimes in these foraminifera (pH can exert a control on the        oceanic settings from coastal waters to the open ocean, as
extent of CO2 hydration/hydroxylation) due to the uptake of         well as deep sea benthic habitats (Goldstein, 1999). Multi-
body fluids of the host. We also observe higher Mn / Ca ra-         ple feeding methods are known from foraminifera, including
tios in foraminifera that lived on A. excavata but did not pen-     suspension feeding, grazing, predation and parasitic feeding
etrate the host shell compared to specimen that penetrated the      (Hancock et al., 2015). The latter is probably the least com-
shell, which could be interpreted as a change in food source,       mon feeding mechanism among the foraminifera, with only 9
                                                                    species that are known to be parasitic and a further 13 that are
                                                                    suspected to be (Walker et al., 2017). One of the known par-

Published by Copernicus Publications on behalf of the European Geosciences Union.
4734 N. Schleinkofer et al.: Host-influenced geochemical signature in H. sarcophaga
asitic species is Hyrrokkin sarcophaga (Cedhagen, 1994), a
common foraminifera in cold-water coral reefs in the NE At-
lantic (Beuck et al., 2008). H. sarcophaga preferentially col-
onizes the file clam Acesta excavata but also other organisms
such as the bivalve Delectopecten vitreus; sponges of the
family Geodiidae and Ancorinidae; cold-water corals such as
Desmophyllum pertusum (formerly known as Lophelia per-
tusa; Addamo et al., 2016), Madrepora oculata and Flabel-
lum japonicum; and other foraminifera (Beuck et al., 2008;
Cheng and Dai, 2016; Cedhagen, 1994). Besides biogenic
hard substrates, H. sarcophaga can also be found settling on
rocks, which shows that it can at least survive short periods
without a host (Cedhagen, 1994). H. sarcophaga forms an at-
tachment etching, i.e. mirroring its spiral outline on the host.
From this depression the foraminifera etch a canal into the
shell of the host (Cedhagen, 1994) (Fig. 1). This allows the
foraminifera to feed on the bivalve host’s tissue (Cedhagen,
1994) and possibly assimilate amino acids from its extrapal-
lial calcifying fluid (Schweizer et al., 2012; Alexander and
Delaca, 1987).
The bivalve reacts by building a callus (layered aragonite
rich in organics) to seal this boring (Fig. 1D) and defend the
organism from the parasite’s attack (Beuck et al., 2008). In
D. pertusum, borings into the inner calyx area were not ob-
served (Beuck et al., 2008). Instead, multiple whip-shaped
tunnels protrude into the coral’s skeleton, which possibly
serve an anchoring function (Beuck et al., 2008). The pit is
possibly formed either as a way to protect itself from clean-
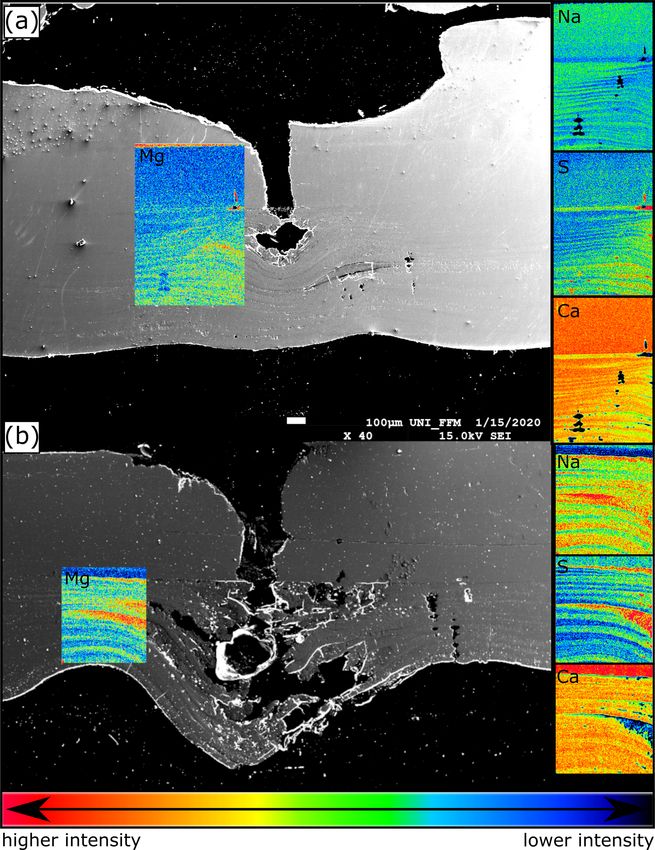
ing attempts of the host and increase attachment strength Figure 1. Fluorescence microscopic image (excitation 420–490 nm)
or to serve the foraminifera’s need for calcium and/or DIC and schematic figure of H. sarcophaga on A. excavata. A: H. sar-
cophaga; B: attachment depression corroded by H. sarcophaga; C:
(dissolved inorganic carbon) (Beuck et al., 2008; Cedhagen,
bored canal; D: callus built by A. excavata (SRZ: shell repair zone);
1994).
E: undisturbed shell; E1 : calcitic shell layer (fibrous); E2 : calcitic
As the parasitic foraminifera ingests material from its host, shell layer (microgranular); E3 : aragonitic shell layer.
the question arises of whether this process exerts an influence
on the shell geochemistry of the parasite. Should this be the
case, this factor may need to be accounted for, especially as 2 Material and methods
some parasitic foraminifera, such as Cibicides refulgens, are
also used in geochemical studies for paleoenvironmental re- 2.1 Sampling
constructions (García-Gallardo et al., 2017; Mackensen and
Nam, 2014; Rathburn and de Deckker, 1997; Raddatz et al., All investigated samples were collected in the Leksa Reef,
2011; Alexander and Delaca, 1987). located at the entrance to the Trondheimsfjord in Nor-
Here, we present element-to-Ca ratios (Mg / Ca, Sr / Ca, way (63.613056◦ N, 9.384167◦ E; depth ∼ 200 m) by means
Na / Ca and Mn / Ca) and stable isotope data (oxygen and of the manned submersible JAGO (GEOMAR Helmholtz-
carbon) analyzed in H. sarcophaga collected from differ- Zentrum für Ozeanforschung, 2017) during the scientific
ent host organisms (A. excavata and D. pertusum) from the cruises POS473 and POS525 with RV Poseidon (Form et
Trondheimsfjord (also known as Trondheim Fjord, Norway) al., 2015; Büscher, 2018; GEOMAR Helmholtz-Zentrum für
to explore if and how the different hosts influence the geo- Ozeanforschung, 2015). In total we analyzed 30 specimens
chemical composition of the test of foraminifera. In addition, of H. sarcophaga, which were divided into three groups:
we present element maps analyzed by electron microprobe (1) H. sarcophaga that infested A. excavata with callus for-
analysis (EPMA) of the callus region of A. excavata in order mation (henceforth called HAW), (2) H. sarcophaga that
to explore geochemical differences between the callus region infested A. excavata without callus formation (henceforth
and undisturbed shell areas. called HAO; HAW + HAO = HA) and (3) H. sarcophaga
that infested D. pertusum (henceforth called HL). Samples of
A. excavata and D. pertusum were alive when sampled. We
cannot be entirely certain that H. sarcophaga were still alive
Biogeosciences, 18, 4733–4753, 2021 https://doi.org/10.5194/bg-18-4733-2021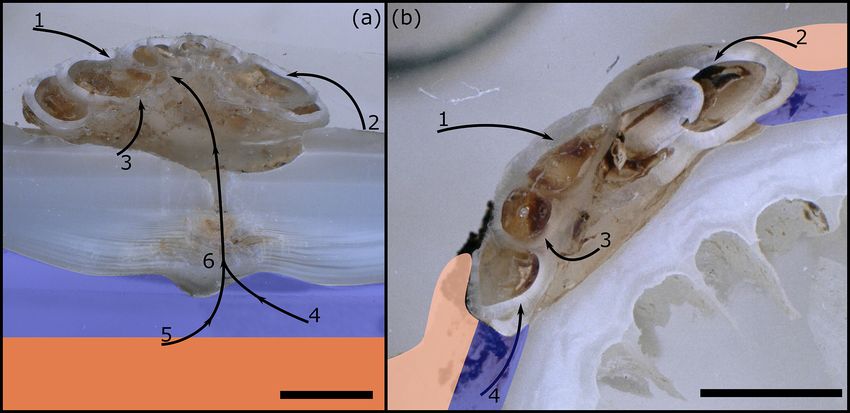
N. Schleinkofer et al.: Host-influenced geochemical signature in H. sarcophaga                                            4735

when sampled, but upon death they easily become detached        Sr = 129 µg g−1 (Sr / Ca = 0.1 mmol mol−1 ), S = 152 µg g−1
from the shell, whereas in our samples the foraminifera were    (S / Ca = 0.4 mmol mol−1 ) and Ca = 195 µg g−1 . Molar
still firmly attached. For ICP-OES, ICP-MS and GS-MS, the       ratios were calculated from the weight fractions of the
samples were ultrasonically rinsed in deionized water for       specific oxides (CaO, MgO, Na2 O, SrO, SO3 ) by calculating
5 min and allowed to dry before crushing in an agate mor-       the concentration of the observed elements (in µg g−1 ) and
tar                                                             normalization to Ca accounting for their relative atomic
                                                                mass. The chemical maps were recorded with a beam
2.2   Shell carbonate polymorph                                 diameter of 2 µm, 15 kV acceleration voltage and 20 nA
                                                                current.
The polymorph of the foraminiferal shell was deter-
mined using cobalt nitrate solution (Meigen solution). The      2.5   ICP-OES
foraminifera samples were crushed in an agate mortar and
transferred to Eppendorf containers. The samples were           For ICP-OES measurements we used 10 HAW, 10 HAO and
mixed with 10 wt % Co(NO3 )2 aqueous solution and allowed       10 HL samples. About 120 µg of sample powder was trans-
to react at 95 ◦ C for 20 min. Afterwards the samples were      ferred to Eppendorf tubes (acid cleaned with 5 % HNO3 ) and
washed four times with deionized water and inspected un-        sealed. Each sample was analyzed three times.
der a KEYENCE VHX-S660E microscope. Aragonite stains               Elemental ratios Mg / Ca, Sr / Ca, Na / Ca and Mn / Ca
purple/pink in cobalt nitrate solution, whereas calcite re-     (only for foraminifera and bivalves) were analyzed by induc-
mains unaffected (Kato et al., 2003)                            tively coupled plasma–optical emission spectrometry (ICP-
                                                                OES). ICP-OES analysis was carried out using a Thermo Sci-
2.3   Fluorescence microscopy
                                                                entific iCap 6300 Duo at the Institute of Geosciences, Goethe
We used fluorescence microscopy to investigate the distri-      University Frankfurt. The sample powder (≈ 140 µg) was
bution of the organic material in the foraminifera and the      dissolved in 500 µL HNO3 (2 %), and 300 µL aliquots were
underlying bivalve shell. The sample was cut, ultrasoni-        separated. Subsequently 1500 µL of 1.2 mg L−1 yttrium solu-
cally cleaned in deionized water, embedded in epoxy resin       tion was added to each aliquot as an internal standard result-
(Araldite 2020) and polished with 3 µm diamond-lapping          ing in a concentration of Y = 1 mg L−1 and Ca = 25 mg L−1 .
paste. Fluorescent images were taken using a Leica DMRX-        The intensity data were background corrected, standardized
POL microscope with fluorescent front light and a 50 W mer-     internally to Y and normalized to Ca. Accuracy is reported in
cury lamp. The microscope was equipped with an H3 filter        percent deviation from values of standard reference material
cube, which excites in the wavelength range of blue to violet   JCP1 and USGS MACS-3 (n = 5) (Jochum et al., 2005) and
(bandpass filter: 420–490 nm). The pictures were taken with     is better than 1 % for Mg / Ca and Sr / Ca, 5 % for Na / Ca,
a digital camera connected to the microscope with 0.25 s ex-    and 3 % for Mn / Ca. Precision is reported in relative stan-
posure time.                                                    dard deviation; percent RSD (relative standard deviation) of
                                                                the USGS MACS-3 and JCP1 carbonate reference material
2.4   EPMA                                                      (n = 5) (Jochum et al., 2005) is better than 3 % for all ana-
                                                                lyzed elements.
Two samples of A. excavata with attached H. sarcophaga             Bivalve (n = 3) and coral (n = 3) samples were treated
were analyzed by electron probe microanalysis (EPMA).           similarly to foraminifera samples. We took 15–20 samples
The area of interest was cut from the shell with a handheld     per shell from the outermost shell section along the main
drilling tool, ultrasonically cleaned in deionized water for    growth axis, starting at the ventral margin resulting in a total
5 min, mounted vertically into circular mounts and embed-       of 49 samples. The corals were sampled randomly over the
ded in epoxy resin (Araldite 2020). The sample surface was      whole calyx area, resulting in 44 samples.
ground with a 9 µm grid with silicon carbide sanding paper
and then polished using 3 µm diamond-water-based lapping        2.6   ICP-MS
paste. After polishing the samples were coated with carbon.
   The EPMA analyses were conducted at the Goethe               The manganese concentration of D. pertusum had to be de-
University Frankfurt on a JEOL JXA-8530F Plus field             termined by ICP-MS because it was below the limit of de-
emission gun electron probe microanalyzer (FEG-EPMA).           tection by ICP-OES. We used three specimens (two from the
The analysis conditions were 15 kV acceleration volt-           Leksa Reef and one from the Sula Reef), of which we sam-
age and 20 nA current with a beam diameter of 3 µm.             pled 150 µg from the fibrous shell section. Each sample was
We used a TAP crystal for Mg, TAPL for Na and                   measured twice.
Sr, and PETH for S. Detection limits are calculated                For solution-based ICP-MS measurements we used 150 µg
with the equation given in Goldstein et al. (2018) and          of sample powder and dissolved it in 500 µL 2 % HNO3 .
amount to Mg = 178 µg g−1 (Mg / Ca = 0.7 mmol mol−1 ),          The dissolved sample (300 µL) was mixed with 1500 µL
Na = 170 µg g−1                  (Na / Ca = 0.7 mmol mol−1 ),   1.2 mg L−1 yttrium solution, which was used as the internal

https://doi.org/10.5194/bg-18-4733-2021                                                Biogeosciences, 18, 4733–4753, 2021
4736                                         N. Schleinkofer et al.: Host-influenced geochemical signature in H. sarcophaga

standard. The reference material ECRM 752-1 (Greaves et               Sample bottles for δ 18 O were de-capped, and 0.5 mL water
al., 2008) was used to monitor measurement precision and           was extracted with a pipette for CO2 equilibration. The sam-
accuracy, reported in percent deviation from the reported val-     ples were transferred into 12 mL Labco Exetainers™ (Labco
ues of the standard reference material ECRM 752-1 (n = 3)          Ltd. Lampeter, UK) and subsequently flushed with 0.3 %
(Greaves et al., 2005), and equals 7 % for this analytical ses-    CO2 in helium. Equilibration time was 24 h at 25 ◦ C. All
sion. Precision is reported in relative standard deviation; per-   samples were measured in duplicates, and the reported val-
cent RSD of the ECRM 752 carbonate reference material              ues are arithmetic means. All values are reported in the stan-
(n = 3) is better than 1 % for Mn / Ca.                            dard δ notation in per mille (‰) vs. VSMOW. External re-
                                                                   producibility based on repeated analysis of control samples
2.7    Stable oxygen and carbon isotopes                           was better than 0.1 ‰ and 0.05 ‰ for δ 13 C and δ 18 O, respec-
                                                                   tively.
We used 9 HAW, 9 HAO and 10 HL for stable isotope mea-
surements. About 100 µg of sample powder was transferred           2.8    Statistical computation
to borosilicate glass tubes and sealed with plastic caps. Each
sample was measured three times.                                   We used one-way ANOVA to test the effect of the host
   Stable isotopes were measured at Goethe University              species on the elemental and isotopic composition in H. sar-
Frankfurt on a Thermo MAT 253 mass spectrometer inter-             cophaga. The Shapiro–Wilk test and Levene’s test were used
faced with a Thermo Fisher Scientific GasBench II. The             to ensure normal distribution and equal variance of the target
sample material (100 µg) was reacted with 99 % H3 PO4 at           variables. Most groups and target variables are normally dis-
72 ◦ C in continuous flow mode. Analytical procedures fol-         tributed except for Na / Ca in the HAO group and δ 18 O in the
lowed Spótl and Vennemann (2003). δ 13 C and δ 18 O values         HL group. All target variables except for Mn / Ca and Sr / Ca
are reported in δ notation, i.e. per mille deviation relative      show equal variance based on the Levene’s test. Normal dis-
to Vienna Pee Dee Belemnite (VPDB) and Vienna Standard             tribution and equal variance are considered a prerequisite for
Mean Ocean (VSMOW), respectively. Internal precision is            ANOVA. As these prerequisites are not met in some sam-
better than 0.06 ‰ (δ 13 C) and 0.08 ‰ (δ 18 O).                   ple groups, we additionally tested the data with a Kruskal–
   Samples of the ambient water were collected during sci-         Wallis test, which is a non-parametric alternative to ANOVA
entific cruise POS525 with R/V Poseidon in July 2018               (Lantz, 2013). Pairwise comparison of the different groups
(Büscher, 2018; GEOMAR Helmholtz-Zentrum für Ozean-                was accomplished with Bonferroni-adjusted Tuckey honest
forschung, 2015). A rosette sampler equipped with conduc-          significant difference (HSD) test. To test the relationship be-
tivity, temperature and depth sensors (CTD, Sea-Bird Sci-          tween different variables we used a linear regression model
entific, SBE 911 Plus) was used to sample water from the           fitted with ordinary least squares (OLS). All reported p val-
investigated reefs. The water samples were transferred from        ues are Bonferroni adjusted. Some measurements could be
12 L Niskin bottles to 250 mL borosilicate bottles and sealed      considered outliers, based on the interquartile range (IQR);
after adding 100 µL HgCl2 to prevent biological activity of        Q1 − 1.5 × IQR and Q3 + 1.5 × IQR. However, we have not
microorganisms that may alter the isotopic composition. The        truncated these measurements because most of them are just
samples were stored in a fridge at 4 ◦ C until measurement.        slightly outside the range mentioned above. Only one mea-
   Water samples were analyzed for their isotopic composi-         surement shows a high deviation, but keeping it in the dataset
tion at Friedrich-Alexander-Universität Erlangen-Nürnberg          does not change the outcome of the analysis.
by an automated equilibration unit (GasBench II; Thermo
Fisher Scientific) coupled in continuous flow mode to a Delta      3     Results
Plus XP isotope ratio mass spectrometer (Thermo Fisher Sci-
entific, Bremen, Germany).                                         3.1    Carbonate polymorph
   Water for δ 13 C analyses was extracted from the sample
bottles by a 1 mL disposable syringe through the septa with-       The investigated H. sarcophaga samples show no staining
out opening the bottle to avoid loss of CO2 during sample          (Supplement file S1) under the influence of cobalt nitrate so-
transfer. During water extraction, the removed volume was          lution. Consequently, the shells are calcitic.
simultaneously replaced by inert gas through a second nee-
dle connected to an argon-filled gas sampling bag (Grace,          3.2    Fluorescence microscopy
Deerfield, IL, USA). The samples were injected into 12 mL
Labco Exetainers™ (Labco Ltd., Lampeter, UK) that were             The fluorescence microscopic image of H. sarcophaga at-
prepared with phosphoric acid and pre-flushed with helium          tached to A. excavata (Fig. 1) shows distinct fluorescent and
(purity 99.999 %). For seawater the injection volume was           non-fluorescent layers in the shell repair zone (SRZ) of the
0.85 mL per vial. Samples were analyzed in duplicates, and         bivalve. Highly fluorescent material is also observable on H.
the reported values are arithmetic means. All values are re-       sarcophaga, especially in the test apertures.
ported in the standard δ notation in per mille (‰) vs. VPDB.

Biogeosciences, 18, 4733–4753, 2021                                                  https://doi.org/10.5194/bg-18-4733-2021
N. Schleinkofer et al.: Host-influenced geochemical signature in H. sarcophaga                                                4737

   The SRZ has a maximum thickness of 900 µm, decreas-           Table 1. Wilcoxon–Mann–Whitney test results of E / Ca compar-
ing in all directions. The fluorescent layers in the SRZ are     ison between the observed shell sections. Bold fields show signif-
20–40 µm thick. These layers taper off distally from the bore    icant differences between the two groups. p values are Bonferroni
canal and disappear. Non-fluorescent layers are generally        adjusted.
smaller, ranging from 9–20 µm. The asymmetric pit that is
produced by the foraminifera is observable – one side of the            Wilcoxon–Mann–Whitney test
pit is rising steeply, whereas the other side has a shallower                      Group 1       Group 2                  p
angle. The bore canal, which starts at the bottom of the at-
                                                                        Mg / Ca    Calcite       Aragonite            0.003
tachment etching, is 400 µm long in the undisturbed bivalve
                                                                                   Calcite       SRZ                < 0.001
shell but continues in the callus by another 240 µm. At the                        Calcite       H. sarcophaga      < 0.001
start of the bore the canal it is 340 µm in diameter and con-                      Aragonite     SRZ                  0.051
tinuously narrows to 140 µm. The canal ends in the SRZ with                        Aragonite     H. sarcophaga      < 0.001
a mushroom-like shape.                                                             SRZ           H. sarcophaga      < 0.001
                                                                        Na / Ca    Calcite       Aragonite            0.052
3.3   Element composition of point measurements
                                                                                   Calcite       SRZ                < 0.001
      (EPMA)                                                                       Calcite       H. sarcophaga            1
                                                                                   Aragonite     SRZ                  0.027
Within the bivalve shell Mg / Ca varies between 0.2 and                            Aragonite     H. sarcophaga        0.002
13.7 mmol mol−1 (Fig. 2). The lowest values were found                             SRZ           H. sarcophaga      < 0.001
in the aragonitic shell layer (Fig. 1E3 ) and the highest val-
                                                                        Sr / Ca    Calcite       Aragonite            0.003
ues are measured in the microgranular calcitic shell layer
                                                                                   Calcite       SRZ                < 0.001
(Fig. 1E2 ). The highest Mg / Ca ratios are measured in
                                                                                   Calcite       H. sarcophaga      < 0.001
the foraminiferal calcite (mean = 45.0 ± 17.9 mmol mol−1 ,                         Aragonite     SRZ                < 0.001
maximum = 80.6 mmol mol−1 ).                                                       Aragonite     H. sarcophaga      < 0.001
   The Na / Ca ratio is characterized by similar values                            SRZ           H. sarcophaga      < 0.001
in the different sections when considering the carbonate
                                                                        S / Ca     Calcite       Aragonite                1
polymorph, which it is built out of. The aragonitic sec-
                                                                                   Calcite       SRZ                  0.116
tions (Fig. 1E3 ), bivalve aragonite and SRZ have mean
                                                                                   Calcite       H. sarcophaga            1
Na / Ca ratios of 22.0 ± 2.3 mmol mol−1 (mean ± SD) and                            Aragonite     SRZ                  0.286
25.3 ± 3.8 mmol mol−1 respectively. The SRZ displays a                             Aragonite     H. sarcophaga            1
higher variability than the undisturbed aragonite. The mi-                         SRZ           H. sarcophaga         0.66
crogranular calcite is characterized by a mean Na / Ca of
14.8 ± SD = 3.7 mmol mol−1 (Fig. 1E2 ).
   The SRZ is enriched in Sr / Ca compared to the undis-         with Mg and S minima and Ca maxima are more uniform
turbed shell sections. Mean ratios are nearly 4 times            in size, ranging from 12.5 to 30 µm in thickness. Mean
higher than in the undisturbed aragonitic shell parts            composition of the fluorescent (fl) and non-fluorescent
(5.9 ± 2.1 mmol mol−1 compared to 1.5 ± 0.2 mmol mol−1 ).        (nfl) layers, based on EPMA point measurements amount
The lowest values are measured in the bivalve’s microgranu-      to the following: fl – Mg / Ca = 3.8 ± 1.7 mmol mol−1 ,
lar calcite (mean = 0.9 ± 0.1 mmol mol−1 ).                      Sr / Ca = 7.4 ± 1.2 mmol mol−1 ,
   S / Ca ratios are comparable in the undis-                    Na / Ca = 24.4 ± 5.4 mmol mol−1
turbed       bivalve      aragonite      and     microgranu-     and                           S / Ca = 5.5 ± 2.7 mmol mol−1 ;
lar      calcite,     with     1.9 ± 0.3 mmol mol−1       and    nfl – Mg / Ca = 3.2 ± 1.8 mmol mol−1 ,
2.1 mmol mol−1 ± 0.8 mmol mol−1 , respectively. Simi-            Sr / Ca = 4.6 ± 1.9 mmol mol−1 ,
lar to Sr / Ca, the highest mean and maximum S / Ca ratios       Na / Ca = 26.6 ± 1.3 mmol mol−1                             and
are measured in the SRZ (mean = 3.8 ± 2.5 mmol mol−1 ,           S / Ca = 2.3 ± 0.9 mmol mol−1 . Significant mean differ-
maximum = 11.1 mmol mol−1 ). However, all these differ-          ences between fluorescent and non-fluorescent layers, based
ences are insignificant (Table 1).                               on Wilcoxon–Mann–Whitney test, are evident with regards
                                                                 to the S / Ca (p < 0.001) and Sr / Ca ratios (p = 0.006).
Elemental composition of the SRZ                                    Mg / Ca and S / Ca as well as Na / Ca and S / Ca display
                                                                 significant correlations in the fluorescent layers (Fig. 4). In
As also visible in the fluorescence image (Fig. 1), the EPMA     the non-fluorescent shell layers, Mg / Ca and S / Ca, Sr / Ca
chemical maps show a layering pattern (Fig. 3). Highly           and S / Ca are significantly correlated. In both layers, S / Ca
fluorescent layers that coincide with Mg and S maxima            ratios are inverse correlated with Ca wt % (Fig. 4).
and Ca minima are variable in size, ranging from 15 to
80 µm in thickness. Non-fluorescent layers that coincide

https://doi.org/10.5194/bg-18-4733-2021                                                  Biogeosciences, 18, 4733–4753, 2021
4738                                           N. Schleinkofer et al.: Host-influenced geochemical signature in H. sarcophaga

Figure 2. Results of point measurements by EPMA in different sections of A. excavata and H. sarcophaga (two specimens each). (a) Mg / Ca,
(b) Na / Ca, (c) Sr / Ca and (d) S / Ca. Boxes display the interquartile range (IQR) and lines the median values. The whiskers show minimum
and maximum values that are within the range of Q1 − 1.5 × IQR – Q3 + 1.5 × IQR. Red circles show the mean values. Sample size = 11,
5, 17 and 16 (calcite, aragonite, SRZ, H. Sarcophaga). Text below the horizontal lines in the legend is the sampled area.

3.4    Stable carbon and oxygen isotope                                    The isotopic composition of HAW and HAO can be de-
                                                                        scribed by linear functions, whereas the isotopic composition
The different H. sarcophaga shells exhibit differences in               in HL cannot:
their isotopic composition based on their host organism
(Fig. 5e, f). In particular, δ 18 O values are similar in HL            δ 13 CHAW = 1.8 ± 0.4 × δ 18 O − 3.4 ± 0.8
and HA with +1.51 ± 0.22 ‰ and +1.80 ± 0.25 ‰, respec-
tively. These values are in accordance with δ 18 O values                  (r 2 = 0.7, p = 0.004, df = 7),                             (1)
from the host organism A. excavata, which range from                     13                         18
                                                                        δ CHAO = 1.1 ± 0.3 × δ O − 2.6 ± 0.6
+1.52 ‰ to +2.1 ‰. D. pertusum displays more depleted
δ 18 O and δ 13C C values, ranging from −1.93 ‰ to +0.54 ‰                 (r 2 = 0.6, p = 0.02, df = 6),                              (2)
and −9.41 ‰ to −3.30 ‰.                                                  13                       18
                                                                        δ CHL = 1.7 ± 1.0 × δ O − 6.2 ± 1.5
   Larger differences between the different H. sarcophaga
samples are observable in the carbon isotopic signature of                 (r 2 = 0.18, p = 0.12, df = 8).                             (3)
specimens taken from different host organisms. HA display
δ 13 C values of −0.43 ± 0.47 ‰, which is close to the ra-              3.5   ICP-OES results from H. sarcophaga grown on
tios of their host organism, being +0.49 ± 0.28 ‰. HL are                     different host organisms
more depleted in heavy carbon isotopes with a measured
value of −3.61 ± 0.71 ‰. For reference, the isotopic com-               H. sarcophaga samples from different host organisms are
position of the ambient seawater is δ 18 O = +0.26 ‰ and                similar in their chemical composition with regard to Mg / Ca
δ 13 C = +0.38 ‰.                                                       and Na / Ca (Fig. 5a, b). Mean Mg / Ca ratios range
                                                                        from 42.7 ± 6.8 to 44.4 ± 7.2 mmol mol−1 . Both host or-
                                                                        ganisms have lower mean Mg / Ca ratios of 4.3 ± 1.5 and

Biogeosciences, 18, 4733–4753, 2021                                                         https://doi.org/10.5194/bg-18-4733-2021
N. Schleinkofer et al.: Host-influenced geochemical signature in H. sarcophaga                                                    4739

                                                                         whereas HAO and A. excavata show higher Mn / Ca ratios of
                                                                         0.077 ± 0.03 and 0.13 ± 0.03 mmol mol−1 , respectively.

                                                                         3.6    Compositional differences in H. sarcophaga related
                                                                                to their host organism

                                                                         We conducted a one-way ANOVA and Kruskal–Wallis test
                                                                         (Table 2) in order to explore if the investigated H. sarcophaga
                                                                         groups (HAW, HAO, HL) show significant differences in
                                                                         their geochemical composition related to their host organ-
                                                                         ism. We used the measured elemental and isotopic composi-
                                                                         tion as target variables and the host organisms (A. excavata
                                                                         with callus, A. excavata without callus, D. pertusum) as the
                                                                         factor variable. Tukey HSD (Table 3) was used as post hoc
                                                                         test to investigate group-specific mean differences.
                                                                            The one-way ANOVA reveals no significant difference in
                                                                         the Mg / Ca and Na / Ca ratios of the foraminifera that were
                                                                         collected from the different host organisms (Table 2). In con-
                                                                         trast, the ANOVA suggests a significant difference between
                                                                         Sr / Ca and Mn / Ca ratios between these two groups. In the
                                                                         case of Sr / Ca, significant differences based on the Tukey-
                                                                         HSD post hoc test are observable between HL and HA,
                                                                         whereas we find no significant differences between HAW and
                                                                         HAO. In addition, we observe no significant differences be-
                                                                         tween HAW and HL in their Mn / Ca composition, but signif-
                                                                         icant differences are present between both these groups and
                                                                         HAO.
                                                                            In the case of the stable oxygen isotope composition, we
Figure 3. EPMA element maps and secondary-electron image from
a scanning electron microscope (SEM) image of the callus area of         observe significant differences between H. sarcophaga spec-
two specimen (a, b) of A. excavata. Intensity scale in counts per sec-   imens from different host organisms. The δ 18 O measured in
ond (cps). Minimum–maximum counts amount to Mg (10–24 cps),              HL is significantly lower than in HAO. Significant differ-
Na (76–132 cps) Ca (7600–8650 cps) and S (8.5–33 cps).                   ences are also observable for δ 13 C ratios. Here, differences
                                                                         in the isotopic composition are detectable between HL and
                                                                         HA, with the latter showing a higher δ 13 C ratio.
18.9 ± 4.5 mmol mol−1 in D. pertusum and A. excavata, re-                   The Kruskal–Wallis test, which was used as a non-
spectively.                                                              parametric cross validation for the ANOVA test, shows the
   Mean Na / Ca ratios range between 15.4 ± 2.1 and                      same results as the ANOVA test
17.6 ± 4.3 mmol mol−1 for H. sarcophaga. The highest
Na / Ca ratios and variations are measured in HAO. D.                    4     Discussion
pertusum displays overall higher Na / Ca ratios than H.
sarcophaga (26.3 ± 2.8 mmol mol−1 ). The highest varia-                  4.1    Mechanisms of etching and boring
tion is measured in A. excavata, ranging from 9.8 to
55.6 mmol mol−1 with a mean of 19.8 ± 7.3 mmol mol−1 .                   The boring and etching of H. sarcophaga in A. excavata
   A clear difference in Sr / Ca of 1.1 ± 0.16 mmol mol−1                and D. pertusum can serve multiple purposes. The attach-
is evident between H. sarcophaga from the different host                 ment etchings of foraminifera have been proposed to serve
organisms (Fig. 5c). HAW and HAO show mean Sr / Ca                       as an anchoring function and increase protection from preda-
ratios of 2.4 ± 0.2 and 2.1 ± 0.5 mmol mol−1 , respectively.             tors and the hydrodynamic regime. Possibly, the foraminifera
The host organism A. excavata has lower Sr / Ca ratios                   also dissolve the host’s carbonate material to satisfy the cal-
(1.2 ± 0.1 mmol mol−1 ). On the contrary, HL and D. per-                 cium and/or DIC requirements of H. sarcophaga for the cal-
tusum, display higher mean Sr / Ca ratios of 3.5 ± 0.7 and               cification of its shell (Cedhagen, 1994; Vénec-Peyré, 1996;
10.13 ± 0.3 mmol mol−1 respectively.                                     Todd, 1965) rather than expending further energy to source
   Prominent differences between H. sarcophaga groups                    Ca/DIC from the surrounding seawater (Fig. 6a).
are also evident in their Mn / Ca ratios (Fig. 5d).                         The boring in A. excavata is presumably produced to ac-
HAW, HL and D. pertusum display Mn / Ca ratios of                        cess the soft body of the bivalve, indicated by the mantle
0.017 ± 0.01, 0.012 ± 0.008 and 0.008 ± 0.001 mmol mol−1 ,               damage in the vicinity of the boring (Cedhagen, 1994). Addi-

https://doi.org/10.5194/bg-18-4733-2021                                                         Biogeosciences, 18, 4733–4753, 2021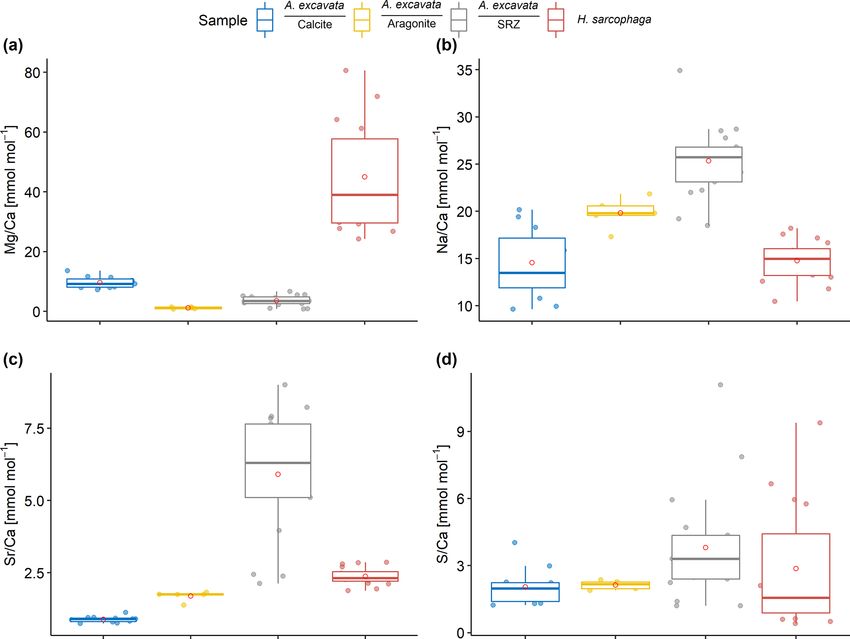
4740                                           N. Schleinkofer et al.: Host-influenced geochemical signature in H. sarcophaga

Figure 4. Elemental composition of the SRZ divided according to their fluorescence. Linear correlations are shown for both layers with 95 %
confidence intervals in gray. Correlations are calculated with a linear regression model with OLS.

Table 2. Results of the one-way ANOVA and Kruskal–Wallis analysis with the host organism as predictor variable. Bold fields show elemen-
tal and isotopic ratios in H. sarcophaga that may be significantly influenced by the chemistry of the host organism. p values are Bonferroni
adjusted, DFn signifies degrees of freedom in the numerator, and DFd signifies degrees of freedom in the denominator.

                         ANOVA
                                                    Mg / Ca     Na / Ca       Sr / Ca   Mn / Ca   δ 18 O     δ 13 C
                         DFn                                                         2
                         DFd                                                        25
                         F                               0.2       0.22           23      32         4.1        97
                         p                              0.82         0.8     < 0.001 < 0.001      0.029    < 0.001
                         Generalized eta squared       0.015      0.018         0.65    0.74       0.26       0.89
                         Kruskal–Wallis test
                         n                                                          28
                         df                                                          2
                         p                              0.83       0.92      < 0.001 < 0.001       0.03    < 0.001

tionally, the foraminifera may benefit from ingesting the ECF              viding additional ions for the calcification of H. sarcophaga
of the bivalve, containing carbohydrates, proteins, glycopro-              (Crenshaw, 1972). Feeding on mantle fluids of bivalves by
teins, and amino acids and therefore constituting a valuable               parasitic foraminifera is also supported by tracer experiments
nutrient source (Yin et al., 2005). The ECF is also enriched in            on C. refulgens (Alexander and Delaca, 1987). With D. per-
Ca and CO2 compared to the ambient seawater, maybe pro-                    tusum as host, the foraminifera can access the coenosarc and

Biogeosciences, 18, 4733–4753, 2021                                                          https://doi.org/10.5194/bg-18-4733-2021
N. Schleinkofer et al.: Host-influenced geochemical signature in H. sarcophaga 4741
Figure 5. Box and whisker plots displaying the E / Ca (ICP-OES and ICP-MS) and stable isotope analysis (MS) of the investigated speci-
mens. Boxes display the interquartile range and lines the median values. The whiskers show minimum and maximum values that are within
the range of Q1 − 1.5 × IQR to Q3 + 1.5 × IQR. Red circles show mean values. Lines in panels (e) and (f) show the isotopic composition of
the ambient seawater. Text below the horizontal lines in the legend is the host organism that H. sarcophaga grew on.
underlying calcifying space of the coral without having to HL show significantly higher Sr / Ca ratios than HA.
bore through the carbonate skeleton (Fig. 6b). Given that this result is based on measurements from multi-
H. sarcophaga probably uses chemical etching, as indi- ple individuals distributed across more than one host organ-
cated by the xenoglyph surface texture of the trace that ism, we suggest that this is most likely a signal of the high
changes in correlation with the host’s microstructure (Beuck Sr / Ca aragonite precipitated from D. pertusum that is im-
et al., 2008; Todd, 1965) A possible mechanism was inves- printed into the test of H. sarcophaga. By chemically corrod-
tigated in the non-symbiotic benthic foraminifera Ammonia ing the attachment etching as well as by the penetrating bor-
sp., which uses H+ -ATPase to actively pump H+ ions out of ing and by taking up the resulting solutions, the foraminifera
their protoplasm to facilitate calcification (Toyofuku et al., gains access to a pre-concentrated calcium carbonate solu-
2017). This proton flux causes a pH decrease by up to 1.1 in tion from which it can precipitate its shell (Fig. 6). Naturally,
a 100 µm wide zone around the foraminifera (Toyofuku et al., the foraminifera would also reflect other characteristics of
2017). Similar effects are reported from excavating sponges. the host, such as the high Sr / Ca ratio from the aragonite of
Cliona varians displays pH values as low as 5 in their filopo- D. pertusum (Raddatz et al., 2013; Schleinkofer et al., 2019).
dia during carbonate dissolution (Webb et al., 2019). In agreement with the much lower Sr / Ca ratios in calcite
and aragonite in A. excavata (Schleinkofer et al., 2021) com-
4.2 Sr / Ca differences in H. sarcophaga related to the pared to the coralline aragonite, we do not observe such high
host organism Sr / Ca ratios in HA. Still, the observed Sr / Ca ratios in HA
are higher by a factor of 2 than in the host organism. Since
We observe significant differences in the Sr / Ca and Mn / Ca we do not observe differences between HAW and HAO, the
composition between H. sarcophaga from different host or- Sr / Ca surplus cannot be derived from the ingestion of or-
ganisms. ganic material from within the shell cavity. We hypothesize
https://doi.org/10.5194/bg-18-4733-2021 Biogeosciences, 18, 4733–4753, 20214742 N. Schleinkofer et al.: Host-influenced geochemical signature in H. sarcophaga
Table 3. Tukey-HSD test results. Bold fields show significant differ-
ences between the two groups. HAW represents H. sarcophaga that
infested A. excavata with callus formation, HAO 0 H. sarcophaga
that infested A. excavata without callus formation, and HL repre-
sents H. sarcophaga that infested D. pertusum. p values are Bon-
ferroni adjusted.
Tukey-HSD test
Group 1 Group 2 Difference p
Mg / Ca HAW HAO −1.22 0.93
HAW HL −1.95 0.81
Figure 6. Possible pathways of E / Ca and isotopic signals into the
HAO HL −0.73 0.97
foraminiferal calcite. (a) H. sarcophaga on A. excavata, (b) H. sar-
Na / Ca HAW HAO 0.74 0.81 cophaga on D. pertusum. Blue areas represent the calcifying space,
HAW HL 0.05 0.99 and orange areas represent mantle tissue in A. excavata (a) and or-
HAO HL −0.68 0.84 ganic layer (coenosarc/mucus) in D. pertusum (b). Uptake of sea-
water and free-floating particles (1), ingestion of host organic mate-
Sr / Ca HAW HAO −0.004 1 rial (periostracum, coral tissue/mucus) (2), ingestion of dissolved
HAW HL 1.14 < 0.001 carbonate material (3), ingestion of extracellular calcifying fluid
HAO HL 1.14 < 0.001 (ECF) (4), ingestion of Mantle tissue (5), and ingestion of carbon-
Mn / Ca HAW HAO 0.05 < 0.001 ate and organic material from the deposited callus (6). Scale bar is
HAW HL −0.005 0.75 100 µm. Please note that the calcifying space and organic layers are
HAO HL –0.05 < 0.001 displayed enlarged for improved visibility. Actual size of the cal-
cifying space amounts to 1–100 nm (Nakahara, 1991; Tambutté et
δ 18 O HAW HAO 0.07 0.81 al., 2007). The organic layer (coenosarc) is ∼ 25 µm in thickness
HAW HL −0.23 0.11 (Tambutté et al., 2007).
HAO HL –0.30 0.032
δ 13 C HAW HAO −0.11 0.91
HAW HL –3.24 < 0.001 that the composition is close to the composition of seawater
HAO HL –3.12 < 0.001 (Wada and Fujinuki, 1976; Crenshaw, 1972).
The model calculates element / Ca ratios based on calcite
precipitation from a fluid that is derived from a mix of seawa-
ter (transported to the calcification site; see, e.g., Erez, 2003)
that a possible further control is likely provided through the and CaCO3 dissolved from the host organism:
mixture of dissolved host CaCO3 material and ambient sea- R E
water from which the foraminifera calcify, which is explored E ESW + M10Carb × Ca Host
1000
in more detail in the next section. = R
× DE × 1000, (4)
Ca Hyrrokkin CaSW + M10Carb
4.3 Mixing model where ESW is the element concentration in seawater,
E / CaHost is the element / Ca ratio in host carbonate
In order to further investigate the observed results, we cre- (mmol mol−1 ), CaSW is the calcium concentration in sea-
ated a simple two-component model to explore how the trace water (0.010 mol L−1 ), DE is the calcite–water distribu-
element chemistry of H. sarcophaga could change by deliv- tion coefficient, MCarb is the atomic mass of CaCO3
ery of ions to the calcification site that were derived from (100.08 g mol−1 ), and R is the log mixing ratio between car-
dissolution of the host organism. In this model we calculate bonate and seawater (g L−1 ).
changes in the foraminifera composition in dependence from As we have no information about the amount of dis-
an assumed calcification from a variable mixture of seawater solved material and water that is taken up by H. sarcophaga,
and dissolved host carbonate material. We excluded the ad- we modeled it over 6 orders of magnitude (log dissolved
dition of the hosts calcifying fluid in the model because there CaCO3 /seawater ratios of −4 to +2). The parameters used
are no data available for the chemical composition of the cal- are reported in Table 4.
cifying fluid of D. pertusum or A. excavata and because the Based on the model shown in Fig. 7, the Mg / Ca and
model is intended only as an initial exploration of whether Na / Ca ratios in H. sarcophaga are independent of the geo-
the geochemistry of H. sarcophaga can be explained by cal- chemical signature of the host it lived on, which is in agree-
cification from a mixture of seawater and dissolved host ma- ment with our measurements. This is caused by the high con-
terial. Furthermore, measurements of the chemical composi- centration of these elements in the ambient seawater in com-
tion of the calcifying fluid of other bivalve species indicate parison to the host’s carbonate. The composition of the mix-
Biogeosciences, 18, 4733–4753, 2021 https://doi.org/10.5194/bg-18-4733-2021N. Schleinkofer et al.: Host-influenced geochemical signature in H. sarcophaga 4743
Table 4. Parameters used in the proposed model to explore the effects of carbonate and water uptake of H. sarcophaga on the shell chemistry.
1 and D 2 represent the distribution coefficient.
Host element / Ca ratios are derived from this study. DE E
Model parameters
ESW E / CaAcesta E / CaDesmophyllum 1
DE 2
DE
(mol L−1 ) (mmol mol−1 ) (mmol mol−1 )
Mg 0.053 19 4.2 0.015 0.009
(Segev and Erez, 2006) (Oomori et al., 1987)
Na 0.450 20 26 0.00028 0.0001
(Evans et al., 2015) (Füger et al., 2019)
Sr 0.0001 1.2 10.1 0.16 0.2
(Raitzsch et al., 2010) (Mucci and Morse, 1983;
Evans et al., 2015)
Mn 5 × 10⁻⁹ 0.131 0.008 0.5 10
(van Dijk et al., 2020) (Mucci, 1988)
Figure 7. Results of model calculations with the parameters listed in Table 4 for the measured E / Ca ratios. Text below the horizontal lines
in the legend is the host organism that H. sarcophaga grew on. Independently of the mixing ratio of dissolved host CaCO3 and ambient
water, no differences of the geochemical signature are predictable in Mg / Ca and Na / Ca. On the contrary, Sr / Ca and Mn / Ca ratios are
predicted to diverge at mixing ratios > 0.01 g CaCO3 L−1 seawater. Solid lines are produced with DE 1 for the calculation, and dotted lines
2
are produced with DE for the calculation (see Table 4). In panels (a) and (b), the different samples overlap each other.
https://doi.org/10.5194/bg-18-4733-2021 Biogeosciences, 18, 4733–4753, 20214744 N. Schleinkofer et al.: Host-influenced geochemical signature in H. sarcophaga
ture is largely controlled by the addition of Ca, which is equal gree of control over the composition of their calcifying fluid
for both host organisms. compared to low-Mg species (Evans et al., 2018; Geerken et
In contrast, the model predicts that, at high ratios of al., 2018). Assuming the calcifying fluid is depleted in Mg
CaCO3 derived from the host compared to the surround- in comparison to seawater, the model would predict lower
ing seawater, different Sr / Ca and Mn / Ca ratios should be Mg / Ca ratios, although importantly it would still not pre-
observed between foraminifera living on different host or- dict a difference in the Mg / Ca ratios of H. sarcophaga in-
ganisms. The modeled Sr / Ca ratios for HL are constant at fluenced by the host organism.
2.0 mmol mol−1 independent from the mixing ratio (Fig. 7c). Another factor that should be considered is the transport
When the foraminifera dissolves aragonitic material of D. pathway of the dissolved material into the foraminifera’s cal-
pertusum and this material is mixed with seawater, the re- cifying fluid. The dissolution process of the host organism
sulting Sr / Ca ratios in this solution do not change due to could modify the chemistry of the ambient seawater in a lim-
the aragonitic DSr being close to 1. Consequently, if the shell ited area around the foraminifera (Toyofuku et al., 2017),
Sr / Ca ratio in H. sarcophaga depends on calcite DSr and although this process is hard to imagine in an environment
the Sr / Ca ratio in the calcifying fluid of H. sarcophaga, the (cold-water coral reef) that relies on constant water move-
resulting Sr / Ca ratio in HL is equivalent to a specimen that ment to provide nutrients to the main inhabitants (Mienis et
calcifies solely from seawater (specimen without a host). As al., 2007). As such, we suggest it is more likely that the dis-
the calcitic DSr is below 1 (Raitzsch et al., 2010; Mucci and solved material is transported through the cytoplasm to the
Morse, 1983; Evans et al., 2015), the addition of dissolved calcification site (Spero, 1988; Erez, 2003), although further
material from A. excavata in the calcifying space results in work is required to confirm this.
decreasing Sr / Ca ratios in the calcifying fluid and lower
Sr / Ca ratios in the precipitated calcite of the foraminifera. 4.4 Mn / Ca differences in H. sarcophaga related to the
Similar results are obtained in the case of Mn / Ca ratios. The host organism
addition of dissolved host material to the calcifying space of
H. sarcophaga results in an increase in the Mn / Ca ratio in Based on the ANOVA analysis (Table 2), significant differ-
the calcifying fluid, which leads to increasing Mn / Ca ratios ences are also observable in the Mn / Ca ratios. HAO display
in the foraminiferal calcite. 4-times-higher Mn / Ca ratios than in the other two observed
The proposed model can help us understand why we groups. HL show similar Mn / Ca ratios as their host organ-
do not see changes in the Mg / Ca and Na / Ca composi- ism; both HAW and HAO show lower Mn / Ca ratios. Based
tion of H. sarcophaga from different host organisms and on the differences we observe between the samples that were
why Sr / Ca and Mn / Ca ratios differ between these groups picked from A. excavata, it is unlikely that the Mn / Ca sig-
(Fig. 2). Nonetheless, other processes are clearly required nal in H. sarcophaga derives from the host shell material
to explain the details of trace element uptake in H. sar- (Fig. 6a3 and b3). In this case we would expect to see dif-
cophaga. Sr / Ca ratios in HL, for instance, can only be mod- ferences between HA and HL as Mn / Ca in A. excavata is
eled up to 2 mmol mol−1 , whereas we measure a mean of approximately 1 order of magnitude higher than in D. per-
3.5 mmol mol−1 . The results of this model are largely driven tusum. Influences of the surrounding water cannot explain the
by the distribution coefficients used; however, the distribu- observed differences either. Manganese, as a redox-sensitive
tion coefficients used in this model are not empirically deter- element, is controlled by the oxygen concentration of the
mined on H. sarcophaga but derive from other foraminifera ambient water. Under well-oxygenated conditions, the main
species (DE 1 ) or inorganic precipitation experiments (D 2 ). species Mn2+ is oxidized to Mn oxyhydroxides and pre-
E
The model also does not account for growth-rate-driven dif- cipitated (Calvert and Pedersen, 1996, 1993). Low-oxygen
ferences in trace element portioning, while this is especially conditions lead to a reduction of Mn oxyhydroxides to the
relevant in the case of Na and Mn (Mucci, 1988; Füger et bioavailable Mn2+ and a consequent increase in Mn / Ca ra-
al., 2019). In addition, we have to consider lattice strain ef- tios in biogenic carbonates (Tribovillard et al., 2006; Groen-
fects that increase the distribution coefficient for other ele- eveld and Filipsson, 2013; Koho et al., 2015). The Leksa
ments such as Sr and Na, as H. sarcophaga has relatively Reef, however, is well oxygenated (Milzer et al., 2013; Ja-
high concentrations of Mg (Evans et al., 2015; Mucci and cobson, 1983).
Morse, 1983). An influence of the precipitation rate on the Mn / Ca ratio
As discussed above, this is a simplified model that uses was shown in inorganically precipitated calcite overgrowths
seawater and dissolved carbonate as end-members. An addi- and the planktic foraminifera Orbulina universa (Mucci,
tional possibility is that the foraminifera pumps or channels 1988; Lorens, 1981; Holland et al., 2017). Generally speak-
ions into and out of the calcifying fluid. In particular, it has ing, increased calcification rates cause Mn / Ca ratios in the
been suggested foraminifera are able to transport Mg out of precipitates to decrease (Mucci, 1988; Holland et al., 2017).
the calcifying space (Nehrke et al., 2013; Toyofuku et al., In our investigated samples, this effect would imply lower
2017; Bentov and Erez, 2006), but intermediate and high-Mg calcification rates in HAO compared to HAW and HL. The
foraminifera such as A. lessonii appear to exert a lower de- possibility of HAO having low calcification rates is likely,
Biogeosciences, 18, 4733–4753, 2021 https://doi.org/10.5194/bg-18-4733-2021N. Schleinkofer et al.: Host-influenced geochemical signature in H. sarcophaga 4745
as it is missing a valuable nutrient source (Fig. 6). Due to Connaughey, 2003; Adkins et al., 2003; Bajnai et al., 2018).
the high distribution coefficient of manganese, Rayleigh frac- Bivalves are largely considered to calcify in equilibrium with
tionation might add an additional control on Mn / Ca ratios the surrounding water (Immenhauser et al., 2016), which ap-
in the foraminifera shell (Holland et al., 2017). The model pears to be valid for A. excavata as it displays an isotopic
of Rayleigh fractionation relies on a number of assumptions composition close to the expected equilibrium (Fig. 8). The
about the internal reservoir of the foraminifera regarding the host organism D. pertusum displays higher departures from
size, initial composition, refreshment rate and calcification the expected aragonite equilibrium, which is mainly caused
rate (Elderfield, 1996). As these parameters are not fully un- by additional incorporation of isotopically lighter, metabolic
derstood, both for H. sarcophaga and foraminifera in gen- CO2 and by kinetic isotope effects associated with hydra-
eral, we cannot provide further information about the possi- tion/hydroxylation reactions given that this coral raises the
ble influence. calcification site pH to values significantly exceeding seawa-
A significant influence of the potentially Mn-enriched ter pH (Chen et al., 2018; McCulloch et al., 2012).
bodily fluids of bivalves (Wada and Fujinuki, 1976) also can- Interestingly, the HA samples display an isotopic compo-
not explain the differences in the chemical composition as sition very similar to the composition of its host organism
the samples that discern from the others are picked from (Fig. 8). The 95 % confidence ellipsoids of HAW, HAO and
HAO. These foraminifera did not have access to the inter- A. excavata all overlap at the highest δ 18 O values. How-
nal organic material of the bivalve (Fig. 6a4). Instead, the ever, in contrast to A. excavata, HAW and HAO display pos-
high Mn signal in HAO must derive from a source that is itive correlations between δ 18 O and δ 13 C. This may indicate
located on the outside of the bivalve host (Fig. 6a2). When that all three organisms closely mineralize their carbon from
the foraminifera initially infests the bivalve and starts boring the same source, but hydration/hydroxylation kinetics occur
into the shell, nutrient sources other than the internal organic more pronounced in HAW and HAO relative to A. excavata.
parts of the bivalve have to be utilized by H. sarcophaga. The The observable differences in the carbon isotopic compo-
organic periostracum of the bivalve could depict this nutrient sition between HA and HL can also be caused by different
source as it is a highly nutritional source for organic mate- proportions of the carbon sources. HL presumably have con-
rial on the outside of the bivalve’s shell (Secor et al., 1993). stant access to the host’s carbon pool, whereas the access
High concentrations of Mn and Fe were measured in the of HA to the host’s carbon pool is limited due to the de-
periostracum of freshwater and marine bivalves (Swinehart fense mechanism of A. excavata (Fig. 3). When the bivalve
and Smith, 1979; Allen, 1960). The mechanistic explanation has successfully closed the boring of the foraminifera, the
for this enrichment of Mn and Fe is reported to be the high foraminifera must use seawater DIC as a carbon source until
amount of the amino acids containing glycine and tyrosine it penetrates the shell again. This mixing of different carbon
in the periostracum of bivalves (Piez, 1961; Whitney et al., sources in HA in contrast to the stable carbon source of HL
2019), which act as complexing sites for metal ions (Swine- can explain the lower δ 13 C values in HL due to an increased
hart and Smith, 1979). The existence of living H. sarcophaga influence of host-derived carbon.
attached to rocks demonstrates that they do not necessarily HL is characterized by significantly more positive δ 18 O
rely on a living host but can also supply themselves through values than its host and is also characterized by a slightly
other feeding strategies (Cedhagen, 1994). Since algae take steeper positive correlation between δ 13 C and δ 18 O. Both
up Mn and concentrate it internally (Sunda and Huntsman, circumstances point to faster hydration/hydroxylation kinet-
1985), the increased Mn / Ca in HAO could also be caused ics to be effective during the mineralization of HL compared
by a facultative suspension-feeding mode of H. sarcophaga to its host (Chen et al., 2018). If the pH at which HA pre-
during its juvenile stage. cipitates carbonate is lower than the pH of the calcifying
At this point we can only speculate about the mechanistic fluid in D. pertusum, the hydration kinetics would be accel-
explanation for the enrichment of Mn / Ca in HAO. Future erated as a result (Raddatz et al., 2014; Cohen, 2003; Cren-
research on H. sarcophaga should involve spatially resolved shaw, 1972). Both organisms may derive their carbon from
Mn and Fe measurements to explore if there is an ontogenetic the same source, which likely occurs depleted in 13 C rela-
decrease in Mn / Ca ratios in the test of H. sarcophaga picked tive to seawater, possibly due to significant admixture from
from A. excavata. This decrease would mark the time of the metabolic CO2 . This assertion is supported by the fact that
first penetration of the bivalve shell. HL has constant access to the host’s carbon pool.
Another mechanism potentially altering the δ 13 C from
4.5 Carbonate isotopic composition in H. sarcophaga equilibrium might be the etching mechanism that pumps
based on the host organism H+ ions in the ambient water around the foraminifera
(Toyofuku et al., 2017). The decreasing pH around the
The oxygen and carbon isotopic composition of the differ- foraminifera shifts the carbon speciation towards CO2 . As
ent organisms are characterized by large differences. A. ex- CO2 is depleted in 13 C compared to the total inorganic car-
cavata does not show signs of kinetic effects, which would bon pool, the utilization of CO2 for calcification would also
be indicated by a correlation of δ 13 C and δ 18 O values (Mc- explain the deviations of the foraminifera’s shell δ 13 C from
https://doi.org/10.5194/bg-18-4733-2021 Biogeosciences, 18, 4733–4753, 20214746 N. Schleinkofer et al.: Host-influenced geochemical signature in H. sarcophaga
Figure 8. δ 18 O plotted against δ 13 C for H. sarcophaga from different host organisms and the host organisms A. excavata and D. pertusum
with a 95 % confidence ellipse. Arrows show compositional changes induced by kinetic effects and respiration. Text below the horizontal
lines in the legend is the host organism that H. sarcophaga grew on. Red points show the equilibrium composition for calcite and aragonite
as calculated from the isotopic composition of the ambient seawater.
isotopic equilibrium (Toyofuku et al., 2017; McCorkle et al., constructions or geochemical investigations in general, such
1997). as Cibicides refulgens (Mackensen and Nam, 2014; Rath-
burn and de Deckker, 1997; García-Gallardo et al., 2017),
4.6 Implications for paleoceanographic reconstructions Hanzawaia concentrica (Smith and Emiliani, 1968) and Dis-
canomalia coronata (Baranwal et al., 2014).
The results presented here have implications for paleorecon- As an example, we use a δ 18 O-temperature conversion
structions in two ways. When using bivalves for paleorecon- formula for benthic foraminifera (Marchitto et al., 2014)
structions or geochemical investigations in general, the shells and our measured δ 18 O ratios to reconstruct a temperature
must be carefully examined for potential traces of bioerosion. for the Leksa Reef of 7.5 ◦ C using HAO and 7.8 ◦ C using
In case of callus formation, the carbonate formed can have a HAW with δ 18 OSW derived from seawater measurements.
significantly different composition than the original carbon- In situ measurements of the water temperature in the Leksa
ate mineralogy. Reef by CTD show a mean temperature of 7.8 ◦ C (mini-
Even more critical are the implications for paleoceano- mum = 7.1 ◦ C, maximum = 8.8 ◦ C) (Büscher, 2018). If we,
graphic reconstructions using foraminifera, which are regu- however, were to use δ 18 O ratios from HL, we would recon-
larly analyzed for this purpose. Several foraminifera species struct a water temperature of 8.8 ◦ C and consequently over-
are known to live on different host organisms and act as par- estimate the water temperature by 1.0 ◦ C.
asites and/or bioeroders (Walker et al., 2017; Dupuy et al., If the aforementioned species show similar host-specific
2010; Freiwald and Schönfeld, 1996). Some of these are also alterations of their isotopic and elemental composition, pa-
used for isotope- and element-based paleoenvironmental re- leotemperature reconstructions on the basis of these species
Biogeosciences, 18, 4733–4753, 2021 https://doi.org/10.5194/bg-18-4733-2021You can also read