Deliverable 2.2 Stocktaking on soil quality indicators and associated decision support tools, including ICT tools
←
→
Page content transcription
If your browser does not render page correctly, please read the page content below
Ref. Ares(2021)780359 - 30/01/2021

Towards climate-smart sustainable management of
                agricultural soils

              Deliverable 2.2
 Stocktaking on soil quality indicators and
associated decision support tools, including
                  ICT tools

          Due date of deliverable: M12 (January 2021)
              Actual submission date: 30.01.2021

       This project has received funding from the European Union’s Horizon 2020
       research and innovation programme under grant agreement N° 862695                         1
Deliverable 2.2 Stocktaking on soil quality indicators and associated
decision support tools, including ICT tools

                                      GENERAL DATA
Grant Agreement: 862695
Project acronym: EJP SOIL
Project title: Towards climate-smart sustainable management of agricultural
soils
Project website: www.ejpsoil.eu

Start date of the project: February 1st, 2020
Project duration: 60 months
Name of lead contractor: INRAE

Funding source: H2020-SFS-2018-2020 / H2020-SFS-2019-1
Type of action: European Joint Project COFUND

DELIVERABLE NUMBER:                     2.2
DELIVERABLE TITLE:                      Stocktaking on soil quality indicators and
                                        associated decision support tools, including
                                        ICT tools
DELIVERABLE TYPE:                       Report
WORK PACKAGE N:                         WP2
WORK PACKAGE TITLE:                     Developing a Roadmap for EU Agricultural
                                        Soil Management Research
DELIVERABLE LEADER:                     INIAV
AUTHOR:                                 L. Pavlů, J. Sobocká, L. Borůvka, V. Penížek
CO-AUTHOR:                              B. Adamczyk, A. Baumgarten, I. V. Castro, S.
                                        Cornu, M. De Boever, A. Don, D. Feiziene, G.
                                        Garland, B.S. Gimeno, H. Grčman, F.
                                        Hawotte, A. Higgins, R. Kasparinskis, M.
                                        Kasper, L. Kukk, P. Laszlo, S. Madenoğlu, K.
                                        Meurer, P. Schjønning, K. Skaalsveen, L.
                                        O'Sullivan, S. Vanino, W. Vervuurt, R. Wawer.
AKNOWLEDGEMENTS:                        M. Kasper, A. Baumgarten, S. Zechmeister-
                                        Boltenstern for inputs to synthesis and
                                        conclusions.
DISSEMINATION LEVEL:                    PU

                   This project has received funding from the European Union’s Horizon 2020
                   research and innovation programme under grant agreement N° 862695          2
Deliverable 2.2 Stocktaking on soil quality indicators and associated
decision support tools, including ICT tools
Abstract
This synthesis shows recent and current efforts in Europe related to the establishment of soil indicators
as parameters used to quantify and valuate impacts of agricultural soil management practices on soil
quality. It also shows how the existing indicators have been used. Among the best captured soil
parameters across all participating countries are carbon concentration in soils and its changes in time,
macronutrients (N, P, K) and micronutrients (Cu, Mn) contents in soils, soil pH, cation exchange
capacity and base saturation of soils, soil texture and bulk density, and contamination with potentially
toxic elements, especially Cd, Co, Cr, Cu, Ni, Pb and Zn. However, there is only partial agreement
between the measured parameters and the indicators used in the national legislations and as policy
maker´s tools.
This project has received funding from the European Union’s Horizon 2020
research and innovation programme under grant agreement N° 862695 3Deliverable 2.2 Stocktaking on soil quality indicators and associated
decision support tools, including ICT tools
Table of Contents
Abstract ................................................................................................................................................... 3
List of Tables ............................................................................................................................................ 5
List of Figures........................................................................................................................................... 6
List of acronyms and abbreviations......................................................................................................... 7
1. Executive summary ......................................................................................................................... 8
2. Introduction ................................................................................................................................... 10
3. Methodology and source data ...................................................................................................... 11
3.1. Data collecting............................................................................................................................ 11
3.2. General data description............................................................................................................ 11
4. Results ........................................................................................................................................... 12
4.1. Soil quality indicators (questionnaire parts A, B, C) ................................................................... 15
4.1.1. Processing of results by country.......................................................................................... 16
4.1.2. Processing of results by environmental zones .................................................................... 25
4.1.3. Processing of results by European regions .......................................................................... 26
4.2. Soil quality indicators (questionnaire part D) ............................................................................ 29
5. Limitations of the synthesis........................................................................................................... 32
6. Conclusions.................................................................................................................................... 33
References ............................................................................................................................................. 35
Annex I ................................................................................................................................................... 36
Annex II .................................................................................................................................................. 53
Annex III ................................................................................................................................................. 60
Annex IV ................................................................................................................................................ 68
Annex V.................................................................................................................................................. 75
Annex VI ................................................................................................................................................ 79
Annex VII ............................................................................................................................................... 86
Annex VIII .............................................................................................................................................. 90
Annex IX ................................................................................................................................................. 95
This project has received funding from the European Union’s Horizon 2020
research and innovation programme under grant agreement N° 862695 4Deliverable 2.2 Stocktaking on soil quality indicators and associated
decision support tools, including ICT tools
List of Tables
Table 1: Soil organic matter evaluation in participating countries (Carbon (C) concentration, carbon
stock, soil organic matter quality, and carbon concentration changing (shift) of over time.
Table 2: Nutrient status of soils evaluation in participating countries. (Ntot – total N content; Noth –
content of other N forms; Xav – contents of available nutrients form)
Table 3: Soil reaction and soil sorption complex evaluation in participating countries. (pHact – (active)
pH measured in soil solution or water extract of soil; pHpot- (potential) pH measured in salt (KCl, or
CaCl2)) solution extract of soil; CEC – cation exchange capacity; BS – base saturation)
Table 4: Physical parameters evaluation in participating countries.
Table 5: Soil water content evaluation in participating countries.
Table 6: Physical soil degradation evaluation in participating countries.
Table 7: Soil chemical degradation evaluation in participating countries – contamination with
potentially toxic elements.
Table 8: Soil chemical degradation evaluation in participating countries – contamination with organic
pollutants and salinization (OCPs – organochlorine pesticides; PAHs – polycyclic aromatic
hydrocarbons; PCBs – polychlorinated biphenyls; POPs – persistent organic pollutants; C10-C40 –
petroleum hydrocarbons in the range of C10-C40).
Table 9: Biological parameters evaluation in participating countries.
Table 10: Representation of individual environmental zones in individual states and the classification
of countries into the main European regions
This project has received funding from the European Union’s Horizon 2020
research and innovation programme under grant agreement N° 862695 5Deliverable 2.2 Stocktaking on soil quality indicators and associated
decision support tools, including ICT tools
List of Figures
Figure 1: Categories of data sources (number of sources containing country-wide information, region-
wide information, local information, and sources unprocessed in report from different reasons).
Figure 2: Format of data sources (description “other” represents sources where this information is
missing).
Figure 3: Availability of data sources (description “both types” represents sources for which: part of
the data is public and another part requires some permission; description “other” represent sources
where this information is missing).
Figure 4: Sampling strategies (description “other” represents finished monitoring or sources where
information about sampling strategy is missing).
Figure 5: Sampling depth (description “other” represents sources where information about sampling
depth is missing).
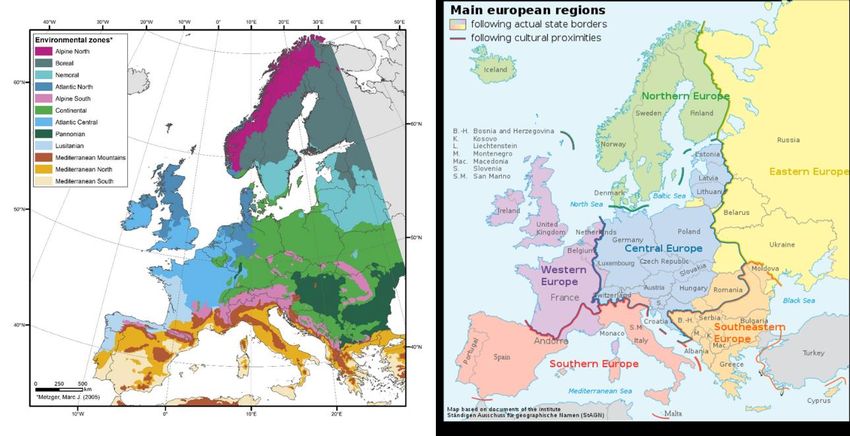
Figure 6: A – Pedoclimatic zones of Europe according to Metzger et al. (2005); B – Main European
regions. Source: Der Ständige Ausschuss für geographische Namen (StAGN)
https://commons.wikimedia.org/wiki/File:Grossgliederung_Europas-en.svg [22.7.20]
Figure 7: Soil organic matter (SOM) characteristics, soil reaction, soil sorption complex parameters,
and nutrient status of soils evaluation in participating countries divided to European regions: northern
(4 countries), central (11 countries), and western Europe (5 countries), and southern Europe with
Turkey (4 countries). (pHact – (active) pH measured in soil solution or water extract of soil; pHpot-
(potential) pH measured in salt (KCl, or CaCl2)) solution extract of soil; CEC – cation exchange capacity;
BS – base saturation; Ntot – total N content; Noth – content of other N forms)
Figure 8: Physical parameters, soil water content, physical soil degradation, and soil chemical
degradation evaluation in participating countries divided to European regions: northern (4 countries),
central (11 countries), and western Europe (5 countries), and southern Europe with Turkey (4
countries). (OCPs – organochlorine pesticides; PAHs – polycyclic aromatic hydrocarbons; PCBs –
polychlorinated biphenyls)
Figure 9: Biological parameters evaluation in participating countries divided to European regions:
northern (4 countries), central (11 countries), and western Europe (5 countries), and southern
Europe with Turkey (4 countries).
This project has received funding from the European Union’s Horizon 2020
research and innovation programme under grant agreement N° 862695 6Deliverable 2.2 Stocktaking on soil quality indicators and associated
decision support tools, including ICT tools
List of acronyms and abbreviations
ALN – Alpine North
ALS – Alpine South
ANA – Anatolian
ATC – Atlantic Central
ATN – Atlantic North
BOR – Boral
BS – base saturation
C10-C40 – petroleum hydrocarbons in the range of C10-C40).
CAP – Common Agricultural Policy of the European Union
CEC – cation exchange capacity
CON – Continental
GAEC – Good Agricultural and Environmental Conditions
ICT – Information and Communication Technologies
LUCAS – Land Use and Coverage Area frame Survey
LUS – Lusitanian
MDM – Mediterranean Mountains
MDN – Mediterranean North
MDS – Mediterranean South
NATURA 2000 network – Europe-wide ecological network of nature conservation areas
NEM – Nemoral
Noth – content of other N forms
Ntot – total N content
OCPs – organochlorine pesticides
PAHs – polycyclic aromatic hydrocarbons
PAN – Pannonian
PCBs – polychlorinated biphenyls
pHact – active pH measured in soil solution or water extract of soil
pHpot – potential pH measured in salt (KCl, or CaCl2) solution extract of soil
POPs – persistent organic pollutants
PTE – potentially toxic elements
SOM – Soil organic matter
UNFCCC – United Nations Framework Convention on Climate Change
USDA Soil Taxonomy – United States Department of Agriculture Soil Taxonomy
WRB – World Reference Base of Soil Resources
Xav – contents of available nutrients form
This project has received funding from the European Union’s Horizon 2020
research and innovation programme under grant agreement N° 862695 7Deliverable 2.2 Stocktaking on soil quality indicators and associated
decision support tools, including ICT tools
1. Executive summary
The aim of this survey was to obtain information on soil quality indicators, what indicators are used to
assess soil quality, for the purposes of its protection, valuation or effective use, including information
on the availability and sources of this data. For this purpose, a questionnaire was prepared and sent
to all participants (participating countries) of the EJP SOIL programme. In this questionnaire survey,
we obtained questionnaires from all project countries. Almost 200 sources of information on soil
qualitative characteristics were identified in these questionnaires. Sources contain country-wide
information (98), region-wide information (26), local information (8), and 61 sources were further
unprocessed because they did not contain data on the evaluated soil parameters, or were focused on
forest soils, or were focused very narrowly and did not provide more general information about the
indicators of soil quality.
It was found that in most countries and thus in all environmental zones and European regions, there
is a wide range of information on soil properties, obtained from both national (regional in the case of
specific state arrangements) monitoring and single sampling campaigns. These data are in the form of
databases or geodatabases publicly available as soil information geoportals, or available in specific
circumstances, for example, only to landowners, or available with permission of data owners. In most
countries, information on the entire depth of the soil profile is available, only in two are data declared
only from topsoil.
The soil quality indicators themselves, which include a number of soil properties, were divided into 8
groups: 1. Evaluation of soil organic matter status in terms of quantity, stocks and quality, as well as
the time frame, i.e. changes in carbon content over time; 2. evaluation of nutrient status of soils
including contents of main macronutrients and also micronutrients; 3. evaluation of soil pH and
evaluation of related information about soil sorption complex; 4. evaluation of physical parameters of
soil as texture, stoniness, porosity, and bulk density; 5. evaluation of soil water content and behaviour
through water field capacity, wilting point, available water capacity, and infiltration; 6. description of
physical degradation of soils including soil compaction, soil structure degradation, and soil erosion; 7.
description of chemical degradation of soils including contamination with potentially toxic elements
and organic pollutants, and salinization; 8. evaluation of biological parameters of soils especially
biological activity, potentially mineralizable nitrogen, microbial biomass content, abundance of specific
group of organisms, or various enzymes measurement.
Among the best captured soil parameters across all participating countries are organic carbon
concentration in soils and its changes in time, macronutrients (N, P, K) and micronutrients (Cu, Mn)
contents in soils, soil pH, cation exchange capacity and base saturation of soils, soil texture and bulk
density, and contamination with potentially toxic elements especially Cd, Co, Cr, Cu, Ni, Pb and Zn.
Evaluation of water content is one of the less monitored soil characteristics in participating countries.
Contamination with organic pollutants is addressed in only about one third of countries. Biological
parameters are generally the least frequently evaluated indicators of soil quality in Europe. Biological
activity is most often evaluated through soil respiration, but also only in seven of the participating
countries.
With regard to the general goal of the questionnaire (usage of soil quality indicators) there are some
soil quality indicators frequently used in national legislations and as policy maker´s tools (e.g., nutrient
contents, heavy metals contents, pH, hazard of soil erosion, organic pollutants contents) whereas soil
This project has received funding from the European Union’s Horizon 2020
research and innovation programme under grant agreement N° 862695 8Deliverable 2.2 Stocktaking on soil quality indicators and associated
decision support tools, including ICT tools
organic carbon was mentioned the most. As mentioned above, a lot of information about the soil is
freely available on the Internet, either in the form of the data itself or geodatabases with map outputs.
The range of ICP tools used is based on this. Computers and smartphones are most often mentioned
in the questionnaire. But the questionnaire also showed that many respondents are not familiar with
national or EU legislation relating to soil issue and many respondents do not distinguish terms:
legislation and policy maker´s tools, answers are the same or similar.
This project has received funding from the European Union’s Horizon 2020
research and innovation programme under grant agreement N° 862695 9Deliverable 2.2 Stocktaking on soil quality indicators and associated
decision support tools, including ICT tools
2. Introduction
Implementing a sustainable management of agricultural soils requires to be able to assess soil
functions and the provision of ecosystem services. A good knowledge of (i) the frameworks of
evaluation being used in the different partner countries, (ii) soil quality indicators and associated
decision support tools, including ICT tools (information and communication technologies) being used,
and (iii) reference values of indicators is necessary before proposing research projects in this area.
The general goal of the report presented here is the synthesis on the development and usage of soil
quality indicators and associated decision support tools, from past and on-going projects in European
countries. The objective is to evaluate the existing efforts on this topic across Europe to come up with
a roadmap in order to harmonize and standardize the soil quality indicators. Soil quality in this sense
means an account of the ability of soil to provide ecosystem and social services through its capacities
to perform its functions and respond to external influences (Tóth et al., 2007). The term soil quality
encompasses a broad spectrum of features and considers functional ability together with the response
properties of the soil. Soil quality therefore provides a complex information on the sum of different
soil characteristics, with regards to the level of ecosystem services a soil can provide. Soil quality
indicator is perceived as a parameter used to quantify and valuate impacts of agricultural soil
management practices on soil quality and the environment to draw conclusions for the farming
practice or agricultural policy.
The first sub-objective is to stocktake available data and knowledge on soil quality indicators across
agricultural land in Europe in order to provide a synthesis on recent and current achievements as well
as availability of such data for researchers and users. The second sub-objective is to review the
comparability of the soil indicators used in terms of methods of their acquisition (sampling, spatial and
temporal distribution, etc.). The third sub-objective is to assess the use of soil quality indicators for
specific Decision Supporting Tools and ICT among the European countries. Identification of soil
indicators used for decision support tools like in legislation measures, policy strategies or markers is
an added value of the questionnaire.
Obtained results should show all recent and current efforts in Europe related to the
development/establishment of soil indicators. A synthesis will show how this is done in different
countries and how the existing indicators have been used. This report will give a guidance to develop
and create a roadmap for soil science research on this topic. Realized stocktakes could synthetize and
provide knowledge over almost all European countries needed for general assessment of the potential
of research, development and harmonization activities in this topic.
This project has received funding from the European Union’s Horizon 2020
research and innovation programme under grant agreement N° 862695 10Deliverable 2.2 Stocktaking on soil quality indicators and associated
decision support tools, including ICT tools
3. Methodology and source data
3.1. Data collecting
The EJP SOIL partners collected the information for this stocktake and delivered the data by filling a
questionnaire in excel relating to soil quality indicators. It was a simply structured excel database for
stocktake of all indicators commonly used in countries and/or specially used for decision support tools.
The questionnaire consisted of four sections:
A. Data sources
What sources of soil data are used?
For each data source following questions of sections B and C were asked:
B. Information about the data
Availability/non availability of the data
Spatial and temporal resolution of the data
Sampling strategy (monitoring/single campaign)
Format of data (databases, geodatabases)
Additional data availability (e.g. soil chemical or physical degradation, land use)
C. List of soil quality measurements and indicators
General (e.g. terrain information, depth of sampling, soil classification system)
Chemical (e.g. Carbon content, soil pH, cation exchange capacity, nutrients content)
Physical (e.g. soil texture, bulk density, soil water content)
Biological (e.g. respiration, microbial biomass, edaphon groups abundance)
D. Soil parameters/indicators used for decision support tools
Which parameters and indicators are used in national legislation (limits)?
Which parameters and indicators are used as policy makers’ tool?
Which parameters and indicators are used to exclude certain measures (e.g. using selected
fertilizers)?
Which parameters and indicators are used to recommend certain soil protection measures?
If you have no national indicators what is done with the data?
Do you produce maps or reference values for the country (if yes, for which measurements)?
Have you compared your results with the LUCAS data/results/maps?
3.2. General data description
In this questionnaire survey, we obtained 24 completed questionnaires from all EJP participating
countries. Almost 200 sources of information on soil qualitative characteristics were identified in these
questionnaires (see the annex I). The amount of studies per country are as follows: Austria 16, Belgium
17, Czech Republic 7, Denmark 6, Estonia 4, Finland 9, France 6, Germany 9, Hungary 3, Ireland 5, Italy
8, Latvia 8, Lithuania 1, Netherlands 10, Norway 2, Poland 6, Portugal 20, Slovakia 6, Slovenia 6, Spain
6, Sweden 5, Switzerland 7, Turkey 1, United Kingdom 25. Information sources were divided to four
categories (figure 1): 1. Sources containing country-wide information; 2. Sources containing region-
wide information; 3. Sources containing local information; 4. Unprocessed sources. Unprocessed
sources were qualified as such because they did not contain data on the evaluated soil parameters,
This project has received funding from the European Union’s Horizon 2020
research and innovation programme under grant agreement N° 862695 11Deliverable 2.2 Stocktaking on soil quality indicators and associated
decision support tools, including ICT tools
were focused on forest soils, or were focused very narrowly and did not provide more general
information about the indication of soil quality. A frequent example of unprocessed sources of
information were soil maps containing information only on soil types. These are themselves an
indicator of soil quality, but other quality indicators will be addressed more precisely in this study.
However, even here one of the problems of soil assessment can be seen, and that is the harmonization
of taxonomic systems of European countries. Most countries of the questionnaires reported the use
of the national soil types classification (12). In six countries, the national taxonomic system and the
World Reference Base of Soil Resources (WRB) are used in parallel, and in Turkey, The American
taxonomic system (USDA Soil Taxonomy) is used.
28
26
24 country region local unprocessed
22
20
18
16
14
12
10
8
6
4
2
0
France
Italy
Latvia
Belgium
Denmark
Estonia
Finland
Norway
Sweden
Austria
Germany
Lithuania
Poland
Portugal
Czechia
Slovenia
Hungary
Ireland
Slovakia
Netherlands
Spain
Turkey
United Kingdom
Switzerland
Figure 1: Categories of data sources (number of sources containing country-wide information, region-
wide information, local information, and sources unprocessed in report from different reasons).
4. Results
The further processed sources (the most important of them are in the annex II – largescale data
sources) of information are either geodatabases with map outputs or only databases without a map
expression (figure 2). In many cases, the data are freely available, but there are also countries (Finland,
Hungary, Spain, and Turkey) where there is no such source of information and everything is subject to
the consent of the data holder. For some sources, part of the data is public and another part requires
some permission (figure 3).
This project has received funding from the European Union’s Horizon 2020
research and innovation programme under grant agreement N° 862695 12Deliverable 2.2 Stocktaking on soil quality indicators and associated
decision support tools, including ICT tools
18
16 geodatabases databases other
14
12
10
8
6
4
2
0
Estonia
Hungary
Italy
Latvia
Belgium
Denmark
France
Norway
Sweden
Austria
Finland
Germany
Netherlands
Poland
Spain
Ireland
Portugal
Slovakia
Slovenia
Czechia
Lithuania
Turkey
United Kingdom
Switzerland
Figure 2: Format of data sources (description “other” represents sources where this information is
missing).
18
16 permission free both types other
14
12
10
8
6
4
2
0
Estonia
Italy
Belgium
Denmark
France
Latvia
Norway
Sweden
Finland
Poland
Austria
Germany
Ireland
Netherlands
Slovenia
Lithuania
Turkey
Portugal
Slovakia
Czechia
Hungary
United Kingdom
Spain
Switzerland
Figure 3: Availability of data sources (description “both types” represents sources for which: part of
the data is public and another part requires some permission; description “other” represent sources
where this information is missing).
Information on soil characteristics is mostly available from single sampling campaigns and slightly less
from still active monitoring (figure 4). In some cases, the monitoring was finished, or in other cases,
This project has received funding from the European Union’s Horizon 2020
research and innovation programme under grant agreement N° 862695 13Deliverable 2.2 Stocktaking on soil quality indicators and associated
decision support tools, including ICT tools
information about sampling was not provided. These information sources are included in the "other"
category.
18
16 monitoring single campaign other
14
12
10
8
6
4
2
0
Belgium
Estonia
France
Latvia
Denmark
Italy
Norway
Sweden
Finland
Poland
Austria
Germany
Netherlands
Lithuania
Slovakia
Slovenia
Hungary
Ireland
Portugal
Czechia
Spain
Turkey
United Kingdom
Switzerland
Figure 4: Sampling strategies (description “other” represents finished monitoring or sources where
information about sampling strategy is missing).
18
16 only topsoil whole profile other
14
12
10
8
6
4
2
0
Estonia
Italy
Belgium
Denmark
France
Latvia
Switzerland
Turkey
Finland
Norway
Poland
Austria
Sweden
Germany
Ireland
Lithuania
Netherlands
Slovenia
Czechia
Hungary
Portugal
Slovakia
Spain
United Kingdom
Figure 5: Sampling depth (description “other” represents sources where information about sampling
depth is missing).
It can be stated that most countries have data available from the entire depth of the soil profile (figure
5). Finland and Turkey report data only from topsoil layer. In Norway questionnaire this information is
This project has received funding from the European Union’s Horizon 2020
research and innovation programme under grant agreement N° 862695 14Deliverable 2.2 Stocktaking on soil quality indicators and associated
decision support tools, including ICT tools
missing. In the 21 countries, there exists a declared connection of soil quality indicators with terrain
parameters (15 countries with digital terrain model and 6 countries with information about terrain
slope). Finland, Sweden and Latvia do not mention this information.
4.1. Soil quality indicators (questionnaire parts A, B, C)
We selected 8 groups of soil quality indicators representing the basic properties of soils and ways of
soil degradation, which together provide an overall picture of soil quality. These groups describe
namely:
1) Evaluation of soil organic matter in terms of quantity, stocks and quality, as well as the time
frame, i.e. changes in carbon content over time.
2) Evaluation of nutrient status of soils including contents of main macronutrients and also
micronutrients.
3) Evaluation of soil reaction measured through actual and potential pH as well as evaluation of
related information about soil sorption complex through cation exchange capacity and base
saturation.
4) Evaluation of soil physical parameters as texture, stoniness, porosity, and bulk density.
5) Evaluation of soil water content and behaviour through water field capacity, wilting point,
available water capacity, and infiltration.
6) Description of physical degradation of soils including soil compaction (as a parameter using
soil resistance), soil structure degradation (as a parameter using soil structure stability
measurement), and soil erosion.
7) Description of chemical degradation of soils including contamination with potentially toxic
elements (mainly As, Cd, Co, Cr, Cu, Hg, Ni, Pb, Zn) and organic pollutants (mainly OCPs –
organochlorine pesticides; PAHs – polycyclic aromatic hydrocarbons; PCBs – polychlorinated
biphenyls), and salinization (as a parameter often using electric conductivity of soils).
8) Evaluation of biological parameters of soils especially biological activity (respiration),
potentially mineralizable nitrogen, microbial biomass content, abundance of specific groups
of organisms (micro-, meso-, macroedaphon), or various enzymes measurement.
At the outset, it should be emphasized that the following results are based only on data from a
questionnaire survey. Due to this, some data in specific countries may be actually monitored and
evaluated, but they were not in the results, because they were not filled in the questionnaires.
This project has received funding from the European Union’s Horizon 2020
research and innovation programme under grant agreement N° 862695 15Deliverable 2.2 Stocktaking on soil quality indicators and associated
decision support tools, including ICT tools
4.1.1. Processing of results by country
Evaluation of soil organic matter
Most countries monitor the concentration of carbon in the soil (table 1). For approximately 20 %
countries, there is no information on the changing (shift) of carbon concentration over time, i.e. on a
possible decrease in amount of carbon in the soil. About a third of countries lack very important
information on soil carbon stock, which is used in calculations of carbon cycle fluxes. The least
information is on the qualitative characteristics of organic matter. These parameters are not
monitored or reported by more than half of the countries. This is a very important characteristic of the
soil both in relation to vegetation and the stabilization of carbon in the soil.
Table 1: Soil organic matter evaluation in participating countries (Carbon (C) concentration, carbon
stock, soil organic matter quality, and carbon concentration changing (shift) of over time.
Soil organic matter (SOM)
Country C concentration C stock SOM quality C shift
Austria yes yes yes yes
Belgium yes yes no no
Czechia yes no yes yes
Denmark yes yes yes yes
Estonia yes yes no yes
Finland yes yes no yes
France yes yes yes yes
Germany yes yes no yes
Hungary yes no yes yes
Ireland yes yes yes yes
Italy yes yes no yes
Latvia yes yes no yes
Lithuania yes yes yes no
Netherlands yes yes yes yes
Norway no no no no
Poland yes no no yes
Portugal yes no no no
Slovakia yes yes yes yes
Slovenia yes no no no
Spain yes yes yes yes
Sweden yes no no yes
Switzerland yes yes no yes
Turkey yes yes no yes
United Kingdom yes yes no yes
%* 96 71 42 79
* Percentage expression of positive results in questionnaires obtained from 24 countries.
This project has received funding from the European Union’s Horizon 2020
research and innovation programme under grant agreement N° 862695 16Deliverable 2.2 Stocktaking on soil quality indicators and associated
decision support tools, including ICT tools
Evaluation of nutrient status of soils
Most countries collect and evaluate the amount of basic macronutrients in soils (table 2). In case of
micronutrients, the contents of Cu, Mn and Zn are the most frequently determined. B, S, and Se are
also monitored in about half of the countries.
Table 2: Nutrient status of soils evaluation in participating countries. (Ntot – total N content; Noth –
content of other N forms; Xav – contents of available nutrients form)
Nutrient status
macronutrients micronutrients
Country Ntot Noth Pav Kav Caav Mgav B Cu Fe Mn S Se Si Zn other
Austria yes yes yes yes yes yes yes yes yes yes yes yes yes yes Na,Cl-,F-,SO42-
Belgium yes no yes yes yes yes no yes no yes no no no yes
Czechia yes yes yes yes yes yes yes yes yes yes yes no no yes Cd
Denmark yes yes yes yes yes yes no no no no no no no no
Estonia yes no yes yes yes yes yes yes yes yes no yes no no Co,Mo
Finland no no yes yes yes yes yes yes yes yes yes no no yes Al, Mo
France yes yes yes yes yes yes yes yes yes yes yes yes yes yes Na,Al
Germany yes yes yes yes yes yes yes yes no yes yes yes yes yes
Hungary yes yes yes yes yes yes yes yes no yes yes yes no yes
Ireland yes yes yes yes yes yes yes yes yes yes yes yes yes yes Mo
Italy yes yes yes yes yes yes yes yes yes yes no no no yes Na,Al,Pb,Ba
Latvia yes yes yes yes yes yes yes yes no yes yes no no yes
Lithuania yes yes yes yes yes yes yes yes no yes yes yes yes yes
Netherlands yes yes yes yes yes yes yes yes no yes yes yes yes yes Mo
Norway no no no no no no no no no no no no no no
Poland yes yes yes yes yes yes yes yes no yes yes yes yes yes
Portugal no no no no no no no no no no no no no no
Slovakia yes yes yes yes no yes no yes no yes no no no yes
Slovenia yes no yes yes no no no no no no no no no no
Spain yes yes yes yes yes yes no yes yes yes no no no yes
Sweden yes no yes yes yes yes yes yes no yes yes yes yes yes
Switzerland yes yes yes yes yes yes no no no no no no no no
Turkey no no yes yes yes yes yes yes no yes no no no yes Cu, Mn, Zn, B
UK yes yes yes yes yes yes no yes yes yes yes yes yes yes Na,Al,Co,Pb,Ni
%* 83 67 92 92 83 88 63 79 38 79 54 46 38 75
* Percentage expression of positive results in questionnaires obtained from 24 countries.
This project has received funding from the European Union’s Horizon 2020
research and innovation programme under grant agreement N° 862695 17Deliverable 2.2 Stocktaking on soil quality indicators and associated
decision support tools, including ICT tools
Evaluation of soil reaction and soil sorption complex
As with the amount of carbon and macronutrients, the parameters describing the soil reaction and the
sorption complex are among the well-captured parameters (over 70 %) across all European countries
(table 3). A problem is in case of potential pH, as some countries use the KCl extract, some other
countries use CaCl2 extract. Therefore, some harmonization is necessary, possibly using some
coefficients.
Table 3: Soil reaction and soil sorption complex evaluation in participating countries. (pHact – (active)
pH measured in soil solution or water extract of soil; pHpot- (potential) pH measured in salt (KCl, or
CaCl2)) solution extract of soil; CEC – cation exchange capacity; BS – base saturation)
Soil reaction and sorption complex
Country pHact pHpot acidification CEC BS
Austria yes yes no yes yes
Belgium yes yes no yes no
Czechia yes yes yes yes yes
Denmark yes yes yes yes yes
Estonia no yes yes yes yes
Finland yes no yes no no
France yes yes yes yes yes
Germany yes yes yes yes yes
Hungary yes yes yes yes yes
Ireland yes yes yes yes yes
Italy yes yes no yes yes
Latvia yes yes yes yes yes
Lithuania no yes yes no no
Netherlands yes yes yes yes yes
Norway no no no no no
Poland yes yes yes yes yes
Portugal yes no no yes yes
Slovakia yes yes yes yes yes
Slovenia yes yes yes yes yes
Spain yes no yes yes no
Sweden yes no yes yes yes
Switzerland yes yes yes yes yes
Turkey no no yes yes yes
United Kingdom yes yes yes no yes
%* 83 75 79 83 79
* Percentage expression of positive results in questionnaires obtained from 24 countries.
This project has received funding from the European Union’s Horizon 2020
research and innovation programme under grant agreement N° 862695 18Deliverable 2.2 Stocktaking on soil quality indicators and associated
decision support tools, including ICT tools
Evaluation of physical parameters of soil
Texture (100 % of participating countries) and bulk density (83 % of participating countries) are also
well supported by soil parameters across European countries (table 4). On the contrary, porosity or
stoniness are observed in only about half of the countries.
Table 4: Physical parameters evaluation in participating countries.
Physical parameters
Country texture stoniness porosity bulk density
Austria yes yes yes yes
Belgium yes yes no yes
Czechia yes yes yes yes
Denmark yes no no yes
Estonia yes yes yes yes
Finland yes no no no
France yes yes no yes
Germany yes yes no yes
Hungary yes no yes yes
Ireland yes yes yes yes
Italy yes yes yes yes
Latvia yes no no no
Lithuania yes no yes yes
Netherlands yes no no yes
Norway yes no no no
Poland yes no no no
Portugal yes no yes yes
Slovakia yes yes yes yes
Slovenia yes yes yes yes
Spain yes no yes yes
Sweden yes no yes yes
Switzerland yes yes yes yes
Turkey yes no no yes
United Kingdom yes yes yes yes
%* 100 50 58 83
* Percentage expression of positive results in questionnaires obtained from 24 countries.
This project has received funding from the European Union’s Horizon 2020
research and innovation programme under grant agreement N° 862695 19Deliverable 2.2 Stocktaking on soil quality indicators and associated
decision support tools, including ICT tools
Evaluation of water content in the soil
Evaluation of water content is one of the less monitored soil characteristics in participating countries
(table 5). Assessments of water infiltration into the soil are mentioned by only 4 of the 24 countries.
Wilting point and available water capacity are evaluated in less than half of the countries. Just over
half of the countries surveyed receive only the water field capacity measuring. This can also be
considered as a knowledge gap, as this information is important in terms of water retention in the soil,
influencing hydrological cycles and thus fulfilling one of the basic functions of the soil.
Table 5: Soil water content evaluation in participating countries.
Soil water content
available water
Country infiltration water field capacity wilting point
capacity
Austria yes yes yes yes
Belgium no no no no
Czechia no no no no
Denmark no yes yes yes
Estonia no no no no
Finland no no no no
France no no no no
Germany no yes no yes
Hungary no yes yes yes
Ireland yes no no no
Italy no yes yes yes
Latvia no no no no
Lithuania no yes yes yes
Netherlands yes yes yes yes
Norway no no no no
Poland no no no no
Portugal no yes yes yes
Slovakia no no no no
Slovenia no no no no
Spain no yes yes yes
Sweden no yes no no
Switzerland no yes no no
Turkey no yes yes yes
United Kingdom yes yes yes yes
%* 17 54 42 46
* Percentage expression of positive results in questionnaires obtained from 24 countries.
This project has received funding from the European Union’s Horizon 2020
research and innovation programme under grant agreement N° 862695 20Deliverable 2.2 Stocktaking on soil quality indicators and associated
decision support tools, including ICT tools
Description of physical degradation of soils
Indicators of soil quality can also include degradation processes evaluated using various soil properties.
Two types of questions were made in the questionnaire. 1) Whether the different degradation
processes of the soil in a given information source are evaluated in any way (the answers were only
yes or no). 2) Which specific soil parameters are evaluated in the given information source and by
which method (selected of them were additionally assigned to degradation processes). Physical
degradation parameters are shown in table 6. This table documents that the measurement of specific
soil parameters such as soil resistance or soil structure (aggregates) stability does not completely
correspond to the evaluation of the actual degradation processes. While only five countries report soil
resistance measurements, more than half of the countries report soil compaction evaluation.
Conversely, more than half of the countries somehow determine the stability of the soil structure, but
less than half evaluate the soil structure degradation. In general, these indicators are not widely
monitored soil parameters in participating countries. Compared to that, soil erosion is assessed in 71
% of the countries, which demonstrates the importance of this degradation process in agricultural
soils.
Table 6: Physical soil degradation evaluation in participating countries.
Physical degradation
soil resistance soil compaction soil structure soil structure erosion
Country
measurement evaluation measurement degradation evaluation
Austria yes yes yes yes yes
Belgium no no yes no yes
Czechia no yes no yes yes
Denmark no no no no yes
Estonia no yes no no yes
Finland no no no no no
France no yes no yes yes
Germany no yes yes yes yes
Hungary yes yes no yes yes
Ireland no yes yes yes no
Italy no yes yes yes yes
Latvia no no no no yes
Lithuania no no yes no yes
Netherlands yes yes yes yes yes
Norway no no no no yes
Poland no no no no yes
Portugal no no no no no
Slovakia no yes yes no yes
Slovenia no no yes yes yes
Spain no yes yes yes no
Sweden yes yes yes no no
Switzerland yes no yes no yes
Turkey no no no no no
United Kingdom no yes yes yes no
%* 21 54 54 46 71
* Percentage expression of positive results in questionnaires obtained from 24 countries.
This project has received funding from the European Union’s Horizon 2020
research and innovation programme under grant agreement N° 862695 21Deliverable 2.2 Stocktaking on soil quality indicators and associated
decision support tools, including ICT tools
Description of chemical degradation of soils
Chemical degradation parameters are shown in tables 7 and 8. While contamination with potentially
toxic elements, especially Cd, Co, Cr, Cu, Ni, Pb and Zn (less Hg and As) is one of the well-monitored
soil parameters in Europe, contamination with organic pollutants is addressed in only about one third
of countries. Soil salinization is also not widely monitored soil quality parameters, which, however,
corresponds well with the distribution larger areas of naturally saline soils (France, Germany, Hungary,
Italy, Netherlands, Slovakia, Spain, and Turkey). In countries where salinization does not represent a
problem, it is not evaluated.
Table 7: Soil chemical degradation evaluation in participating countries – contamination with
potentially toxic elements.
Chemical degradation – contamination with potentially toxic elements – PTE
Country Al As Cd Co Cr Cu Hg Ni Pb Zn other PTEs
Austria no yes yes yes yes yes yes yes yes yes Be,V
Belgium no no no no no no no no no no
Czechia yes yes yes yes yes yes yes yes yes yes Be,Mo,V
Denmark no no no no no no no no no no 0
Estonia no no yes yes yes yes yes yes yes yes Sn
Finland yes no yes yes yes yes no yes yes yes
France no yes yes yes yes yes yes yes yes yes Se,Mo,Tl
Germany no yes yes yes yes yes yes yes yes yes Be,V
Hungary no yes yes yes yes yes yes yes yes yes Ba,Mo,Sn
Ireland yes yes yes yes yes no yes yes yes no Fe
Italy no no yes yes yes yes no yes yes yes
Latvia yes yes yes yes yes yes yes yes yes yes many others
Lithuania no yes yes yes yes yes yes yes yes yes V
Netherlands no yes yes yes yes yes yes yes yes yes Fe
Norway no no no no no no no no no no
Poland yes yes yes yes yes yes yes yes yes yes Be,Sr,Ba,Li,La,Mn,Fe
Portugal no no yes no no yes no yes no yes
Slovakia no yes yes yes yes yes yes yes yes yes Se
Slovenia no yes yes yes yes yes yes yes yes yes Mo,F-
Spain no yes yes yes yes yes no yes yes yes Be,V
Sweden no yes yes yes yes yes yes yes yes yes V
Switzerland no no no no no yes no no no yes Cu,Zn
Turkey no no yes yes yes yes no yes yes yes
Ag,Pt,Fe,Mn,Sb,Se,
United Kingdom yes yes yes yes yes yes yes yes yes yes
Sr,Mo,Ti,Ba,B,Li,Na
%* 25 63 83 79 79 83 63 83 79 83
* Percentage expression of positive results in questionnaires obtained from 24 countries.
This project has received funding from the European Union’s Horizon 2020
research and innovation programme under grant agreement N° 862695 22Deliverable 2.2 Stocktaking on soil quality indicators and associated
decision support tools, including ICT tools
Table 8: Soil chemical degradation evaluation in participating countries – contamination with organic
pollutants and salinization (OCPs – organochlorine pesticides; PAHs – polycyclic aromatic
hydrocarbons; PCBs – polychlorinated biphenyls; POPs – persistent organic pollutants; C10-C40 –
petroleum hydrocarbons in the range of C10-C40).
Chemical degradation – contamination with organic pollutants – OP Salinization
electric
Country OCPs PAHs PCBs other OP salinity
conductivity
Austria yes yes yes many others (S1) no yes
Belgium no no no no no
Czechia yes yes yes C10-C40, pesticides no no
Denmark no no no no no
Estonia no no no Fungi-,herbi-,insecticide no no
Finland no no no no yes
France yes yes yes dioxins, furans, triazines yes yes
Relative binding strength of
Germany yes yes yes yes yes
isoproturon and copper
Hungary no no no yes no
Ireland no no no no yes
Italy no no no yes yes
Latvia no yes no no yes
Lithuania yes yes yes C10-C40 no yes
Netherlands yes yes yes yes yes
Norway no no no no no
Poland yes yes no no yes
Portugal no no no no no
Slovakia no yes no yes yes
mineral oils, phenols, benzene,
Slovenia yes yes yes no no
ethylbenzene, toluene, xylene
Spain no no no herbicides yes yes
Sweden no no no no no
Switzerland no no no no no
Turkey no no no yes yes
United Kingdom no yes yes POPs, dioxins, furans no yes
%* 33 46 33 33 58
* Percentage expression of positive results in questionnaires obtained from 24 countries.
This project has received funding from the European Union’s Horizon 2020
research and innovation programme under grant agreement N° 862695 23Deliverable 2.2 Stocktaking on soil quality indicators and associated
decision support tools, including ICT tools
Evaluation of biological parameters of soils
Biological parameters are generally the least frequently evaluated indicators of soil quality in Europe,
as shown in table 9. Biological activity is most often evaluated through soil respiration, but even that
only in seven of the respondent countries.
Table 9: Biological parameters evaluation in participating countries.
Biological parameters
pot. fungal bacterial microbial macro micro meso earth-
Country resp.
min. N biomass biomass biomass edaphon edaphon edaphon worms
nematodes enzy.
Austria yes yes yes no no yes yes no no yes yes
Belgium no no no no no no no no no no no
Czechia no no no no no no no no no no no
Denmark no no no no no no no no no no no
Estonia no no no no yes no no no yes no no
Finland no no no no no no no no no no no
France yes no yes yes yes yes yes yes yes yes yes
Germany no no no no no yes yes yes no no no
Hungary no no no no no no no yes no no no
Ireland yes no yes yes yes no no no yes yes yes
Italy no no no yes no no no no yes no no
Latvia no no no no no no no no no no no
Lithuania yes no no no yes no no no no no yes
Netherlands yes yes yes yes yes no no no yes yes no
Norway no no no no no no no no no no no
Poland no no no no no no no no no no no
Portugal no no no no no no no no no no no
Slovakia no no no no no no no no no no no
Slovenia no no no no no no no no no no no
Spain no no no no no no no no no no no
Sweden no no no no no no no no no no no
Switzerland yes yes no no yes no no no yes yes yes
Turkey no no no no no no no no no no no
UK yes yes yes yes no no no yes no no no
%* 29 17 21 21 25 13 13 17 25 21 21
countries Other biological parameters
Austria potential nitrification, carabid beetles, hoverfly, mycorrhiza population, roots
Estonia abundance of Collembola
France fungal diversity, bacterial diversity, plant diversity, mesoedafon - soil microarthropods
(Collembola, Mites), potential metabolic diversity, microbial taxonomic diversity, gene
expression of metallothionein, small mammals: bioaccumulation of metallic elements, SET
index : sum of excess of transfers in Snails, omega-3 fatty acid, 16 rRNA, pcaH
Hungary decline of soil biodiversity, individuals/800 cm3 soil, number of microarthropods in a given time-
frame, infrared based detection of animals falling into the trap
Ireland phospholipid fatty acids composition, next generation sequencing, 16S rRNA, ITS
Italy QBSar
Lithuania microbial community analysis (AWCD, richness, diversity), carbon sources
Netherlands 3H-thy incorporation, 14C-Leu incorporation, fungal activity, Enchytraeids density and diversity,
Microarthropods density and diversity, root density
Switzerland Arthropods, AMF spores, microbiome, decomposition, N2O emissions, soil disease resistance
(Pseudomonas)
UK DNA metabarcoding
* Percentage expression of positive results in questionnaires obtained from 24 countries.
This project has received funding from the European Union’s Horizon 2020
research and innovation programme under grant agreement N° 862695 24Deliverable 2.2 Stocktaking on soil quality indicators and associated
decision support tools, including ICT tools
4.1.2. Processing of results by environmental zones
Our questionnaire survey was focused on soil quality indicators used, for example, in legislation or
policy decisions. Therefore, the obtained information sources usually have a nationwide or regional
(according to the state organization) scope and it is not easy to separate environmental zones (figure
6) in them. Our survey (24 participating countries) therefore cover all environmental zones in Europe.
Table 10 shows the representation of individual environmental zones in individual states and simplifies
the division of states into these zones. The countries are sorted and grouped according to the similarity
of the represented environmental zones. But the division into groups according to environmental
zones did not bring any fundamental and interesting outputs. The distribution by European regions
provides results that are more telling.
The table also shows the classification of countries into the main European regions (figure 6).
A B
Figure 6: A – Pedoclimatic zones of Europe according to Metzger et al. (2005); B – Main European
regions. Source: Der Ständige Ausschuss für geographische Namen (StAGN)
https://commons.wikimedia.org/wiki/File:Grossgliederung_Europas-en.svg [22.7.20]
This project has received funding from the European Union’s Horizon 2020
research and innovation programme under grant agreement N° 862695 25Deliverable 2.2 Stocktaking on soil quality indicators and associated
decision support tools, including ICT tools
Table 10: Representation of individual environmental zones in individual states and the classification
of countries into the main European regions
Relevant Simplified Main
Country
environmental zones environmental zones European regions
Norway ALN (BOR, ATN, NOC) ALN Northern
Finland BOR (ALN, NEM) BOR Northern
Sweden BOR, ALN, NEM (CON) BOR, NEM Northern
Estonia NEM (BOR) NEM Central
Latvia NEM (CON, BOR) NEM Central
Lithuania NEM (CON) NEM Central
Poland CON (NEM) CON Central
Czechia CON (ALS, PAN) CON Central
Germany CON, ATN (ATC, ALS, BOR) CON, ATN Central
Switzerland NOC, ALS (ATC) CON, ALS Central
Austria CON, ALS CON, ALS Central
Slovakia CON (ALS, PAN) CON Central
Hungary PAN (MDM) PAN Central
Denmark ATN (CON) ATN Northern
Netherlands ATN, ATC (CON) ATN, ATC Western
United Kingdom ATN, ATC ATN, ATC Western
Ireland ATC (ATN) ATC Western
Belgium ATC (CON) ATC Western
France ATC, LUS, MDM, MDN, ALS (CON, MDS) ATC, LUS Western
Spain MDS, MDN, MDM (LUS, ALS) MDS Southern
Portugal LUS, MDN, MDS LUS, MDN, MDS Southern
Italy MDN, MDM, ALS (MDS) MDN, MDM Southern
Slovenia ALS (MDM, MDN, CON) ALS Central
Turkey ANA (MDM,MDS, MDN) ANA Turkey
4.1.3. Processing of results by European regions
Figure 7 shows the evaluation of basic soil parameters including characteristics of soil organic matter,
soil reaction, soil sorption complex and nutrient status in individual European regions. The figure shows
that except for some micronutrients, all soil properties are evaluated in all European regions.
Micronutrients S, Se, Si are not determined in South European countries at all. Interestingly, in some
regions (northern and southern Europe) pH measurement in salt (KCl, or CaCl2) solution extract of soil
is not common. In general, Western and Central Europe are well covered by information on these soil
quality indicators. However, it should still be emphasized that the results are influenced by the quality
of the questionnaire. For example, there are few specific parameters completed in the Norwegian
questionnaire, which is not negligible when evaluating 4 countries in the region of Northern Europe.
This project has received funding from the European Union’s Horizon 2020
research and innovation programme under grant agreement N° 862695 26Deliverable 2.2 Stocktaking on soil quality indicators and associated
decision support tools, including ICT tools
%
Figure 7: Soil organic matter (SOM) characteristics, soil reaction, soil sorption complex parameters,
and nutrient status of soils evaluation in participating countries divided to European regions: northern
(4 countries), central (11 countries), and western Europe (5 countries), and southern Europe with
Turkey (4 countries). (pHact – (active) pH measured in soil solution or water extract of soil; pHpot-
(potential) pH measured in salt (KCl, or CaCl2)) solution extract of soil; CEC – cation exchange capacity;
BS – base saturation; Ntot – total N content; Noth – content of other N forms)
Much larger differences can be seen in the evaluation of physical parameters of soils and in the
evaluation of soil degradation (figure 8). Only 18 of the 28 selected properties or parameters are
evaluated in all regions of Europe. Contamination by organic pollutants or parameters of water
infiltration into the soil are evaluated only in some countries of Western and Central Europe. The
southern part of Europe stands out in the assessment of the soil water parameters.
This project has received funding from the European Union’s Horizon 2020
research and innovation programme under grant agreement N° 862695 27You can also read