Field observational constraints on the controllers in glyoxal (CHOCHO) reactive uptake to aerosol
←
→
Page content transcription
If your browser does not render page correctly, please read the page content below
Research article
Atmos. Chem. Phys., 22, 805–821, 2022
https://doi.org/10.5194/acp-22-805-2022
© Author(s) 2022. This work is distributed under
the Creative Commons Attribution 4.0 License.

           Field observational constraints on the controllers in
               glyoxal (CHOCHO) reactive uptake to aerosol
            Dongwook Kim1,2,3 , Changmin Cho2,a , Seokhan Jeong2,b , Soojin Lee2 , Benjamin A. Nault3,c ,
       Pedro Campuzano-Jost3 , Douglas A. Day3 , Jason C. Schroder3,d , Jose L. Jimenez3 , Rainer Volkamer3 ,
             Donald R. Blake4 , Armin Wisthaler5,6 , Alan Fried7 , Joshua P. DiGangi8 , Glenn S. Diskin8 ,
      Sally E. Pusede9 , Samuel R. Hall10 , Kirk Ullmann10 , L. Gregory Huey11 , David J. Tanner11 , Jack Dibb12 ,
                                    Christoph J. Knote13 , and Kyung-Eun Min2
                                      1 Department        of Physics and Photon Science,
                                Gwangju Institute of Science and Technology, Gwangju, South Korea
                                2 School of Environmental Sciences and Environmental Engineering,

                                Gwangju Institute of Science and Technology, Gwangju, South Korea
                       3 Department of Chemistry and CIRES, University of Colorado, Boulder, CO, USA
                                4 Department of Chemistry, University of California, Irvine, CA, USA
                 5 Institute for Ion Physics and Applied Physics, University of Innsbruck, Innsbruck, Austria
                                    6 Department of Chemistry, University of Oslo, Oslo, Norway
                      7 Institute of Arctic and Alpine Research, University of Colorado, Boulder, CO, USA
                                        8 NASA Langley Research Center, Hampton, VA, USA
                  9 Department of Environmental Sciences, University of Virginia, Charlottesville, VA, USA
                                       10 Atmospheric Chemistry Observations and Modeling,

                                    National Center for Atmospheric Research, Boulder, CO, USA
             11 School of Earth and Atmospheric Sciences, Georgia Institute of Technology, Atlanta, GA, USA
                     12 Earth Systems Research Center, Institute for the Study of Earth, Oceans, and Space,

                                           University of New Hampshire, Durham, NH, USA
                              13 Model-Based Environmental Exposure Science, Faculty of Medicine,

                                             University of Augsburg, Augsburg, Germany
                             a now at: Troposphere (IEK-8), Institute of Energy and Climate Research,

                                             Forschungszentrum Jülich, Jülich, Germany
                    b now at: Environmental Assessment group, Korea Environment Institute, Sejong, Korea
              c now at: Center for Aerosol and Cloud Chemistry, Aerodyne Research Inc., Billerica, MA, USA
                      d now at: Colorado Department of Public Health and Environment, Denver, CO, USA

                                 Correspondence: Kyung-Eun Min (kemin@gist.ac.kr)

                                 Received: 11 August 2021 – Discussion started: 31 August 2021
                    Revised: 29 November 2021 – Accepted: 29 November 2021 – Published: 18 January 2022

      Abstract. Glyoxal (CHOCHO), the simplest dicarbonyl in the troposphere, is a potential precursor for sec-
      ondary organic aerosol (SOA) and brown carbon (BrC) affecting air quality and climate. The airborne measure-
      ment of CHOCHO concentrations during the KORUS-AQ (KORea–US Air Quality study) campaign in 2016
      enables detailed quantification of loss mechanisms pertaining to SOA formation in the real atmosphere. The
      production of this molecule was mainly from oxidation of aromatics (59 %) initiated by hydroxyl radical (OH).
      CHOCHO loss to aerosol was found to be the most important removal path (69 %) and contributed to roughly
      ∼ 20 % (3.7 µg sm−3 ppmv−1 h−1 , normalized with excess CO) of SOA growth in the first 6 h in Seoul Metropoli-
      tan Area. A reactive uptake coefficient (γ ) of ∼ 0.008 best represents the loss of CHOCHO by surface uptake
      during the campaign. To our knowledge, we show the first field observation of aerosol surface-area-dependent

Published by Copernicus Publications on behalf of the European Geosciences Union.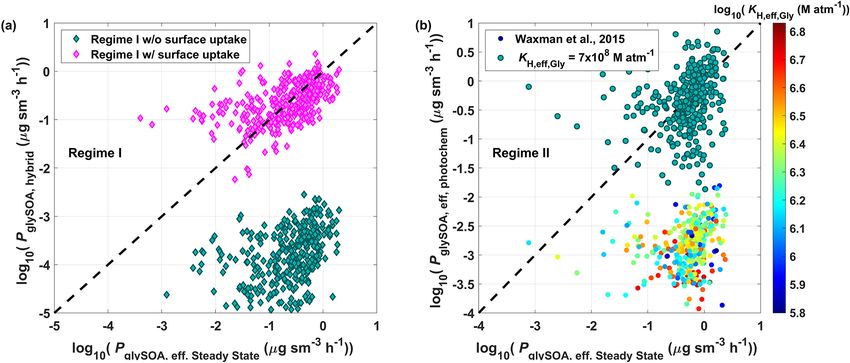
806       D. Kim et al.: Field observational constraints on the controllers in glyoxal (CHOCHO) reactive uptake to aerosol

       (Asurf ) CHOCHO uptake, which diverges from the simple surface uptake assumption as Asurf increases in ambi-
       ent condition. Specifically, under the low (high) aerosol loading, the CHOCHO effective uptake rate coefficient,
       keff,uptake , linearly increases (levels off) with Asurf ; thus, the irreversible surface uptake is a reasonable (unrea-
       sonable) approximation for simulating CHOCHO loss to aerosol. Dependence on photochemical impact and
       changes in the chemical and physical aerosol properties “free water”, as well as aerosol viscosity, are discussed
       as other possible factors influencing CHOCHO uptake rate. Our inferred Henry’s law coefficient of CHOCHO,
       7.0 × 10⁸ M atm−1 , is ∼ 2 orders of magnitude higher than those estimated from salting-in effects constrained
       by inorganic salts only consistent with laboratory findings that show similar high partitioning into water-soluble
       organics, which urges more understanding on CHOCHO solubility under real atmospheric conditions.

1   Introduction                                                     Volkamer et al., 2009; Sumner et al., 2014), and relative hu-
                                                                     midity (RH) (Curry et al., 2018; Gen et al., 2018; Shen et al.,
Glyoxal (CHOCHO), the simplest α-dicarbonyl, has sig-                2018).
nificant importance in air quality and climate. Since this              In the presence of inorganic salts such as ammonium sul-
molecule is secondarily produced from oxidations of vari-            fate (AS) and ammonium nitrate (AN), CHOCHO’s solu-
ous biogenic (e.g., isoprene) (Li et al., 2016; Chan Miller et       bility in aerosol increases several orders of magnitude com-
al., 2017) and anthropogenic (e.g., aromatics) (Volkamer et          pared to solubility in pure water, which is known as “salting-
al., 2001; Nishino et al., 2010) volatile organic compounds          in” effect (Kampf et al., 2013). This can lead to a large frac-
(VOCs) with different yields. Due to this character, there           tion of CHOCHO being oxidized in the aqueous phase, thus
have been many attempts to use the CHOCHO to formalde-               resulting in less volatile products (Knote et al., 2014; Wax-
hyde ratio (RGF ) for parent VOC speciation (MacDonald et            man et al., 2015; Sareen et al., 2017; Ling et al., 2020). In
al., 2012; Kaiser et al., 2015; Chan Miller et al., 2016; Li         addition, CHOCHO was observed to have high solubility to
et al., 2016; Zarzana et al., 2017, 2018). In addition, CHO-         some water soluble organic acid aerosol seeds such as ful-
CHO has also been proposed as an important precursor for             vic acid, l-tartaric acid, and dl-malic acid (Corrigan et al.,
secondary organic aerosol (SOA) formation over the past              2008; Volkamer et al., 2009; Kampf et al., 2013). More re-
few decades (Jang and Kamens, 2001; Liggio et al., 2005b;            cently, more complex controls such as the acceleration of
Volkamer et al., 2007) due to its high water solubility (Zhou        CHOCHO uptake processes in the presence of other gaseous
and Mopper, 1990; Kroll et al., 2005; Ip et al., 2009; Kampf         organic species have been reported (Qin et al., 2020). Over-
et al., 2013), oligomerization potential (Whipple, 1970; Lig-        all, most of these studies have concluded that CHOCHO has
gio et al., 2005a; Loeffler et al., 2006; Galloway et al., 2009),    a significant role in SOA formation. However, the solubility
and aqueous-phase oxidation in cloud droplets and aerosol            of CHOCHO in ambient conditions is highly uncertain, since
liquid water (Galloway et al., 2009; Volkamer et al., 2009;          the studies that constrained CHOCHO solubility in ambient
Ervens and Volkamer, 2010; Rossignol et al., 2014). The lat-         conditions are rare.
ter can be climate-relevant owing to the production of light-           Many recent regional and global modeling studies (Fu et
absorbing brown carbon components (Powelson et al., 2014;            al., 2008; Knote et al., 2014; Hu et al., 2017; Stadtler et al.,
Marrero-Ortiz et al., 2019; De Haan et al., 2020a, b). Due to        2018; Bates and Jacob, 2019; Liu et al., 2020; Qiu et al.,
its importance in atmospheric processes, detailed CHOCHO             2020; Xu et al., 2020), as well as several works constrained
loss mechanisms need to be better constrained.                       by in situ field observations (Volkamer et al., 2007; Washen-
   CHOCHO losses by photolysis (Feierabend et al., 2009)             felder et al., 2011; Li et al., 2016; Ling et al., 2020), have
and OH oxidation (Feierabend et al., 2008) are relatively            reported that CHOCHO contributes 0 % to 25 % to SOA for-
well-known pathways compared to aerosol uptake. There                mation. This large variability resulted from the different con-
have been many laboratory efforts to investigate the under-          ditions of the individual studies, focusing on different VOC
lying mechanisms of CHOCHO’s aerosol loss. Liggio et                 precursors, biogenic (Li et al., 2016; Xu et al., 2020) vs. an-
al. (2005a, b) showed that CHOCHO aerosol uptake loss                thropogenic sources (Volkamer et al., 2007; Liu et al., 2020;
could be as important as photolysis and OH oxidation un-             Qiu et al., 2020), and using different simulation tools, such as
der atmospherically relevant chamber conditions, and thus it         0-D box (Volkamer et al., 2007), Lagrangian (Washenfelder
could be an important source of SOA. Further studies con-            et al., 2011), and 3-D transport models (Fu et al., 2008; Knote
ducted since then have shown that the CHOCHO uptake pro-             et al., 2014; Chan Miller et al., 2016; Li et al., 2016; Chan
cess is quite complex and depends on many variables, such            Miller et al., 2017; Sareen et al., 2017; Hu et al., 2017; Liu
as acidity (Liggio et al., 2005b; Gomez et al., 2015; Shi et         et al., 2020; Qiu et al., 2020; Xu et al., 2020). These model
al., 2020), inorganic salts (Kroll et al., 2005; Kampf et al.,       studies were run with (Washenfelder et al., 2011) or without
2013), radiation (Carlton et al., 2007; Galloway et al., 2009;       (Volkamer et al., 2007; Knote et al., 2014) a steady-state as-

Atmos. Chem. Phys., 22, 805–821, 2022                                                    https://doi.org/10.5194/acp-22-805-2022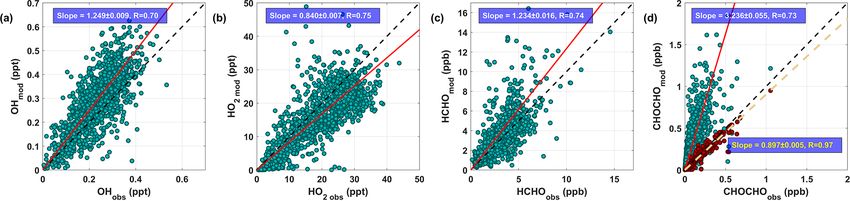
D. Kim et al.: Field observational constraints on the controllers in glyoxal (CHOCHO) reactive uptake to aerosol           807

sumption for CHOCHO and employed different aerosol up-            are available (18 out of 20 RFs, RF no. 01 and no. 03 are
take treatments such as surface uptake only (Washenfelder et      missing; details are given in Table S1 in the Supplement). We
al., 2011; Li et al., 2016) or allowing simultaneous volume       only focused on data that fall in the geographically confined
control processes (Knote et al., 2014; Ling et al., 2020).        area of the Korean peninsula and its coastal region (34.3–
   To add more constraints on the CHOCHO contribution             38◦ N, 125.8–129◦ E), as shown in Fig. 1a, to investigate pro-
to SOA formation, we investigated CHOCHO partitioning             duction and loss mechanisms of CHOCHO under the influ-
to aerosols from an in situ airborne campaign over the Ko-        ence of inland sources in Korea (Peterson et al., 2019).
rean Peninsula, where the emissions of CHOCHO-producing              The list of chemical species and physical parameters used
VOCs are highly variable. Two independent methods – a             in our analysis, together with their measurement techniques,
steady-state approach using a 0-D box model and a hy-             is given in Table 1. Here, we only provide brief descriptions
brid method (Knote et al., 2014) using semi-explicit aque-        of the CHOCHO measuring system, CAvity Enhanced Spec-
ous chemistry together with surface uptake – were used and        trometer for Atmospheric Researches (CAESAR), based on
compared to investigate more details in uptake processes of       the same measurement principle and layout as the CHOCHO
CHOCHO. From this work, we found that the simple sur-             instrument at NOAA (National Oceanic and Atmospheric
face uptake approximation is only applicable for low aerosol      Administration) (Min et al., 2016). Air is drawn into the sys-
loading circumstances during the KORUS-AQ (KORea–US               tem via a coaxial overflow inlet (using two kinds of PFA
Air Quality study) campaign. The dependence of these pro-         tubing one with a 0.5 in. outer diameter and the other with
cesses on photochemical activeness, together with evidence        a 0.25 in. outer diameter; total length: < 1.5 m) through a
of insufficient understanding on CHOCHO solubility, espe-         Teflon membrane filter (2 µm pore) to keep the optics clean
cially in low inorganic salt conditions, are discussed.           and to avoid light attenuation by aerosol scattering. The
                                                                  455 nm centered cavity consists of an LED as a light source,
2     Materials and methods                                       collimating optics, and high-reflection mirrors (reflectivity:
                                                                  99.9973 %; effective light path length: up to 12 km), which
We investigated the CHOCHO contribution to SOA forma-             enables us to quantify CHOCHO and NO2 with zeroing er-
tion (hereinafter, glySOA) via comparison of direct observa-      rors of 34 and 80 pptv for 5 s averages (2σ ) and accuracy
tions with an estimate from a diurnal steady-state 0-D box        of 5.8 % and 5.0 %, respectively, using the custom-built re-
model, constrained by in situ airborne precursor measure-         trieving algorithm of the DOASIS software (Kraus, 2006)
ments. The magnitude of the evaluated aerosol enhancement         (fitting range: 438–468 nm). To ensure the best instrumental
owing to CHOCHO uptake is then compared to the results            performance, cavity calibrations were performed every 5 m
from the hybrid scheme similar to Knote et al. (2014). De-        by sequential overflows of He and zero air (30 s injection for
tails on the data treatment, model settings, and the analysis     each).
methods follow.                                                      To analyze the magnitude of glySOA, we only focused
   In addition, aerosol data reported here are at standard tem-   on measurements below 2 km altitude, which includes
perature and pressure (273 K and 1013 hPa) conditions, lead-      the boundary layer in most cases, where the CHOCHO
ing to the unit of µg sm−3 , where sm3 refers to the standard     abundance was higher than CAESAR’s detection limits.
volume in cubic meters. Moreover, the median and interquar-       In addition, CHOCHO data lower than the zeroing error
tile range (25 %–75 %) were used to represent the variabili-      were removed to reduce uncertainty in the calculation
ties in distributions, except as otherwise indicated.             of glySOA; glySOA formation by cloud chemistry was
                                                                  not included in this work as intercepts with cloud were
                                                                  rare (sampling frequency being less than 3 % below 2 km
2.1    Data description
                                                                  altitude). In addition, to constrain the 0-D box model
We used airborne measurements of CHOCHO, taken as part            with DC-8 observations, 1 min merged data (version R6,
of the KORUS-AQ 2016 (KORea and United States – Air               https://doi.org/10.5067/Suborbital/KORUSAQ/DATA01)
Quality study 2016), conducted from 1 May to 10 June 2016,        were used for the measurement parameters with high time
over South Korea, with close collaboration of scientists from     resolution. Meanwhile, for the species with coarser time
South Korea, the USA, and other countries to understand           resolution than 1 min, (i.e., WAS data), a pseudo-1 min
the local, regional, and hemispheric influences on emis-          data generation scheme, similar to that of Schroeder et
sions, chemistry, and air quality (Crawford et al., 2021).        al. (2020), was applied based on the measurements of the
The entire KORUS-AQ 2016 dataset, which was acquired              PTR-TOF-MS (for aromatics and isoprene) and CAMS (for
from various measurement platforms (i.e., aircraft, research      other hydrocarbon compounds such as alkanes, alkenes, and
vessel, satellites, and ground sites), is available from the      alkyne) to match the timestamps; the detailed interpolation
NASA data archive (https://www-air.larc.nasa.gov/missions/        method is described in Sect. S2, Fig. S1, and Table S2 in
korus-aq/, last access: 20 February 2021). The observational      the Supplement. For the comparison of oxalate and OA,
data used in this analysis were taken aboard the NASA DC-         synchronized timestamps with SAGA filter measurements
8 for research flights (RFs) where CHOCHO measurements            were used.

https://doi.org/10.5194/acp-22-805-2022                                             Atmos. Chem. Phys., 22, 805–821, 2022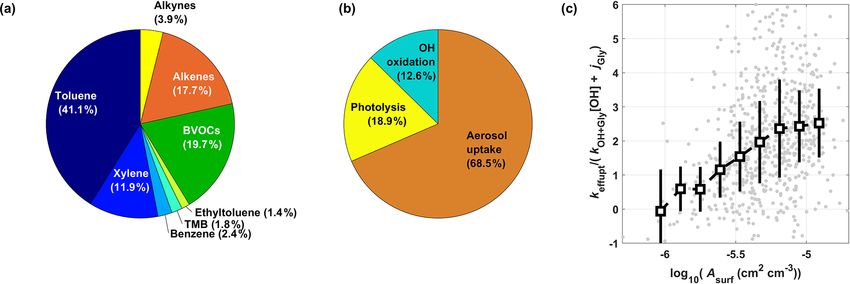
808       D. Kim et al.: Field observational constraints on the controllers in glyoxal (CHOCHO) reactive uptake to aerosol

Figure 1. (a) Flight tacks and the geographically averaged (latitude: 0.14◦ ; longitude: 0.15◦ ) mixing ratios of (b) glyoxal (CHOCHO),
(c) formaldehyde (HCHO), (d) carbon monoxide (CO), (e) benzene, (f) toluene, (g) nitrogen oxides (NOx ), and (h) isoprene (below 2 km
altitude) over Korea measured during the KORUS-AQ campaign. Green and pink circles in (a) represent the Seoul Metropolitan Area (SMA)
and West Coastal Industrial Area (WCIA), respectively. The upper limit concentrations were set as the maximum values in each color bar for
the visualization of lower-abundance data points.

2.2   Model description                                                2.3   Parametrizations of CHOCHO loss by SOA
                                                                             formation
The Framework for 0-Dimensional Atmospheric Modeling
(F0AM v3.2) (Wolfe et al., 2016) was used as our tool to               From the F0AM results, the evolution of CHOCHO was cal-
simulate CHOCHO with the Master Chemical Mechanism                     culated from the balance of production (PGly ) and loss (LGly )
v3.3.1 (Jenkin et al., 2015 and references there in). We con-          rates, as described in Eq. (1).
strained our model with 50 chemical species and 10 physical
                                                                       d[Gly]mod
parameters as listed in Table S2. The total number of chem-                      = PGly,mod − LGly,mod                                (1)
ical reactions considered in our model is over 11 325 with                 dt
3742 chemical species tracked.                                         LGly,mod = LGly+OH + LGly+hν + Lmet

   The model was initialized with observations from the air-                     = kGly+OH [OH]mod + jGly + kdil [Gly]mod             (2)
craft, and the oVOCs (oxidized VOCs), including CHOCHO,
were produced under co-evolving irradiation with fixed-                LGly,mod only includes the losses of OH oxidation
parent VOCs concentrations for a day at 1 min time resolu-             (LGly+OH ), photolysis (LGly+hν ), and physical processes to
tion. The photolysis frequencies evolve in real time over the          mimic deposition and dilution (Lmet ), as expressed in Eq. (2).
course of model steps, similar to other aircraft observations          Thus the [Gly]mod stands for the simulated CHOCHO con-
constrained box modeling works (Olson et al., 2006; Kaiser             centration without aerosol loss. The loss rates of individual
et al., 2016; Anderson et al., 2017; Marvin et al., 2017; Brune        paths in the model were calculated as the sum of the cor-
et al., 2018; Haskins et al., 2019; Brune et al., 2020; Souri et       responding reaction rate coefficient kGly+OH and photolysis
al., 2020). Specifically, the model was run for a full day with        frequency jGly , with physical mixing rate representing the
updated photolysis frequencies (j ) every 1 h by implement-            dilution, deposition, and transport (kdil , set as a day by fol-
ing calculated solar zenith angle (SZA) and was scaled with            lowing Wolfe et al., 2016).
measured photolysis frequencies from the CAFS (CCD Ac-                    The loss rate of CHOCHO via aerosol formation
tinic Flux Spectrometers).                                             (LGly,aerosol ) was then analytically quantified under steady-
                                                                       state assumptions using modeled production and loss rates
                                                                       of CHOCHO. CHOCHO is a short-lived intermediate oVOC
                                                                       with a lifetime of a few hours (even without considering
                                                                       the aerosol loss path, see Sect. 3.3); thus, the steady-state
                                                                       assumption is valid except for measurements near sources.
                                                                       Under the steady-state assumption, the production rates of
                                                                       CHOCHO (PGly,mod ), directly extracted from F0AM, need

Atmos. Chem. Phys., 22, 805–821, 2022                                                      https://doi.org/10.5194/acp-22-805-2022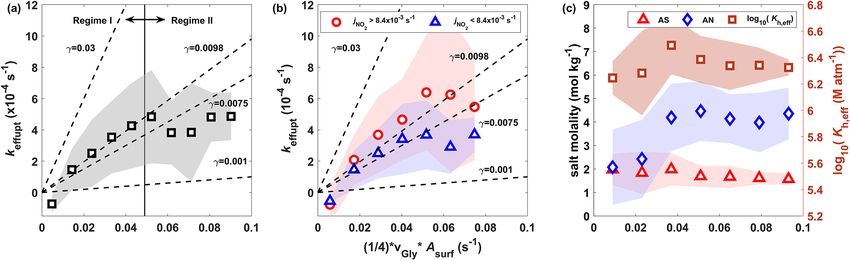
D. Kim et al.: Field observational constraints on the controllers in glyoxal (CHOCHO) reactive uptake to aerosol                                                     809

Table 1. Measurements from DC-8 used in this study.

  Species                                   Instrument name or technique                         Time resolution        Reference
  NO, NO2 , NOy a , O3                      NCAR four-channel                                    1s                     Walega et al. (1991)
                                            chemiluminescence instrument
  SO2                                       GT-CIMSb                                             1s                     Huey et al. (2004)
  HNO3                                      CIT-CIMSc                                            1s                     Crounse et al. (2006)
  OH, HO2 , OH reactivity                   ATHOSd                                               20 s                   Faloona et al. (2004)
  CO, CH4                                   DACOMe                                               1s                     Sachse et al. (1987)
  VOCs                                      WASf                                                 1–5 min                Blake et al. (2003),
                                                                                                                        Simpson et al. (2020)
  VOCs                                      PTR-ToF-MSg                                          1s                     Wisthaler (2002), Müller et al. (2014)
  HCHO, C2 H6                               CAMSh                                                1s                     Richter et al. (2015)
  CHOCHO                                    CAESARi                                              10 s                   Min et al. (2016)
  Relative humidity                         DLHj                                                 1s                     Diskin et al. (2002)
  Aerosol chemical composition              HR-ToF-AMSk                                          1s                     DeCarlo et al. (2006), Canagaratna et
  (OA, SO4 , NO3 , NH4 )                                                                                                al. (2007), Nault et al. (2018)
  Oxalate                                   SAGAl filter                                         5–10 min               Dibb et al. (2000),
                                                                                                                        McNaughton et al. (2007)
  Aerosol size distribution                 LARGEm , SMPSn and LASo                              63 s (SMPS)/1 s
                                                                                                 (LAS)
  Actinic flux                              CAFSp                                                1s                     Shetter and Müller (1999)
  O3 column density                         4STARq                                               1s                     Dunagan et al. (2013)
a Total reactive nitrogen. b Georgia Institute of Technology – Chemical Ionization Mass Spectrometer. c California Institute of Technology – Chemical Ionization Mass
Spectrometer. d Airborne Tropospheric Hydrogen Oxides Sensor. e Differential Absorption Carbon monOxide Measurements. f Whole Air Sampler. g Proton Transfer Reaction
Time-of-Flight Mass Spectrometer. h Compact Atmospheric Multi-species Spectrometer. i CAvity Enhanced Absorption Spectrometer for Atmospheric Research. j Diode Laser
Hygrometer. k High-Resolution Time-of-Flight Aerosol Mass Spectrometer. l Soluble Acidic Gases and Aerosols. m Langley Aerosol Research Group Experiment. n Scanning
Mobility Particle Sizer (TSI model 3936). o Laser Aerosol Spectrometer (TSI model 3340). p CCD Actinic Flux Spectrometers. q Spectrometers for Sky-Scanning, Sun-Tracking
Atmospheric Research.

to be balanced with real loss rates of CHOCHO (LGly,real ),                             fective uptake rate coefficient (keff,uptake ), which is a net re-
accounting for LGly,aerosol , as Eq. (3) shows.                                         sult of competition between reversible and irreversible pro-
                                                                                        cesses in real atmosphere. This stems from the underlying
PGly,mod ≈ LGly,real                                                                    mechanisms of CHOCHO uptake on the aerosol either being

            = kGly+OH [OH]mod + jGly + kdil Gly obs                                     reversible or not, which depends on various factors, such as
            + LGly,aerosol                                                    (3)       aerosol acidity, seed type, RH, and radiative flux (Liggio et
                                                                                        al., 2005a, b; Kroll et al., 2005; Corrigan et al., 2008; Kampf
Here, the instantaneous OH oxidation, photolysis, and me-                               et al., 2013; Curry et al., 2018).
teorological losses (kGly+OH [OH]mod + jGly + kdil ) were in-                              Following this, the SOA production rate owing to
ferred from modeled outputs as LGly,mod /[Gly]mod . [Gly]obs                            CHOCHO uptake (PglySOA ) was estimated from the in-
refers to the measured CHOCHO concentration.                                            ferred keff,uptake and observed CHOCHO concentration. In
LGly,aerosol = PglySOA eff. Steady State                                                Sect. 3.6, we tracked the importance of PglySOA in organic
                                                                                        aerosol (OA) growth as the air mass evolves with the photo-
               = PGly,mod − kGly+OH [OH]mod + jGly                                      chemical age (Photoage , hour) based on the NOx /NOy chem-

               + kdil Gly obs                                                           ical clock by following Kleinman et al. (2003) via Eq. (5).

               = keff,uptake Gly obs                                          (4)
One should note that the CHOCHO uptake rate coefficient
assessed as in Eq. (4) is regarded as a pseudo-first-order, ef-

https://doi.org/10.5194/acp-22-805-2022                                                                         Atmos. Chem. Phys., 22, 805–821, 2022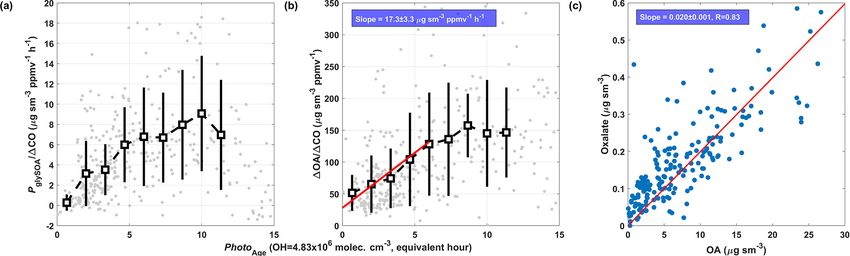
810       D. Kim et al.: Field observational constraints on the controllers in glyoxal (CHOCHO) reactive uptake to aerosol

                                                                     (cm s−1 ), and γGly,uptake (unitless) indicates the uptake prob-
                         !                                          ability of a CHOCHO molecule colliding and reacting on an
              [NOx ]                                                 aerosol surface.
Photoage = ln                (kOH+NO2 [OH])                  (5)
                                                                        For simulating volume-controlled processes through

               NOy
                                                                     aqueous-phase reactions, it was assumed that gas-phase and
Here, an updated reaction rate coefficient of OH and NO2 ,           dissolved-phase CHOCHO (CHOCHO monomer, hydrates,
9.2 × 10⁻¹² cm3 molec.−1 s−1 , was used (Mollner et al.,             and oligomers) are in steady state (more details are given in
2010). For more relevant photochemical ages in Korea, the            Sect. S4 and Fig. S6). Briefly, the equilibrium concentration
average OH concentration during KORUS-AQ (4.84±2.31×                 of aqueous-phase CHOCHO, including both hydrates and
106 molec. cm−3 , roughly 3–4 times higher than the com-             oligomers, was calculated using effective Henry’s law coef-
monly used value, 1.5×10⁶ molec. cm−3 , since the measure-           ficient, KH,eff_Gly , as in Eq. (7) from Kampf et al. (2013) and
ments were conducted only in the daytime period, 08:00–              reflecting the parameterization from Waxman et al. (2015)
17:00 LT) in the Seoul Metropolitan Area (SMA, with the              with the kinetic limit of “salting-in” effect at high salt con-
highest population density in South Korea) was also used.            centration.
   To reconcile the deviation of diurnal steady-state assump-                                  KH,water_Gly
tion against the reality, photochemical age-dependent adjust-        KH,eff_Gly = −0.24×min(12,C )−0.07×C                          (7)
                                                                                    10                 AS        AN
ment analysis was also carried out to account for the potential
                                                                     Here, the parameters in parentheses stand for the adjustment
underestimation or overestimation in oVOCs production with
                                                                     factor for KH,water_Gly , i.e., Henry’s law coefficient of CHO-
respect to the plume age. Fresh plumes close to the sources
                                                                     CHO in diluted water. CAS and CAN denote the molarities
tend to not have enough time for oxidation products to build
                                                                     (mol kg−1 , m) of AS and AN in aerosol, respectively. In this
up as the simulation of a full-day evolution. Meanwhile, old
                                                                     study, salting constants of 0.24 and 0.07 were applied for AS
plumes tend to be processed over more than just a single day.
                                                                     and AN, respectively, by following Waxman et al. (2015). In
To compensate for this, an adjustment factor was introduced
                                                                     addition, the kinetic limit of 12 m was set only for the con-
from the relationship between the ratio of modeled and mea-
                                                                     centrations of AS (Kampf et al., 2013), since that of AN has
sured HCHO against Photoage . This adjustment was applied
                                                                     not been experimentally demonstrated yet.
to the CHOCHO production rate; more details on the discus-
                                                                        For the instantaneous equilibrium partitioning between
sions and results are in Sect. S3 and Figs. S2 to S4. The main
                                                                     CHOCHO monomers and oligomers, an oligomerization
results with this adjustment are presented together with that
                                                                     constant (Kolig = [Gly]oligomer /[Gly]monomer+hyrate ) of 0.5
of the original simulation without this adjustment.
                                                                     (1) was used for the cases where CAS is larger (smaller) than
                                                                     the limit of salt concentration, 12 m (Knote et al., 2014). In
2.4   Semi-explicit estimation of CHOCHO loss to aerosol             addition, the aqueous-phase OH oxidation path was treated
                                                                     as an effective photochemical reaction with the rate of CHO-
To provide more constraints on aqueous-phase reactions once
                                                                     CHO monomer and hydrates (kphotochem , 2 s−1 ) adopted from
CHOCHO is taken up by aerosol and to test the validity of
                                                                     Ervens and Volkamer (2010), since [OH]aq inferred from
our steady-state assumption in glySOA estimation, a hybrid
                                                                     measured gas-phase OH under the assumption of equilibrium
approach, via semi-explicit aerosol loss treatment of volume
                                                                     state (KH,OH = 25 M atm−1 ) (Klaning et al., 1985) is highly
processes together with surface uptake treatment, was con-
                                                                     uncertain; estimated [OH]aq with KH,OH not only accounts
ducted in similar way to in Knote et al. (2014) (Sect. S9). De-
                                                                     for losses of OH in aerosols (Herrmann et al., 2010; Wax-
tails on the backgrounds and parameterizations are described
                                                                     man et al., 2013) but also for additional radical generation
in Knote et al. (2014). Briefly, for the surface processes,
                                                                     from photochemical reactions of organics (Volkamer et al.,
first-order reactive uptake treatment was used to compare
                                                                     2009; Monge et al., 2012; Tong et al., 2016) and inorganics
with F0AM results under the assumption of irreversible sur-
                                                                     (Paulson et al., 2019).
face reaction in free molecular regime without Fuch–Sutugin
                                                                        Aerosol physical sizes measured from LARGE (Langley
correction (Tang et al., 2015; Seinfeld and Pandis, 2016),
                                                                     Aerosol Research Group Experiment) are dried aerosol sizes.
which corrects for slip correction in the transition regime.
                                                                     To estimate the ambient diameter of an aerosol, and thus es-
This is not only due to its negligible influence (< 5 % dif-
                                                                     timate more realistic aerosol surface area density, the hygro-
ference in ksurf,uptake ) but also so that the linear relation be-
                                                                     scopic growth factor (gfdiam ) following Brock et al. (2016)
tween ksurf,uptake and reactive CHOCHO uptake coefficient
                                                                     was used as described in Eq. (8).
(γGly,uptake ), as described in Eq. (6), is retained.
                                                                                                           1/3
                                                                                                   RH
             1                                                       gfdiam ∼= 1 + κchem ×                                         (8)
keff,uptake = vGly γGly,uptake Asurf                          (6)                               100 − RH
             4
                                                                     Here, the hygroscopicity parameter (κchem ) for a mixed
Here, Asurf refers to the aerosol surface area density               particle was calculated from the volume-weighted aver-
(cm2 cm−3 ), vGly stands for the mean molecular speed                age of its individual chemical components (OA, NH4 NO3 ,

Atmos. Chem. Phys., 22, 805–821, 2022                                                   https://doi.org/10.5194/acp-22-805-2022
D. Kim et al.: Field observational constraints on the controllers in glyoxal (CHOCHO) reactive uptake to aerosol 811
(NH4 )HSO4 , and (NH4 )2 SO4 ) and most of the hygroscop- 3.2 Zero-dimensional (0-D) box model results
icity estimations (except those for OA) were taken from
Brock et al. (2016) and references therein. The hygroscop- Figure 2 shows the direct comparisons of chemical species
icity parameter of OA (κOA ) was parameterized with O/C as estimated from the F0AM to the measurements taken on
0.190 × (O/C) − 0.0048 by following Rickards et al. (2013). board a NASA DC-8. Unless otherwise specified, the least
CAS and CAN in Eq. (8) are calculated from the sul- orthogonal distance regression (ODR) forced through zero
fate, nitrate, and aerosol liquid water content (ALWC) calcu- intercept method is used for linear regression fits, and Pear-
lated from the Extended Aerosol Inorganic Model (E-AIM) son R is used for the goodness of the fits. In general, the
(Clegg and Brimblecombe, 1990; Clegg et al., 1998; Mas- diurnal steady-state box model simulates the gas-phase ox-
succi et al., 1999; Wexler, 2002; Friese and Ebel, 2010). idation processes reasonably well by considering the mea-
In the model, the amount of each chemical component in surement uncertainties as shown for OH, HO2 , and HCHO
aerosol was calculated from the measurements of gas-phase (Fig. 2a–c). In contrast to HCHO, where the model shows
HNO3 ; particle-phase ammonium, nitrate, and sulfate; and broad agreement (an overall slope of 1.23 ± 0.02), the CHO-
local environmental parameters (e.g., RH and temperature). CHO model overestimates compared to the measurements
Inorganic aerosol mass from the High-Resolution Time-of- by 3.24 (±0.06) times (Fig. 2d). For the model run without
Flight Aerosol Mass Spectrometer (HR-ToF-AMS, Aero- photochemical-age-dependent adjustment, HCHO and CHO-
dyne Research, Inc.) and gas-phase HNO3 from CIT-CIMS CHO regression slopes are 1.08 (±0.01, Fig. S2c–d) and 2.89
were used to run the E-AIM model (specifically, Model IV (±0.05). This model–observation discrepancy of CHOCHO
in forward mode with ammonia being estimated recursively) was also observed in other urban environments, such as Mex-
(Clegg et al., 1998; Friese and Ebel, 2010). ALWC associ- ico City (Volkamer et al., 2007) and the Pearl River Delta
ated with inorganic compounds was also calculated from the (Ling et al., 2020).
E-AIM model. When calculating ALWC, an organic portion We presume that our model overestimation is due to un-
was added if O/C (oxygen to carbon ratio of OA) was higher derestimation in CHOCHO loss, since the CHOCHO instru-
than 0.7, assuming organic phase separation from inorganics mental loss along the airway had been identified as negligi-
at O/C less than 0.7 (Song et al., 2018, 2019; Gorkowski et ble (0.0001±0.005 % cm2 s−1 ) (Min et al., 2016), and oVOC
al., 2020). production in the model is comparable to that of reality. The
modeled OH reactivity is only 8 % (on average) higher than
3 Results and discussion measurements (Fig. S5d), and the constrained parent VOCs
from the combined observations of WAS, PTR-TOF-MS,
3.1 Observed spatial distribution of CHOCHO and and CAMS were quite comprehensive. Even with insuffi-
relevant species cient understanding of detailed oxidation mechanisms to and
from CHOCHO, especially under extremely high NOx con-
The average CHOCHO concentration over the whole cam- ditions, CHOCHO yields from aromatic oxidations in Mas-
paign period was 107±58 ppt, with the highest concentration ter Chemical Mechanism (MCM) v3.3.1 are reasonably well
being 1.05 (2.10) ppb the 1 min (10 s) average. The spatially constrained in the NOx range relevant to KORUS-AQ cam-
binned (latitude: 0.14◦ ; longitude: 0.15◦ ) CHOCHO distri- paign (Bates et al., 2021).
bution, together with other relevant measured species, and Moreover, the direct comparison between modeled and
the DC-8 flight tracks are shown in Fig. 1. In general, the measured CHOCHO neglects the possible contribution of
concentrations of the enhanced CHOCHO and other species primary CHOCHO emission in the measurements. Qiu et
were observed near the SMA and the West Coastal Industrial al. (2020) showed the importance of primarily emitted CHO-
Area (WCIA) where petrochemical complex, steel mill, and CHO in Beijing in a wintertime study, finding direct CHO-
power plant facilities are located. The observed CHOCHO CHO emissions from vehicles and industrial activities. Since
enhancement is comparable to previously reported airborne we assumed that all measured CHOCHO was secondarily
measurements taken over the southeastern United States (up formed, we cannot rule out the possibility of an even larger
to 1.0 ppb within the boundary layer) (Li et al., 2016). The discrepancy between the model and observations, especially
spatial distribution of CHOCHO (Fig. 1b) is somewhat dif- for the SMA and industrial areas where direct CHOCHO
ferent from other oVOCs, specifically HCHO, which is an- emission is suspected to be non-negligible. We prefer to pro-
other ubiquitous oVOC (Fig. 1c). The CHOCHO enhance- vide a conservative glySOA by assuming all measured CHO-
ment over the WCIA is less comparable to CO than that of CHO to be secondary, since the portion of primary CHOCHO
HCHO, where VOCs such as ethane, propane, ethene, and n- in aircraft measurements is largely uncertain. However, con-
butane emissions are dominant in this region (Simpson et al., sidering vertical transport time with respect to the short life-
2020). Meanwhile, aromatic distributions have more similar- time of CHOCHO, most of the measured CHOCHO on board
ities with CHOCHO, such as benzene (Fig. 1e, in WCIA), is expected to be secondary.
toluene (Fig. 1f), xylene, and trimethylbenzenes near the To test the hypothesis that the gap between modeled and
SMA (Fig. S7). observed CHOCHO can be explained by uptake to aerosol, a
https://doi.org/10.5194/acp-22-805-2022 Atmos. Chem. Phys., 22, 805–821, 2022812 D. Kim et al.: Field observational constraints on the controllers in glyoxal (CHOCHO) reactive uptake to aerosol
Figure 2. Comparison of measured and modeled (a) OH, (b) HO2 , (c) HCHO, and (d) CHOCHO without (with) loss to aerosol in green
(brown) circles. The dashed black line represents 1 : 1 line and red (yellow) line is the best orthogonal distance regression (ODR) fit forced
through the origin and Pearson R.
steady-state approach was used (as described in Sect. 2.3) to City (75 %–95 %) (Volkamer et al., 2007) and in the Pearl
infer keff,uptake . As a quality check, we plugged the keff,uptake River Delta measurements (∼ 62 %) (Ling et al., 2020) but is
parameter back into the model to simulate the loss of CHO- much larger than that in Los Angeles (0 %–30 %) (Washen-
CHO via glySOA path. The CHOCHO prediction with up- felder et al., 2011).
dated loss to aerosol reproduced measured CHOCHO well, The model-estimated lifetime of CHOCHO without
as shown in Fig. 2d, and thus we presume that the possible aerosol uptake (in Fig. S9), 1.57 ± 0.23 h, is consistent
bias of primary CHOCHO contribution is not significant. In with the general estimation of a few hours. However, when
addition, the agreement between observations and the box aerosol uptake is included, the CHOCHO lifetime decreases
model indicates near-steady-state glyoxal during the 24 h di- to 0.50 ± 0.26 h during the typical flight duration (08:00–
urnal evolution in the box model. Possible bias in keff,uptake 17:00 LT), which is also consistent with previous results
due to the measurement errors was quantified by varying (Volkamer et al., 2007).
input concentrations with their uncertainties. As shown in The importance of aerosol uptake loss has clear
Fig. S8 in Sect. S6, the largest variability in VOCs input re- dependence on Asurf . Figure 3c shows the ratio of
sults in ±10 % variation of keff,uptake . In addition, the possi- keff,uptake /(kOH+Gly [OH] + jGly ) against Asurf . This ratio lev-
ble errors in photochemical-age-dependent adjustments are els off around 2.5 under high Asurf conditions, but it con-
about 27 %, as shown in Fig. S4. More about the controlling verges to 0 as Asurf decreases since the keff,uptake becomes
factors in keff,uptake follows in Sect. 3.4 after the sources and close to 0 when Asurf is 0 (no significant positive intercept),
sinks discussion. as shown in Fig. 4a. This confirms that our inferred keff,uptake
is legitimate, since the CHOCHO budget is closed only with
3.3 CHOCHO sources and sinks apportionment photolysis and OH oxidation loss in the absence of aerosol.
Meanwhile, our steady-state model diverges more, and thus
Roughly 59 % of CHOCHO in the model originates from required it higher keff,uptake to reconcile the gap with ob-
aromatics, with the largest contribution from toluene (41 %, served CHOCHO as Asurf increases. This is a clear evidence
Fig. 3a), as supported by previous works with high glyoxal of the requirement for an additional sink of CHOCHO in the
yields (10 %–40 %) from aromatic compounds (i.e., benzene, presence of aerosols.
toluene, p-xylene, and ethylbenzene) under high NOx con-
ditions (Volkamer et al., 2001, 2007; Bates et al., 2021).
3.4 Different CHOCHO uptake regimes
We estimate that 20 % of CHOCHO is produced from bio-
genic VOCs (BVOCs), specifically isoprene, α-pinene, and The estimated keff,uptake is 1.2–6.0 × 10⁻⁴ s−1 throughout the
β-pinene. The biogenic portion of glyoxal production is po- whole mission, which falls within the range of previous re-
tentially biased low as the DC-8 flight paths focused more on ports (1.3–5.0 × 10⁻⁴ s−1 ) (Hastings et al., 2005; Liggio et
anthropogenic sources, and some portion of isoprene can be al., 2005a; Ervens and Volkamer, 2010). Interestingly, our in-
oxidized as advected to the sampling altitude due to its short ferred keff,uptake has a clear dependency on Asurf , as shown in
lifetime. Fig. 4a. The keff,uptake shows a linear relationship with Asurf
The OH oxidation and photolysis loss are only responsible in lower Asurf conditions (less than 4.9 × 10⁻⁶ cm2 cm−3 ,
for 13 % and 19 % of CHOCHO losses, respectively, while with averaged νGly , 3.3 × 104 cm s−1 , hereafter defined as
roughly 69 % of CHOCHO must be lost via aerosol uptake Regime I). Meanwhile, keff,uptake levels off for larger Asurf
to reconcile the imbalance between modeled and measured (hereafter named Regime II). One should note that slopes in
concentrations (Fig. 3b). This large importance of the aerosol Fig. 4a–b become the reactive uptake coefficient, γGly,uptake ,
uptake pathway is consistent with previous works in Mexico since it shows the relation between keff,uptake and Asurf scaled
Atmos. Chem. Phys., 22, 805–821, 2022 https://doi.org/10.5194/acp-22-805-2022D. Kim et al.: Field observational constraints on the controllers in glyoxal (CHOCHO) reactive uptake to aerosol 813 Figure 3. Major CHOCHO (a) sources and (b) sinks from the 0-D box model analysis over South Korea. Panel (c) shows the aerosol surface area density (Asurf ) dependent CHOCHO loss rates plotted as the ratio of effective aerosol uptake rate (keff,uptake ) with respect to sum of CHOCHO losses by OH oxidation and photolysis (kGly+OH [OH] + jGly ). Hereafter, median (square markers) and interquartile ranges (vertical bars) are used to represent the data variability, unless otherwise specified. Figure 4. The (1/4 · vGLY · Asurf ) dependence of (a) keff,uptake , (b) higher (red) and lower (blue) jNO2 than median conditions (8.6 × 10⁻³ s−1 ), and (c) ammonium sulfate (AS) and ammonium nitrate (AN) molality, and the effective Henry’s law constant, KH,eff_Gly , parameterized with AS and AN molalities. Dashed black lines in (a) and (b) are a few examples of the uptake coefficient, γ . Shaded areas represent interquartile ranges. with 1/4νGly . Extracted median γGly,uptake , assuming 100 % as it found noticeable acceleration in CHOCHO aerosol up- surface uptake, is 0.98(±0.07) × 10−2 for Regime I and take under irradiated (compared to dark) conditions (Volka- 0.82(±0.57) × 10−2 for both regimes, which also overlaps mer et al., 2009; Ervens and Volkamer, 2010). However, note with what Ervens and Volkamer (2010) reported for hygro- that the interquartile ranges are broad, especially at high scopic aerosol (0.8(±0.3) × 10−2 ). jNO2 , and thus we cannot rule out the possibility that other The linearity between keff,uptake and Asurf in Regime I in- unaccounted for factors contribute to the distinction between dicates that irreversible uptake on the aerosol surface is a rea- high and low jNO2 . We speculate that the effect of organic sonable approximation to mimic the behavior of CHOCHO coating on aerosols from VOCs on photochemical uptake uptake for the conditions with low aerosol loading, since av- rate of CHOCHO (Galloway et al., 2011) was not significant eraged aerosol modes across the regimes are found to be sim- in this work. The increase in keff,uptake (decrease in CHO- ilar to each other over varying Asurf (Fig. S10); thus, the num- CHO uptake timescale) under high jNO2 may reflect faster ber of particles matters more than aerosol size. production of low volatility products via irreversible path- As shown in Fig. 4b, the keff,uptake dependence on jNO2 (a ways, likely due to enhanced organic photochemistry (Volka- proxy for solar irradiation) exists in both regimes (more ap- mer et al., 2009; Lee et al., 2011). parent in Regime II, where keff,uptake is enhanced by ∼ 40 % In Regime II, keff,uptake plateaus in a range of 3– at higher jNO2 compared to lower jNO2 ) and suggests the pos- 6 × 10⁻⁴ s−1 and becomes relatively insensitive to Asurf . One sibility of accelerated aqueous-phase chemistry in SOA un- possible explanation of independent behavior of keff,uptake in der active photochemistry. This light dependence of keff,uptake Regime II is likely related to aerosol viscosity. Figure 4c is consistent with findings from previous laboratory studies shows CAS and CAN change with respect to Asurf ; CAN in- https://doi.org/10.5194/acp-22-805-2022 Atmos. Chem. Phys., 22, 805–821, 2022
814 D. Kim et al.: Field observational constraints on the controllers in glyoxal (CHOCHO) reactive uptake to aerosol
creases and levels off near the boundary of Regime I and One possible explanation for high KH,eff_Gly
II. An increase in salt molality may lead to limited available (∼ 108 M atm−1 ) even in low salt conditions (i.e.,
“free water” and/or more viscous aerosol, retarding mass CAS < 12 m) is the influence of organic compounds by
transfer into the aerosol. Kampf et al. (2013) previously ob- various oligomerization pathways. Moreover, aerosol
served slower CHOCHO mass transfer for CAS larger than seeds consist of water-soluble organic carbons (e.g., fulvic
12 m conditions (kinetic limitation) and suggested that at acid) that can enhance the solubility of CHOCHO (up to
high salt concentration fewer water molecules are available ∼ 6.0 × 10⁸ M atm−1 of KH,eff_Gly , Volkamer et al., 2009).
for hydration and/or particle viscosity increases, leading to Corrigan et al. (2008) observed KH,eff_Gly > 108 M atm−1
slower kinetics. Similar to this phenomenon, we postulate with various organic acid aerosol seeds, including l-tartaric
the possibility that the higher CAN in Regime II may slow acid, dl-malic acid, and other liquid-phase aerosol particles
down the kinetics; thus, more studies on the CAN effect on containing amine functional groups. In addition, Qin et
the timescale of CHOCHO mass transfer into particle are de- al. (2020) found the synergetic effect of CHOCHO uptake
sirable. by coexistence with pinanediol and proposed acid-catalyzed
cross-reactions that enhance the reactivity of CHOCHO in
3.5 The glySOA production rate comparison the aqueous phase.
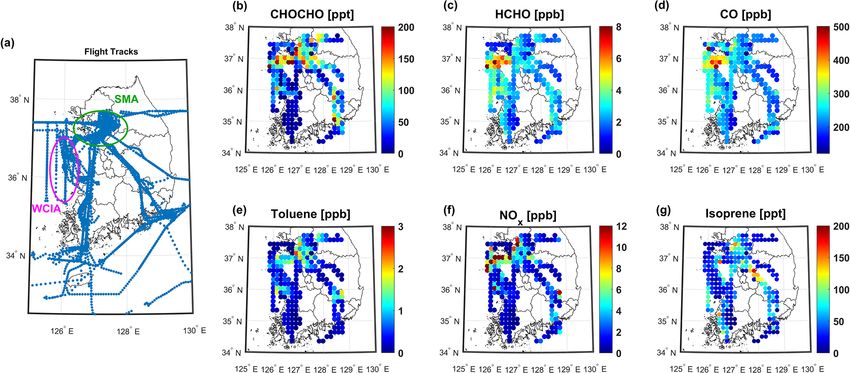
Figure 5a shows the results of glySOA production rate
(PglySOA ) comparison between the 0-D box model 3.6 CHOCHO contribution to SOA in SMA
(PglySOA, eff. Steady State , Eq. 4) and hybrid treatment To evaluate CHOCHO contribution to SOA formation in
(PglySOA, hybrid , Sect. S9) in Regime I. Calculated PglySOA the SMA, the relationship between PglySOA and organic
without surface uptake (volume process only) is 2–3 orders aerosol enhancement (1OA), normalized with 1CO to min-
of magnitude slower than that of the steady-state result, imize the dilution effect, was analyzed, as was the air
suggesting the importance of the surface uptake process in mass evolution (Fig. 6), and the background concentra-
Regime I, indicating that volume process by inorganic salts tions of OA and CO are 1 µg sm−3 and 140 ppb, respec-
alone is not sufficient to explain the glyoxal uptake rate tively, as was the case for the Yellow Sea case in Nault et
during the KORUS-AQ, which is consistent with findings in al. (2018). The PglySOA /1CO increases by an average of
Mexico City (Waxman et al., 2013). By adding the surface 3.67 µg sm−3 ppm−1 h−1 for the first 6 equivalent hours un-
uptake process using the median γGly,uptake in Regime I der 4.84 × 10⁶ molec. cm−3 OH (averaged OH concentration
(0.98 × 10⁻² ), the hybrid method matches within an order of over SMA), and the rate of 1OA/1CO growth over that time
magnitude with a steady-state box model analysis. Thus, the window is 17.3 µg sm−3 ppmv−1 h−1 . Thus, the CHOCHO
hybrid method in Regime I is almost identical to the surface contribution to SOA formation during the early stage of pho-
reactive uptake model. tochemical processing is estimated to be ∼ 20 %. According
In Regime II, the reactive surface uptake process with to Nault et al. (2018), local emissions of short-lived aromatic
one fixed γGly,uptake is unlikely due to the lack of linear- compounds and semi-volatile and intermediate-volatility or-
ity between keff,uptake and Asurf (Fig. 4a–b). In order to ap- ganic compounds were the main precursors to SOA, ac-
ply the surface uptake model, parameterization of γGly,uptake counting for 70 % of the calculated SOA. During KORUS-
may be needed in Regime II. When the volume process AQ, the observationally constrained PglySOA ranges from
is applied, the inferred PglySOA from constrained KH,eff_Gly 0–0.8 µg sm−3 h−1 for individual RFs (shown in Fig. S12),
with measured CAS and CAN through Eq. (7) without the which is comparable to Mexico City (> 15 %, Volkamer et
surface uptake process (PglySOA, eff. photochem , Sect. S4) is al., 2007), the Pearl River Delta (11.3 %, Ling et al., 2020),
2 orders of magnitude lower than PglySOA, eff. Steady State , as and the Los Angeles basin (1 %–15 %, Knote et al., 2014)
shown in colored circles in Fig. 5b. One fixed KH,eff_Gly of but is higher than in Pasadena (0 %–4 %, Washenfelder et al.,
7.0 × 10⁸ M atm−1 , close to the KH,eff_Gly at the AS seed ki- 2011).
netic limit (∼ 3×10⁸ M atm−1 , Kampf et al., 2013), provides We also estimate the upper limit of oxalate mass yield
better agreement. It indicates that the KH,eff_Gly driven by AS from CHOCHO over SMA as ∼ 10 % based on the oxalate
and AN is not sufficient to explain the required KH,eff_Gly fraction (∼ 2 %) in OA (Fig. 6c). Oxalate is a major prod-
of CHOCHO. Although the increase in CHOCHO solubil- uct from glyoxal reactions in clouds (Tan et al., 2009; Ortiz-
ity by some of the inorganics other than AS and AN not in- Montalvo et al., 2014), but a minor product in wet aerosol
cluded in KH,eff_Gly calculation (e.g., NaCl and NH4 HSO4 ) (Lim et al., 2013). We find oxalate explains only a minor por-
cannot be ruled out, due to their low concentrations, the tion of the glyoxal SOA inferred, which is consistent with
KH,eff_Gly contribution from these species is not significant lower oxalate yields in wet aerosol. We presume our lower
enough (less than 5 %) to explain the required KH,eff_Gly . yield likely originated from the existence of many possible
Even higher KH,eff_Gly (3 × 10⁹ M atm−1 ) is required for fates for taken-up CHOCHO, such as oligomerization (Lim
Regime I (Fig. S11). et al., 2013) and reaction with sulfate (Lim et al., 2016) and
ammonium (Yu et al., 2011; Ortiz-Montalvo et al., 2014),
Atmos. Chem. Phys., 22, 805–821, 2022 https://doi.org/10.5194/acp-22-805-2022D. Kim et al.: Field observational constraints on the controllers in glyoxal (CHOCHO) reactive uptake to aerosol 815
Figure 5. Comparison of glySOA production rate (PglySOA ) between steady-state and hybrid analysis for (a) Regime I with (pink diamonds,
γGly,uptake = 0.0098) and without (green diamonds) the surface uptake process. (b) Regime II with fixed KH,eff_Gly (7.0 × 10⁸ M atm−1 ,
green circles) and calculated KH,eff_Gly based on salting in by AN and AS following Waxman et al. (2015) (colored circles). Surface uptake
process was not included in (b).
Figure 6. Photochemical age (Photoage ) dependence of dilution corrected (normalized by CO enhancement) (a) PglySOA and (b) OA
enhancement over SMA. The square markers and bars are the mean ± 1σ standard variation. Normal regression (shown as red line in b) was
used to fit the early photochemical state data (Photoage < 6 h). Panel (c) shows the relation between oxalate OA and ODR fit.
since our analysis is over the SMA area. From our dataset, production (59 %), with toluene being the highest contrib-
in the cloud-processing case, analysis was impossible due to utor (41 %). We found the importance of the loss path to
not only the low abundance of gas-phase CHOCHO concen- aerosol (69 %) was greatest, followed those by photolysis
trations (below detection limit) but also the sparseness of the (19 %) and OH oxidation (12 %). Comparison of dilution-
sample. corrected PglySOA to that of OA growth over the first 6 pho-
tochemical hours shows that glySOA contributes to ∼ 20 %
of SOA formation, and oxalate yield from glySOA was esti-
4 Conclusions mated to be less than 10 % in Seoul. The keff,uptake linearly in-
crease with Asurf in Regime I (Asurf < 4.9 × 10⁻⁶ cm2 cm−3 ,
In the present study, production rates and loss rates of CHO- γGly,uptake = 9.8 × 10⁻³ ) but plateaus in Regime II (Asurf >
CHO were simulated using a 0-D box model constrained by 4.9 × 10⁻⁶ cm2 cm−3 ), which suggests the limitation in sur-
high-quality gas, aerosol, and meteorological measurements face uptake approximation. We postulate a hypothesis that
on board the NASA DC-8 during the KORUS-AQ mission this slower uptake under high-aerosol loading conditions is
to elucidate the controllers of CHOCHO uptake to aerosols. attributed to the increased AN molality, which likely induced
High CHOCHO concentrations were observed over highly high aerosol viscosity and thus slowed down CHOCHO mass
populated cities (i.e., Seoul) and industrial areas, with peak transfer to aqueous phase. More experimental studies are
concentration of 1.05 (2.10) ppb for a 1 min (10 s) average. needed to elucidate the controlling factors of glyoxal mass
Aromatics were the most important precursors of CHOCHO
https://doi.org/10.5194/acp-22-805-2022 Atmos. Chem. Phys., 22, 805–821, 2022816 D. Kim et al.: Field observational constraints on the controllers in glyoxal (CHOCHO) reactive uptake to aerosol
transfer into aerosols. We also found light dependence of Financial support. The Min group for CHOCHO measurements
keff,uptake , suggesting the importance of photochemistry in and analysis was supported by Technology Development Program
ambient conditions. to Solve Climate Changes through the National Research Foun-
Finally, our work highlights the lack of knowledge re- dation of Korea (NRF) funded by the Ministry of Science, ICT
quired to explain the CHOCHO solubility in real atmo- (NRF 2019M1A2A2103953). The Jimenez group was supported by
NASA 80NSSC18K0630 and NSF AGS-2027252. Rainer Volka-
spheric circumstances. KH,eff_Gly (∼ 106 M atm−1 ) derived
mer was supported by the Department of Energy ASR program
from salting-in by AS and AN was ∼ 2 orders of magnitude (award DE-SC0018221). The Armin Wisthaler group was sup-
lower than KH,eff_Gly estimated in this study, indicating po- ported from the Austrian Federal Ministry for Transport, Innova-
tential roles of organic compounds in the solubility of CHO- tion, and Technology (bmvit) through the Austrian Space Appli-
CHO. This urges more attention to other various factors in cations Programme (ASAP) of the Austrian Research Promotion
CHOCHO solubility control in addition to the abundance of Agency (FFG).
inorganic salts. Adding more constraints on these factors is
important not only for the formation of SOA but also in air
mass source tracking from satellites since CHOCHO is one Review statement. This paper was edited by Jason Surratt and
of the two VOC proxies measured from space. reviewed by two anonymous referees.
Data availability. DC-8 data created during KORUS-AQ are pub-
lished at https://doi.org/10.5067/Suborbital/KORUSAQ/DATA01 References
(Crawford et al., 2021).
Anderson, D. C., Nicely, J. M., Wolfe, G. M., Hanisco, T. F.,
Salawitch, R. J., Canty, T. P., Dickerson, R. R., Apel, E. C.,
Supplement. The supplement related to this article is available Baidar, S., Bannan, T. J., Blake, N. J., Chen, D., Dix, B., Fer-
online at: https://doi.org/10.5194/acp-22-805-2022-supplement. nandez, R. P., Hall, S. R., Hornbrook, R. S., Huey, L. G.,
Josse, B., Jöckel, P., Kinnison, D. E., Koenig, T. K., LeBre-
ton, M., Marécal, V., Morgenstern, O., Oman, L. D., Pan, L.
Author contributions. DK and KEM designed and executed the L., Percival, C., Plummer, D., Revell, L. E., Rozanov, E., Saiz-
study and led the writing of the paper. DK, CC, SJ, KEM, SL, BAN, Lopez, A., Stenke, A., Sudo, K., Tilmes, S., Ullmann, K., Volka-
PCJ, DAD, JCS, JLJ, DRB, AW, AF, JPD, GSD, SEP, SRH, KU, mer, R., Weinheimer, A. J., and Zeng, G.: Formaldehyde in
LGH, DJT, and JD provided observational data. RV and CJK con- the Tropical Western Pacific: Chemical sources and sinks, con-
tributed to aqueous-phase mechanism model setups and data inter- vective transport, and representation in CAM-Chem and the
pretation. BAN and PCJ ran the E-AIM model. All co-authors con- CCMI models, J. Geophys. Res.-Atmos., 122, 11201–11226,
tributed with feedback during the development and writing of the https://doi.org/10.1002/2016JD026121, 2017.
study. Bates, K., Jacob, D., Li, K., Ivatt, P., Evans, M., Yan, Y., and Lin,
J.: Development and evaluation of a new compact mechanism for
aromatic oxidation in atmospheric models, Atmos. Chem. Phys.
Competing interests. The contact author has declared that nei- Discuss. [preprint], https://doi.org/10.5194/acp-2021-605, in re-
ther they nor their co-authors have any competing interests. view, 2021.
Bates, K. H. and Jacob, D. J.: A new model mechanism for atmo-
spheric oxidation of isoprene: global effects on oxidants, nitro-
Disclaimer. Publisher’s note: Copernicus Publications remains gen oxides, organic products, and secondary organic aerosol, At-
neutral with regard to jurisdictional claims in published maps and mos. Chem. Phys., 19, 9613–9640, https://doi.org/10.5194/acp-
institutional affiliations. 19-9613-2019, 2019.
Blake, N. J., Blake, D. R., Simpson, I. J., Meinardi, S., Swan-
son, A. L., Lopez, J. P., Katzenstein, A. S., Barletta, B., Shi-
rai, T., Atlas, Elliot, Sachse, G., Avery, M., Vay, S., Fuelberg,
Acknowledgements. The authors thank all those who partici-
H. E., Kiley, C. M., Kita, K., and Rowland, F. S.: NMHCs and
pated in the KORUS-AQ campaigns. We thank William H. Brune
halocarbons in Asian continental outflow during the Transport
for the HOx data; Denise D. Montzka and Andrew J. Wein-
and Chemical Evolution over the Pacific (TRACE-P) Field Cam-
heimer for the NOx , NOy , and O3 data; Michelle J. Kim,
paign: Comparison With PEM-West B, J. Geophys. Res., 108,
Alexander P. Teng, John D. Crounse, and Paul O. Wennberg
8806, https://doi.org/10.1029/2002jd003367, 2003.
for HNO3 data; the Bruce E. Anderson group for the measure-
Brock, C. A., Wagner, N. L., Anderson, B. E., Attwood, A. R.,
ments from LARGE; and Jens Redemann, Samuel E. LeBlanc,
Beyersdorf, A., Campuzano-Jost, P., Carlton, A. G., Day, D. A.,
and Michal Segal-Rozenhaimer for the measurements from 4STAR.
Diskin, G. S., Gordon, T. D., Jimenez, J. L., Lack, D. A., Liao,
The PTR-MS instrument team (Philipp Eichler, Lisa Kaser,
J., Markovic, M. Z., Middlebrook, A. M., Ng, N. L., Perring,
Tomas Mikoviny, Markus Müller) is acknowledged for their support
A. E., Richardson, M. S., Schwarz, J. P., Washenfelder, R. A.,
with fieldwork and data processing. Ionicon Analytik is acknowl-
Welti, A., Xu, L., Ziemba, L. D., and Murphy, D. M.: Aerosol
edged for instrumental support.
optical properties in the southeastern United States in summer
Atmos. Chem. Phys., 22, 805–821, 2022 https://doi.org/10.5194/acp-22-805-2022You can also read