Chronological Assessment of the Balta Alba Kurgan Loess-Paleosol Section (Romania) - A Comparative Study on Different Dating Methods for a Robust ...
←
→
Page content transcription
If your browser does not render page correctly, please read the page content below
ORIGINAL RESEARCH
                                                                                                                                               published: 15 January 2021
                                                                                                                                           doi: 10.3389/feart.2020.598448

                                            Chronological Assessment of the
                                            Balta Alba Kurgan Loess-Paleosol
                                            Section (Romania) – A Comparative
                                            Study on Different Dating Methods for
                                            a Robust and Precise Age Model
                                            Stephanie Scheidt 1*, Sonja Berg 1, Ulrich Hambach 2,3, Nicole Klasen 4, Stephan Pötter 5,
                                            Alexander Stolz 6, Daniel Veres 7, Christian Zeeden 8, Dominik Brill 4, Helmut Brückner 4,
                                            Stephanie Kusch 9, Christian Laag 8,10, Frank Lehmkuhl 5, Martin Melles 1, Florian Monnens 1,
                                            Lukas Oppermann 4, Janet Rethemeyer 1 and Janina J. Nett 5
                            Edited by:      1
                                              Institute of Geology and Mineralogy, Faculty of Mathematics and Natural Sciences, University of Cologne, Cologne, Germany,
                      Amanda Owen,          2
                                              Chair of Geomorphology, Faculty of Biology, Chemistry, and Earth Sciences, University of Bayreuth, Bayreuth, Germany,
                University of Glasgow,      3
                                              Bayreuth Center for Ecology and Environmental Research, University of Bayreuth, Bayreuth, Germany, 4Cologne Luminescence
                      United Kingdom        Laboratory, Institute of Geography, Faculty of Mathematics and Natural Sciences, University of Cologne, Cologne, Germany,
                                            5
                     Reviewed by:             Chair of Physical Geography and Geoecology, Department of Geography, RWTH Aachen University, Aachen, Germany,
                                            6
                     Zhixiong Shen,           Institute for Nuclear Physics, Faculty of Mathematics and Natural Sciences, University of Cologne, Cologne, Germany, 7Institute
         Coastal Carolina University,       of Speleology, Romanian Academy, Cluj-Napoca, Romania, 8Rock Physics and Borehole Geophysics, Leibniz Institute for
                       United States        Applied Geophysics, Hannover, Germany, 9CologneAMS-Centre—Centre for Accelerator Mass Spectrometry, University of
                       Gabor Ujvari,        Cologne, Cologne, Germany, 10Université de Paris, Institut de Physique du Globe de Paris, CNRS, Paris, France
     Hungarian Academy of Sciences
                    (MTA), Hungary
                                            Loess-paleosol sequences (LPSs) are important terrestrial archives of paleoenvironmental
                 *Correspondence:
                  Stephanie Scheidt
                                            and paleoclimatic information. One of the main obstacles for the investigation and
      stephanie.scheidt@uni-koeln.de        interpretation of these archives is the uncertainty of their age-depth relationship. In this
                                            study, four different dating techniques were applied to the Late Pleistocene to Holocene LPS
                    Specialty section:
                                            Balta Alba Kurgan (Romania) in order to achieve a robust chronology. Luminescence dating
         This article was submitted to
          Sedimentology, Stratigraphy       includes analysis of different grain-size fractions of both quartz and potassium feldspar and
                       and Diagenesis,      the best results are obtained using fine-grained quartz blue-stimulated and polymineral post-
               a section of the journal
            Frontiers in Earth Science
                                            infrared infrared-stimulated luminescence measurements. Radiocarbon (14C) dating is
         Received: 24 August 2020
                                            based on the analysis of bulk organic carbon (OC) and compound-specific radiocarbon
      Accepted: 06 November 2020            analysis (CSRA). Bulk OC and leaf wax-derived n-alkane 14C ages provide reliable age
       Published: 15 January 2021
                                            constraints for the past c. 25–27 kyr. CSRA reveals post-depositional incorporation of roots
                               Citation:
                                            and microbial OC into the LPS limiting the applicability of 14C dating in older parts of the
      Scheidt S, Berg S, Hambach U,
Klasen N, Pötter S, Stolz A, Veres D,       sequence. Magnetic stratigraphy data reveal good correlation of magnetic susceptibility and
        Zeeden C, Brill D, Brückner H,      the relative paleointensity of the Earth’s magnetic field with one another as well as reference
        Kusch S, Laag C, Lehmkuhl F,
Melles M, Monnens F, Oppermann L,
                                            records and regional data. In contrast, the application of paleomagnetic secular variation
     Rethemeyer J and Nett JJ (2021)        stratigraphy is limited by a lack of regional reference data. The identification of the Campanian
Chronological Assessment of the Balta
                                            Ignimbrite/Y-5 tephra layer in the outcrop provides an independent time marker against
 Alba Kurgan Loess-Paleosol Section
(Romania) – A Comparative Study on          which results from the other dating methods have been tested. The most accurate age
Different Dating Methods for a Robust       constraints from each method are used for two Bayesian age-depth modeling approaches.
               and Precise Age Model.
            Front. Earth Sci. 8:598448.
                                            The systematic comparison of the individual results exemplifies the advantages and
       doi: 10.3389/feart.2020.598448       disadvantages of the respective methods. Taken as a whole, the two age-depth models

Frontiers in Earth Science | www.frontiersin.org                                     1                                           January 2021 | Volume 8 | Article 598448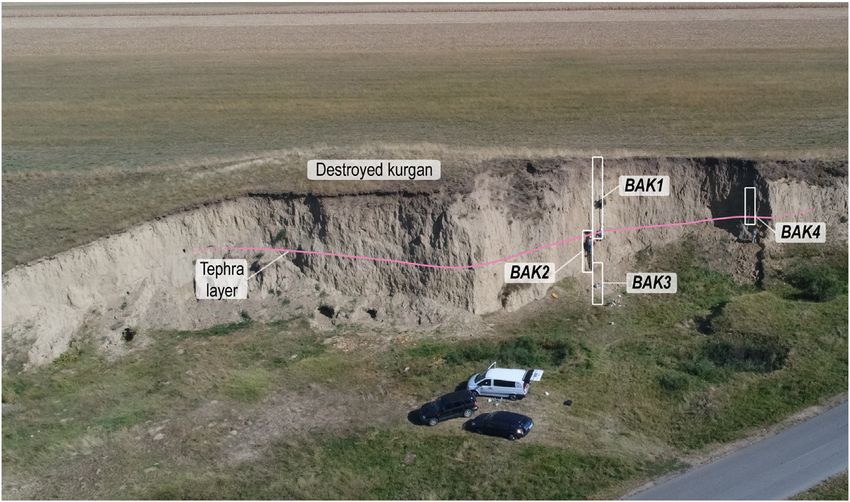
Scheidt et al.                                                                                                                                 Chronology of the BAK LPS

                                            agree very well, our study also demonstrates that the multi-method approach can improve
                                            the accuracy and precision of dating loess sequences.
                                            Keywords: loess-paleosol sequences, optically stimulated luminescence dating, magnetic stratigraphy, compound-
                                            specific radiocarbon analysis, tephrochronology, age-depth modeling, Romania, late Pleistocene-Holocene

INTRODUCTION                                                                             loess beds. These imprints of orbital to millennial climatic
                                                                                         variations provide the backbone for chronostratigraphic
Loess-paleosol sequences (LPSs) are widely spread across Central                         correlations (at least) on hemispheric scales and interpretation
Eastern Europe (Figure 1) and provide archives of paleoclimate                           of deposits across environmental boundaries (e.g., Rousseau et al.,
information crucial for the reconstruction of the Pleistocene                            2020). In paleoclimatology, this approach was used even before
environmental evolution (e.g., Marković et al., 2015). In                               absolute dating techniques became available (e.g., Emiliani,
addition to semi-continuous dust input, the formation of LPSs                            1955). Nevertheless, to unambiguously link the characteristic
is closely linked to changes in climate and environmental                                paleoclimatic imprints in sedimentary archives to a precisely
conditions, which are controlled by interglacial-glacial cycles                          defined chronostratigraphic interval, time anchors (tie points)
(Gallet et al., 1996; Kohfeld and Harrison, 2003; Svensson                               are essential (Govin et al., 2015). In their absence, the
et al., 2008; Újvári et al., 2010; Obreht et al., 2017; Zeeden                           chronologies of precisely dated archives (e.g., ice core records,
et al., 2018b). Beyond reconstructing Milankovitch-scale                                 speleothems) and even chronologies derived using
climatic variations, LPSs also allow sub-millennial climatic                             astrochronological approaches remain speculative (e.g., Lowe
fluctuations to be identified (Moine et al., 2017; Újvári et al.,                          and Walker, 2014). Hence, one of the main obstacles for the
2017; Zeeden et al., 2018c; Veres et al., 2018). In LPSs of the last                     investigation and interpretation of climatic and environmental
glacial cycle, the imprint of past climatic fluctuations is preserved                     information preserved in sedimentary archives is the
as a succession of weakly developed paleosols or pedogenetically                         uncertainty of the age-depth relationship. Most analytical dating
overprinted loess layers, which often gradually turn into adjacent                       techniques applicable to LPSs have age uncertainties that exceed

  FIGURE 1 | Location of the study area and distribution of eolian sediments (according to Haase et al. (2007), modified). (A) Europe. (B) Southeast Europe. (C) The
  Lower Danube Basin with landscape units (according to Jipa (2014), modified). Black circles indicate the correlation sites for magnetic stratigraphy as described in
  Magnetic Stratigraphy. 1) NGRIP, 2) Poiana Ciresului, 3) Batajnica, 4) Vlasca, 5) Rasova. Elevation contours (based on JAXA, 2016) are shown to illustrate the natural
  altitudinal boundaries of loess distributions.

Frontiers in Earth Science | www.frontiersin.org                                     2                                           January 2021 | Volume 8 | Article 598448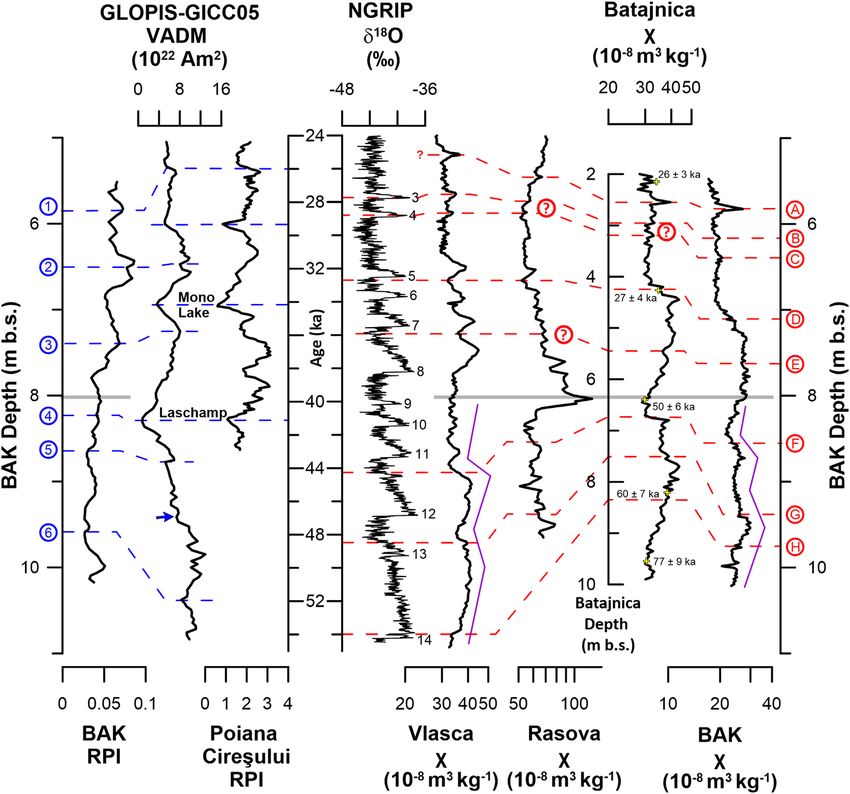
Scheidt et al.                                                                                                                Chronology of the BAK LPS

millennial-to-centennial-scale resolution. Thus, the exact                       2018b; Pfeifer et al., 2020; Zeeden et al., 2020). In general, age
timing and duration of individual short-term climatic                            control is achieved by “wiggle-matching”, i.e., tying significant
fluctuations can be difficult to establish (e.g., Zeeden et al.,                   features of paleo- and rock magnetic parameters to independently
2018c). However, good age control of these events is of                          dated master curves (Maher, 1999; Hambach et al., 2008). The
particular importance in understanding broad-scale                               signals used are typically the magnetic susceptibility and, to a
atmospheric       circulation      patterns,      climatic     feedback          lesser extent, the direction and/or relative paleointensity (RPI) of
mechanisms and possibly offsets in timing between different                      the Earth’s magnetic field. If unequivocal correlations are not
regions and deposit types. Therefore, in this study we combine                   possible, potential correlations need to be verified using other
absolute dating techniques (optically stimulated luminescence,                   dating techniques, which may result in an iterative process. While
radiocarbon) with correlative dating (tephrochronology, relative                 magnetic stratigraphy is a powerful chronostratigraphic tool for
magnetic paleointensity, magnetic susceptibility correlation) and                LPSs, it should be noted that ages can be younger than the
integrate the results in a robust absolute age model.                            deposition of the respective LPS (Liu et al., 2015), because soils
    Optically stimulated luminescence (OSL) dating is the most                   develop on and into accumulated sediments post-depositionally.
commonly used absolute dating technique in loess chronological                       The motivation for this study was to compare the results of the
research (Roberts, 2008). Sediment accumulation is dated directly                individual dating methods and obtain a robust absolute
by measuring a signal that builds up over time in buried quartz                  chronology for the LPS Balta Alba Kurgan (in Romanian:
and feldspar grains and resets during particle transport. The use                Balta Albă Kurgan; hereafter BAK; Figure 1). In this LPS, a
of different grain-sizes and mineral extracts and measurement                    well constrained tephra layer is included and forms an
protocols has been well established (Murray and Wintle, 2000;                    independent time marker. We apply luminescence dating,
Murray and Wintle, 2003; Timar-Gabor et al., 2011; Buylaert                      radiocarbon dating and magnetic stratigraphy. In addition to
et al., 2012). The ubiquity of suitable sample material in loess,                the standard (bulk OC) 14C analysis, we also test the applicability
favorable conditions for signal resetting during eolian transport                of compound-specific radiocarbon analysis (CSRA) of leaf wax
and a dating range covering at least the last interglacial-glacial               lipids for age determination of loess, a method that has been
cycle are the main advantages of this methods for dating LPSs                    rarely applied to LPSs (Häggi et al., 2014). We also use an
(e.g., Lauer et al., 2016; Bösken et al., 2017; Timar-Gabor et al.,              extended set of OSL dating protocols to validate the OSL age
2017; Bösken et al., 2019; Constantin et al., 2019; Lomax et al.,                assignment, including one for coarse-grain feldspar that is
2019; Fenn et al., 2020a). However, the age uncertainties of                     typically not applied to loess in this region. Furthermore, we
luminescence methods are on the order of thousands of years,                     combine the results with statistical age-depth modeling to obtain
and significant age offsets have also been reported between                       a robust chronology of the BAK loess profile. Our approach
different mineral fractions dated as well as different protocols                 illustrates the potentials and limitations of each individual
applied. In comparison, the age uncertainty of radiocarbon (14C)                 method for dating loess sequences and may help to gain a
analysis of carbonaceous and organic materials is substantially                  better understanding of the advantages and disadvantages of
lower allowing centennial-scale resolution chronologies in LPS                   the individual methods in dating of LPSs. Our observations
records (e.g., Song et al., 2012; Újvári et al., 2014c; Song et al.,             and conclusions are highly relevant for future studies that
2015). The method uses the radioactive decay of naturally                        focus on the interpretation of loess sequences to study the
occurring 14C in organic matter or carbonates to calculate the                   paleoclimatic and paleoenvironmental evolution in south-
time since the last equilibration with atmospheric CO2 or other                  eastern Europe and elsewhere.
carbon pools (e.g., dissolved inorganic carbon in aquatic
environments). Due to the half-life of 14C and analytical
limitations, maximum ages of 50–60 ka can typically be                           REGIONAL SETTING AND STUDY SITE
resolved with this approach for regular-sized (∼1 mg) samples.
Since the atmospheric 14C content has changed in the past, 14C                   The Lower Danube Basin (LDB) in southeast Romania (Figure 1)
ages are calibrated against reference curves to obtain absolute ages             is characterized by vast Pleistocene sedimentary deposits of
(e.g., Reimer et al., 2020). Nonetheless, the application of 14C                 considerable thickness, which are mostly of eolian and fluvial
analysis to loess is frequently limited by the absence/scarcity of               origin. The deposits are incised by broad valleys and alluvial
suitable remains such as wood, charcoals, bones and carbonate                    plains of the Danube and its major tributaries. These broad
fossils (e.g., Haesaerts et al., 2010; Pigati et al., 2013; Újvári et al.,       alluvial valleys acted as the major dust source for the coarse
2014c; Moine et al., 2017). Moreover, 14C ages obtained on bulk                  components of the loess formed during the Pleistocene (Buggle
organic carbon (OC) can be biased by relocation of organic                       et al., 2008; Jipa, 2014). The loess deposits of the LDB reach
matter in loess, which may result in an underestimation of                       thicknesses of more than 50 m. The thickness and the mean grain
sedimentation ages (e.g., Hatté et al., 2001). In contrast to OSL                size of these loess deposits decrease with distance from potential
and 14C analyses, magnetic stratigraphy is an indirect and                       source areas, i.e., especially the river beds (Smalley and Leach,
correlative dating approach and includes age uncertainties that                  1978; Smalley et al., 2009; Jipa, 2014). The most intensively
are not easily quantified. The method can be used for sediments                   studied LPSs within the LDB are found on the Dobrogea
accumulated beyond the dating limit of radiocarbon and                           plateau (Figure 1; e.g., Buggle et al., 2009; Buggle et al., 2013;
luminescence techniques and is best applied to (several meter)                   Fitzsimmons and Hambach, 2014; Obreht et al., 2017), along the
long sequences (Heil et al., 2010; Song et al., 2018a; Zeeden et al.,            shores of the Black Sea (e.g., Necula et al., 2015) and along river

Frontiers in Earth Science | www.frontiersin.org                             3                                   January 2021 | Volume 8 | Article 598448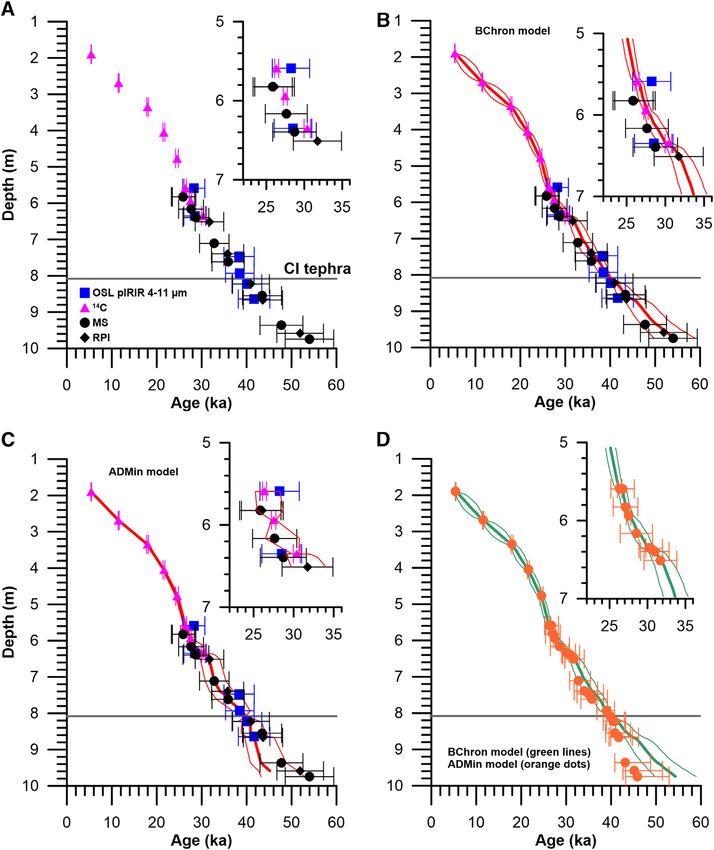
Scheidt et al. Chronology of the BAK LPS
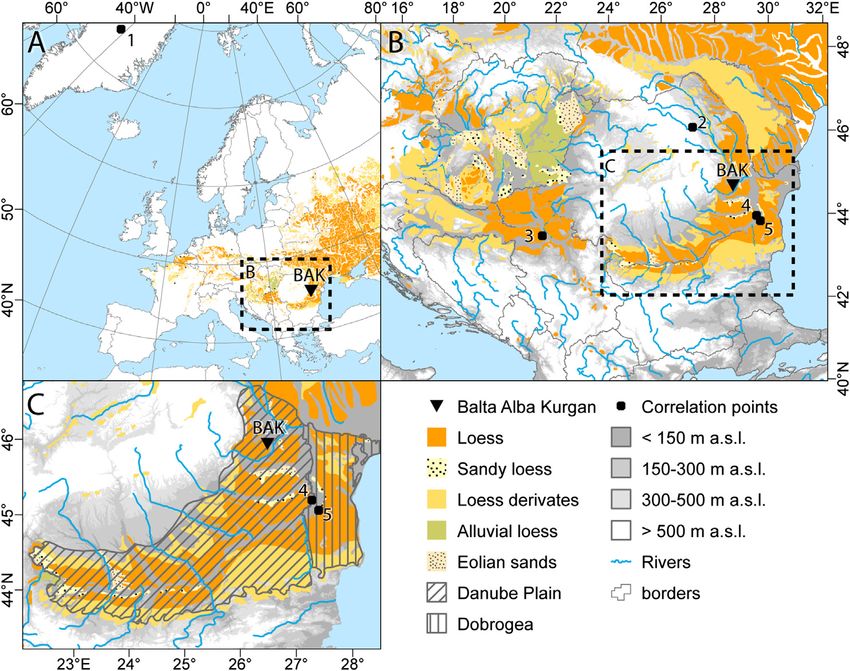
FIGURE 2 | Aerial view of the BAK site looking southeast. The location of the kurgan as well as the stratigraphic position of the tephra layer (pink line) are indicated.
The sampled sub-profiles are shown with white rectangles.
cuts of the Danube and its tributaries across the Danube Plain laterally continuous loose pinkish-whitish patches of coarse
(Constantin et al., 2014; Obreht et al., 2017; Antoine et al., 2019; silt, resembling other tephra occurrences within the Lower
Figure 1). These sections often exhibit several loess-soil couplets Danube loess (Veres et al., 2013; Obreht et al., 2017; Zeeden
representing glacial-interglacial-cycles. The forelands of the et al., 2018c). Below the tephra, up to 8.70 m depth, the loess is
Eastern Carpathians, however, are severely underrepresented carbonate-rich as well as bioturbated and strongly overprinted by
in loess research, although the area is covered by vast loess pedogenesis. Underneath, a dark reddish paleosol with two to
deposits. The BAK LPS (45°16’40’’N, 27°17’27’’E, ca. 46 m three distinct pedogenetic horizons is present down to 9.85 m
above mean sea level, Figure 1) is located in this area, approx. depth. Other (weakly developed) paleosols can be found between
40 km east of the foothills of the Carpathian Bend. It is exposed at 10.0 m and 10.2 m depth, as well as between 10.8 m and 11.4 m
a road cut of road DC13 dissecting the northern slope of a loess depth and are intercalated with carbonate-rich loess. The
plateau between the rivers Râmnicul Sărat and Buzău. The underlying loess reaches down to 13.2 m depth. A clay-rich,
Carpathian foothills to the West comprise thick Neogene dark greyish to blackish paleosol resembling vertisol features
deposits. The loess plateau frames a basin that includes the with vertical cracks lies underneath, atop a carbonate-rich
alkaline lake Balta Alba, located approximately 2 km east of loess, which becomes increasingly reddish towards a depth of
the section. Lake Balta Alba formed during the Holocene due around 14 m. The paleosol between 14.0 m and 14.5 m depth
to neotectonic subsidence in a paleo-channel of the Râmnicul exhibits chernozem-like characteristics. It overlies a carbonate-
Sărat (ILEC, 2019). rich loess horizon, which turns into loess with sub-mm sized
The sampled BAK sequence is ∼15.4 m thick. Several large pit- pores filled with organic material at 14.7 m depth. At the base of
grave burial mounds (kurgans) are preserved in the vicinity of the the section, waterlogged, hydromorphic loess and sands are
sampling site. The majority of these tumuli in the Lower Danube present.
area most likely date to the Late Neolithic-Early Bronze Age
transition (∼3 ka B.C.; Frı̂nculeasa et al., 2015). Our sampled
profiles are located close to the margin of a kurgan (Figures 2, 3). MATERIALS AND METHODS
The uppermost 0.78 m of the profile formed after kurgan
construction as indicated by the preservation of a non- Sampling
ploughed topmost horizon of a chernozem. Between 0.78 and For our multidisciplinary dating approach, four subsections
1.55 m depth, the sediments in the BAK profile consist of (BAK1 to BAK4) were defined along the BAK sequence
disturbed anthropogenic infill of the grave mound. Between (Figures 2, 3). The composite profile comprises BAK1
1.55 m and 2.10 m depth, the in-situ lower part of the primary (0–8.50 m), BAK2 (8–12 m) and BAK3 (11.5–15.4 m), which
Holocene chernozem (S0, nomenclature according to Marković are directly adjacent to one another (thus forming a vertical
et al., 2015) overlies bioturbated loess with a leopard skin pattern. sampling line) and located slightly to the South of the center of
From 2.10 m to 7.40 m depth, the sediment is a typical loess the kurgan. BAK4 is situated approximately 10 m to the South of
including pedogenetically overprinted intervals between the main profile (BAK1-3) and spans 3.66 m. Prior to sampling,
4.30–5.92 m and 6.40–6.95 m. A strongly bioturbated paleosol the outcrops were thoroughly cleaned to obtain fresh and
occurs between 7.40 m and 8.06 m depth. At 8.06–8.10 m depth a unweathered sediments. Samples for tephrochronological
macroscopically visible tephra layer has been identified as analyses were collected from the visible volcanic ash layer.
Frontiers in Earth Science | www.frontiersin.org 4 January 2021 | Volume 8 | Article 598448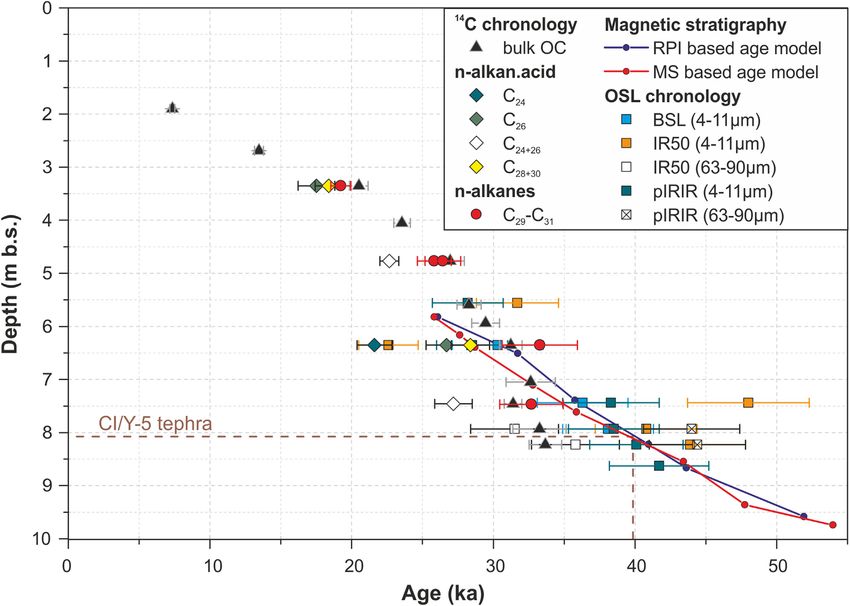
Scheidt et al.                                                                                                                   Chronology of the BAK LPS

                                                                                    Samples for OSL dating were taken using 20 cm long metal tubes.
                                                                                    Additionally, a sample of the surrounding 30 cm of sediment was
                                                                                    taken for radionuclide analysis (i.e., approximate penetration
                                                                                    depth of γ-radiation). In total, six samples were analyzed in
                                                                                    this study. For 14C analysis, twelve samples of 6 cm thickness
                                                                                    (∼20 kg of sediment each) adjacent to OSL samples were taken
                                                                                    from the BAK1 profile. Oriented paleomagnetic samples were
                                                                                    obtained from subsections BAK2 and BAK4 (Figure 2). These
                                                                                    subsections allow for cross-correlation with an overlap of
                                                                                    approximately 85 cm, which includes the tephra layer.
                                                                                    Sampling was performed by inserting square brass tubes of
                                                                                    2 cm edge length through an orientation frame into the wall.
                                                                                    Full spatial orientation was provided by means of magnetic
                                                                                    compass measurements combined with an inclinometer to
                                                                                    define the dip of the frame. The resulting sediment prisms
                                                                                    were subsequently carefully pushed from the tubes into cubic
                                                                                    plastic boxes of 8 cm3 volume to retain orientation. The vertical
                                                                                    space between the center of the samples is ∼2.1 cm. Overall 304
                                                                                    specimens were obtained: 120 from the BAK2 profile and 184
                                                                                    from the BAK4 profile. Twelve additional samples from the BAK1
                                                                                    and BAK2 subsections were selected for mineral magnetic analyses.

                                                                                    Tephra Geochemical Analysis
                                                                                    Bulk samples collected from the volcanic ash bed identified at
                                                                                    BAK were subjected to glass-shard geochemical analyses at the
                                                                                    Bayerisches GeoInstitut, University of Bayreuth, Germany.
                                                                                    Measurements were performed on thin sections of volcanic
                                                                                    glass shards containing sediment embedded in epoxy using a
                                                                                    JXA8200 microprobe (JEOL, JP) and single-grain, wavelength-
                                                                                    dispersive electron microprobe analysis (WDS-EPMA).
                                                                                    Measurements were performed using an accelerating voltage of
                                                                                    15 keV and a 6 nA beam current. Peak counting times were 10 s
                                                                                    for Na, 30 s for Si, Al, K, Ca, Fe and Mg, 40 s for Ti and Mn and
                                                                                    60 s for P. Precision is estimated at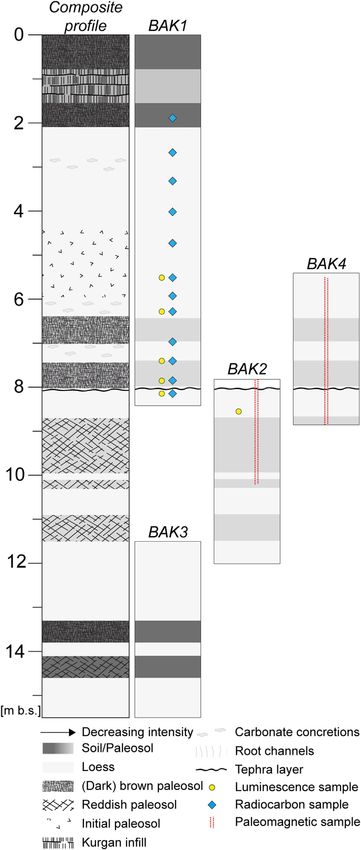
Scheidt et al.                                                                                                         Chronology of the BAK LPS

    Blue light emitting diodes at 470 nm (FWHM  20 nm) were              system and analyzed at the CologneAMS facility at the
used for the stimulation of the quartz samples and the                    University of Cologne, DE (Rethemeyer et al., 2019). Due to
luminescence signal was detected through a Hoya U-340 filter               the low OC content of the samples, which produced 0.30 to
(blue stimulated luminescence (BSL); Murray and Wintle, 2000;             0.63 mg C (less than 1 mg C needed for the routine
Murray and Wintle, 2003). The initial 0.8 s of the signal minus a         measurement), we determined the background of this specific
background of the last 4 s were used. Laboratory experiments              suite of samples with size matched standards at 42,700 ±
included preheat plateau tests using a series of preheat                  590 14C years (F14C  0.0049 ± 0.0004, fraction modern,
temperatures between 180°C and 280°C and dose recovery                    Reimer et al., 2004).
tests. For the dose recovery test, the samples were illuminated               For CSRA, ∼1 kg of the dried sediment was ground in an agate
with blue light emitting diodes for 100 s at room temperature and         mortar. The total lipid extract (TLE) was sequentially extracted by
a laboratory dose in the range of the natural dose was given to the       ultrasonication      using      methanol      (MeOH),      MeOH:
samples. Equivalent doses were calculated using the                       dichloromethane (DCM, 1:1, v/v) and DCM: hexane (Hex, 1:1,
arithmetic mean.                                                          v/v). The TLE was saponified with 0.5 M KOH in MeOH and
    Post-infrared infrared stimulated luminescence measured at            water (9:1, v/v) at 80°C for 2 h. After addition of water, neutral
290°C (p-IR IRSL290 or pIRIR290; Thiel et al., 2011) and infrared         lipids (including n-alkanes) were removed by liquid-liquid phase
stimulated luminescence measured at 50°C (IR50; Wallinga et al.,          separation using DCM. For extraction of n-alkanoic acids, the
2000) were used to measure the polymineral fine-grained                    remaining KOH mixture was acidified to pH 1 and the acid-
samples and the sand-sized potassium feldspar samples.                    fraction was extracted with DCM. n-Alkanes were eluted over
Stimulation was carried out with infrared diodes (870 nm,                 SiO2 columns with Hex. n-Alkanoic acids were methylated with
FWHM  40 nm) and the signals were detected through an                    MeOH and 12 M HCl (95:5, v/v) using MeOH of known 14C
interference filter (410 nm). The initial 4 s of the signal minus a        isotopic composition (F14CMeOH  0.0002) to form fatty acid
background of the last 20 s were used. Laboratory experiments             methyl esters (FAMEs).
included prior-IR stimulation temperature tests (Buylaert et al.,             Individual n-alkane and n-alkanoic acid homologs were
2012) using a range of temperatures from 50° to 220°C and dose            isolated using a 7680 Agilent gas chromatograph (GC, Agilent
recovery tests. For the dose recovery tests, the samples were             Technologies, United States) equipped with a CIS 4 injection
illuminated for 24 h in a Hönle SOL2 solar simulator and a                system (Gerstel, DE) and coupled to a preparative fraction
laboratory dose in the range of the natural dose was applied to           collector (PFC; Gerstel, DE). Trapping of individual
the samples. Equivalent doses were calculated using the                   compounds was achieved at room temperature. For
arithmetic mean. Fading tests (Auclair et al., 2003) were                 subsequent processing, individual compounds were flushed
carried out for all samples for the IR50 measurement                      from the glass traps with 1 ml DCM. The purity of each
protocol. IR50 ages were corrected for fading following the               isolated compound was determined by GC-FID (Agilent
approach of Huntley (2006).                                               7890B, Agilent Technologies, United States) and compounds
    For the determination of the environmental dose rate,                 with purities >98% were processed further. Two molecular
radionuclide concentrations of 238U, 232Th and 40K were                   standards C18 n-alkane (Fluka, Prod. No. 74691-5g, Lot.
measured using high-resolution gamma-ray spectrometry. The                0001448903 with an F14C value of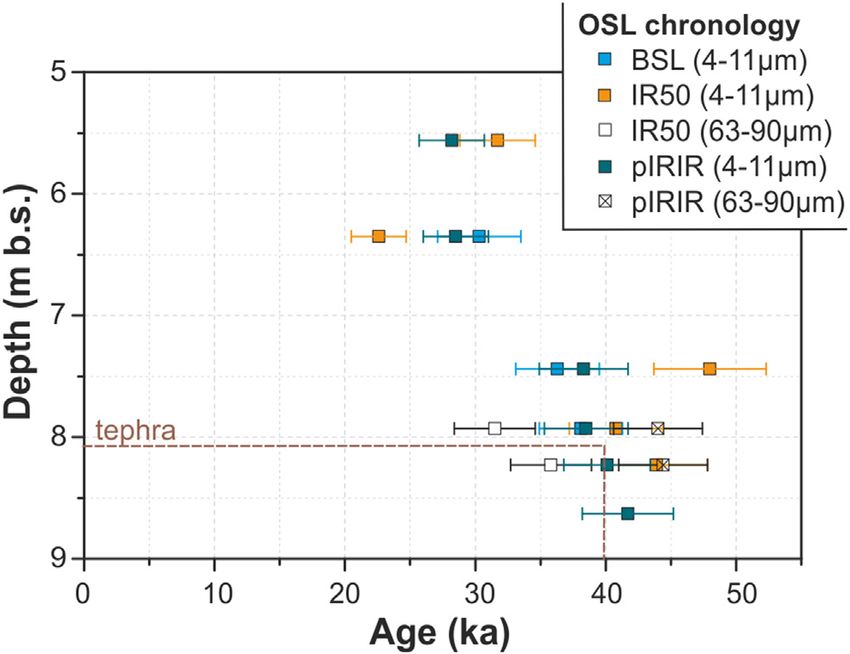
Scheidt et al.                                                                                                         Chronology of the BAK LPS

and FAMEs for the addition of one methyl group added during              susceptibility data of the BAK pmag composite to the NGRIP
                                                                          18
transesterification using mass balance.                                   δ O record (Andersen et al., 2004) and to different loess records
                                                                         from the region (Figure 1). As for the RPI correlation, the
Magnetic Stratigraphy                                                    individual tie points result from wiggle matching of prominent
For age determination using magnetic stratigraphy, the variations        fluctuations. For the time interval of interest, we use the data of
of the relative paleointensity (RPI) of the Earth’s magnetic field        the loess sites Rasova (Figure 1; Zeeden et al., 2016; Zeeden et al.,
recorded in the loess sequence and the magnetic susceptibility of        2018c; Zeeden et al., 2019) and Vlasca in Romania (Figure 1;
the sediment were used. Magnetic measurements were conducted             Obreht et al., 2017). Please note that the magnetic susceptibility of
in different laboratories. A list of the devices used in the             Vlasca below the Campanian Ignimbrite/Y-5 tephra layer
individual labs is given in Supplement 2 (Supplementary                  includes new data for which the age model is preliminary
Table 4). The measurements performed include determination               only. Additionally, we correlate BAK to the magnetic
of the mass and the magnetic susceptibility (given as mass specific       susceptibility record of the Batajnica site in Serbia (Figure 1;
magnetic susceptibility χ) and frequency dependence of magnetic          Marković et al., 2009; Basarin et al., 2014) for which OSL ages
susceptibility (κFD) of the oriented samples. The measurement of         have recently been published (Avram et al., 2020). An overview of
the natural remanent magnetization (NRM) was followed by                 the data used for the age models at the respective loess sites used
progressive alternating field (AF) demagnetization in 12 steps up         for correlation with the BAK site is shown in Supplementary
to 80 mT. The data was plotted in orthogonal vector diagrams             Table 3.
(Zijderveld, 1967) and analyzed using the program Remasoft 3.0               The age models resulting from the paleomagnetic dating
(Chadima and Hrouda, 2006). The characteristic remanent                  approaches arise from linear interpolation between age tie
magnetization (ChRM) was isolated using principal                        points. The age-depth relationship was linearly extended to
component analysis (Kirschvink, 1980) embedded in the                    include the top and the bottom of the sequence.
Remasoft 3.0 software (Chadima and Hrouda, 2006). For most
samples the ChRM was determined between the 15 mT and the                Age Modeling
40 mT AF step. In every second sample, an anhysteretic remanent          To combine the age information of the individual dating
magnetization (ARM) was imparted by superposition of a 100 µT            methods, we used two different Bayesian age-depth modeling
DC field and 100 mT alternating field. Subsequently the ARM was            approaches. The Bchron software (Parnell et al., 2008; Parnell,
demagnetized in a 25 mT alternating field. The RPI was                    2018) runs in the R environment (R Core Team, 2020). The
determined as suggested by Levi and Banerjee (1976),                     BChron age-depth modeling approach relies on an increasing
i.e., dividing the remanence of the sample measured after                sediment column and a gamma distribution as prior information
25 mT AF demagnetization by the remanence of the ARM                     for a sediment accumulation model. The ages and their
after the 25 mT AF demagnetization. The value of 25 mT was               uncertainties are assumed to be correct. We also apply the
chosen to ensure magnetic cleaning of viscose remanence, whilst          ADMin approach (Zeeden et al., 2018a), which is originally
a reasonable amount of magnetization is still preserved.                 tailored to luminescence ages. Here, we apply this model to
Furthermore, mineral magnetic investigations were performed              the combination of ages from different dating methods.
on 12 selected samples to ascertain whether the sediment had             Initially, it reconstructs a probability density for the random
preserved paleomagnetic information over geological time scales.         and systematic parts of uncertainty, which represent
Besides determination of the hysteresis parameters, the                  unsystematic random effects and a possibly systematic offset,
temperature dependence of the magnetic susceptibility (κTD)              respectively. It then uses the random part for modeling and re-
was measured.                                                            combines the model results with systematic uncertainty. This
    To provide chronostratigraphic constraints by magnetic               model defines no priors about sedimentation rates, but resamples
stratigraphy we correlate the magnetic properties of the BAK             ages and uncertainty ‘as is’ and uses combinations, which
site to those of independently dated reference records. We               represent chronological order.
visually align our RPI data with the upgraded version of the                 After careful inspection of the results, individual age data for
high-resolution global paleointensity stack GLOPIS-75 (Laj et al.,       each method were selected as described below (Luminescence
2004) and GLOPIS-GICC05 (Laj and Kissel, 2015). Additionally,            dating, Radiocarbon Analysis and Magnetic Stratigraphy). 14C
we compare the data with the RPI values gained from the                  ages are calibrated using the IntCal20 dataset (Reimer et al., 2020)
archaeological site of Poiana Ciresului in northeastern                  and reported using the 2σ uncertainty ranges (Table 2). When
Romania (Figure 1; Zeeden et al., 2009; Zeeden et al., 2011).            multiple 14C ages were included from individual layers, they were
To reduce noise, the RPI of the BAK profile is smoothed with a            combined by averaging calibrated age ranges. An uncertainty of
three-point running average. Please note that the original age           10% is assigned to the ages resulting from magnetic stratigraphy
model of Poiana Ciresului (Zeeden et al., 2009; Zeeden et al.,           in order to provide a conservative estimate. Reported OSL ages
2011; Zeeden et al., 2020; Zeeden and Hambach, 2020) is based on         are given with 1σ uncertainty, which is considered as such in the
an RPI correlation for which the Laschamp geomagnetic                    age model. The tephra layer identified as the Campanian
excursion is set at 38.5 ka BP instead of 41 ka BP (Laj and              Ignimbrite/Y-5 (see Tephrochronology) is embedded in the age
Kissel 2015). We therefore show an adjusted age model in this            model using its reported 40Ar/39Ar age of 39.85 ± 0.14 ka (Giaccio
study that correlates the four tie points used in Zeeden et al.          et al., 2017). Please note, calibrated radiocarbon ages refer to AD
(2009) with GLOPIS-GICC05. We also compare the magnetic                  1950, while there is no reference date for luminescence dating and

Frontiers in Earth Science | www.frontiersin.org                     7                                    January 2021 | Volume 8 | Article 598448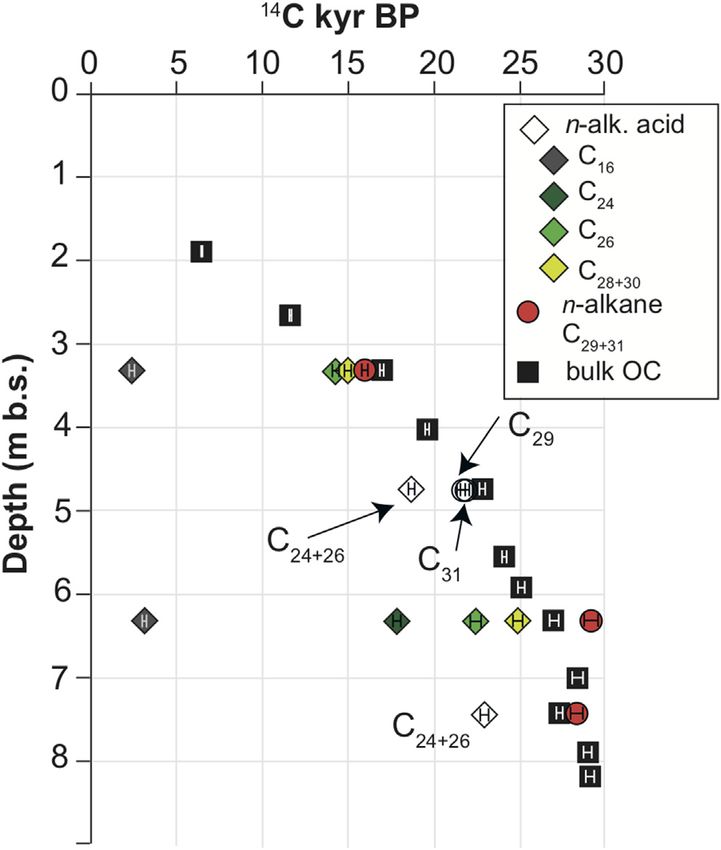
Scheidt et al. Chronology of the BAK LPS
magnetic stratigraphy. For modeling, we did not adjust ages to a
28.2 ± 2.5
28.5 ± 2.5
38.3 ± 3.4
38.5 ± 3.2
44.0 ± 3.4
40.1 ± 3.3
44.4 ± 3.4
41.7 ± 3.5
Age (ka)
pIRIR290
TABLE 1 | Luminescence dating results showing sampling depths, radionuclide concentrations, fading g-values, dose rates, equivalent doses (De) and ages (1σ uncertainty) for all applied measurement protocols. IR50 ages
uncorr.
common reference point in time, since the offset of c. 70 years is
well within the uncertainty ranges of the respective methods and
also falls within the temporal resolution of our sampling intervals
(which is ∼100 yr for magnetic stratigraphy and ∼200 yr for OSL
30.3 ± 3.2
36.3 ± 3.2
38.1 ± 3.2
BSL Age
(ka)
and 14C dating). Therefore, adjusting the age scales in this study
—
—
—
—
—
would imply a degree of precision that is not appropriate. The R
script for age-depth modeling and data interpolation is available
(ka) Fading
31.7 ± 2.9
22.6 ± 2.1
48.0 ± 4.3
40.8 ± 3.6
31.5 ± 3.1
43.9 ± 3.9
35.8 ± 3.1
IR50 Age
in the Supplements 5 and 6.
corr.
—
RESULTS
113.7 ± 5.7
108.9 ± 5.4
134.0 ± 6.2
140.0 ± 7.0
137.0 ± 6.9
149.5 ± 7.5
142.1 ± 7.1
148.8 ± 7.9
pIRIR290
De(Gy)
Tephrochronology
Analyses of glass shards from the visible tephra show
85.3 ± 4.3 114.0 ± 6.6
89.1 ± 4.5 113.6 ± 6.0
95.0 ± 7.4
homogeneous SiO2 concentrations averaging 60.76 wt%,
BSL De
(Gy)
associated with 18.41 wt% Al2O3, 2.77 wt% FeO, 0.40 wt%
—
—
—
—
—
TiO2, 1.69 wt% CaO, 5.97 wt% Na2O and 7.02 wt% K2O (for
full details on analytical data see Supplement 4, Supplementary
64.7 ± 3.2
67.1 ± 3.4
80.2 ± 4.5
92.0 ± 4.6
93.0 ± 4.7
IR50 De
Tables 6 and 7). The typical phonolite to trachyte composition of
(Gy)
—
glass shards suggests that the tephra layer at BAK pertains to the
Campanian Ignimbrite/Y-5 tephra (CI/Y5). This volcanic ash
layer has been visually and geochemically identified in many loess
4.16 ± 0.20
3.94 ± 0.19
3.98 ± 0.23
4.15 ± 0.20
3.49 ± 0.14
4.25 ± 0.20
3.59 ± 0.14
4.07 ± 0.19
dose rate
pIRIR290
(Gy/ka)
sequences throughout the Lower Danube Basin (Constantin et al.,
2012; Fitzsimmons et al., 2013; Veres et al., 2013; Anechitei-
Deacu et al., 2014; Obreht et al., 2017), where it forms an
rate (Gy/ka) rate (Gy/ka)
important stratigraphic marker horizon and chronological tie-
3.23 ± 0.14
3.57 ± 0.16
3.39 ± 0.15
BSL dose
point (Zeeden et al., 2018c) with an 40Ar/39Ar age of 39.85 ±
—
—
—
—
—
0.14 ka (Giaccio et al., 2017).
Luminescence Dating
3.81 ± 0.22
3.61 ± 0.21
3.98 ± 0.23
3.80 ± 0.22
3.40 ± 0.16
3.90 ± 0.22
3.50 ± 0.14
IR50 dose
The fine-grained quartz samples showed bright BSL signals with a
—
fast signal decay (Supplement 1, Supplementary Figure 1).
Preheat plateau tests for quartz sample BAK1-2 revealed no
1.66 ± 0.02 3.86 ± 0.52
1.61 ± 0.03 1.23 ± 0.80
3.10 ± 0.17 10.58 ± 0.62 1.77 ± 0.02 3.28 ± 0.49
2.98 ± 0.14 10.69 ± 0.53 1.61 ± 0.03 2.69 ± 0.82
2.98 ± 0.14 10.69 ± 0.53 1.61 ± 0.03 1.30 ± 0.55
3.01 ± 0.16 10.81 ± 0.66 1.70 ± 0.02 2.20 ± 0.62
3.01 ± 0.16 10.81 ± 0.66 1.70 ± 0.02 1.33 ± 0.50
dependency of the equivalent dose with temperatures between
IR50 g
value
180 and 280°C. For sample BAK1-5, we did not observe a
—
dependency of the equivalent dose with temperatures between
180 and 200°C (Supplementary Figure 2A). Dose recovery tests
2.90 ± 0.13 10.16 ± 0.50 1.64 ± 0.03
for samples BAK1-2, BAK1-3 and BAK1-5 showed that the
K (%)
laboratory given dose was recovered within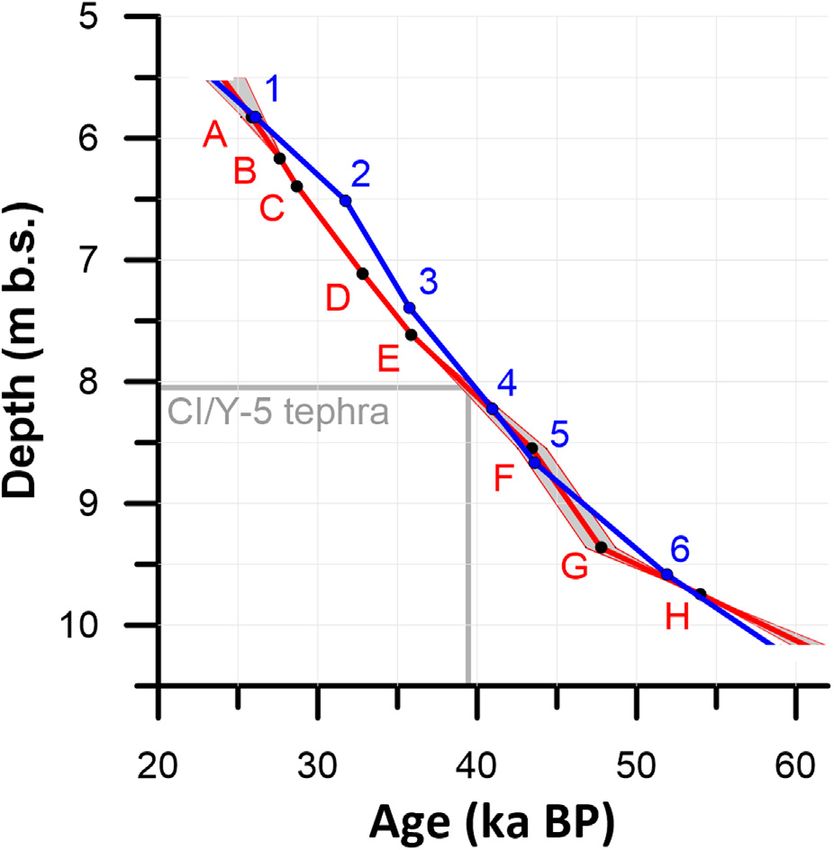
Scheidt et al.                                                                                                                       Chronology of the BAK LPS

                                                                                        older than the n-C28+30 alkanoic acids (15,950 ± 170 14C yr BP).
                                                                                        At 4.77 m depth, one 14C age could be obtained for n-C24+26
                                                                                        alkanoic acids (18,700 ± 190 14C yr BP). Concurrent n-C29 and
                                                                                        n-C31 alkanes are older (21,600 ± 290 14C yr BP and 22,000 ±
                                                                                        310 14C yr BP, respectively) than the n-C24+26 alkanoic acids.
                                                                                        At 6.35 m depth, a total of 5 compounds could be analyzed.
                                                                                        Analogous to the sample from 3.35 m depth, 14C ages increase
                                                                                        with increasing chain length: n-C16 alkanoic acid has an age of
                                                                                        3,190 ± 115 14C yr BP, n-C24 alkanoic acid (17,850 ± 230 14C yr
                                                                                        BP) and n-C26 alkanoic acid (22,500 ± 370 14C yr BP) are younger
                                                                                        than n-C28+30 alkanoic acids (25,000 ± 350 14C yr BP). The value
                                                                                        obtained for the n-C29+31 alkanes shows the highest 14C age
                                                                                        (29,200 ± 570 14C yr BP). At 7.47 cm depth, n-C24+26 alkanoic
                                                                                        acids (23,100 ± 290 14C yr BP) are younger than n-C29+31+33
                                                                                        alkanes (28,400 ± 420 14C yr BP) in agreement with the age
                                                                                        patterns observed in the overlying samples.

  FIGURE 4 | Luminescence ages depicted in an age-depth plot. The
                                                                                        Magnetic Stratigraphy
  location of the tephra layer is shown with a dashed line. OSL ages are given as
                                                                                        The paleomagnetic samples of subsections BAK2 and BAK4 were
  average and error bars show standard error (1σ).                                      combined into a composite profile by aligning their magnetic
                                                                                        susceptibility curves (Supplement 3, Supplementary Figure 8).
                                                                                        The depth scale of this BAK pmag composite corresponds to the
(8.63 m; Figure 3). We measured fading rates between 1.30 ±                             depth scale of the main profile (BAK1-3). Overall, 236 oriented
0.55% g2days and 3.86 ± 0.52 g2days for the IR50 signals and                            samples are included, of which the upper 109 and lower 127
between −2.01 ± 0.37% g2days and −0.06 ± 0.06% g2days for the                           originate from the BAK4 and the BAK2 profile, respectively. The
pIRIR290 signals. Mean equivalent doses are lower for IR50                              magnetic properties are reported and discussed in Supplementary
measurements ranging from 64.7 ± 3.2 Gy to 93.0 ± 4.7 Gy for                            Section 3 (Mineral Magnetic analyses and paleomagnetic evidence).
IR50 and from 108.9 ± 5.4 Gy to 149.5 ± 7.5 Gy for pIRIR290                                In contrast to the absolute dating techniques used in this study,
(Table 1). Dose rates are between 3.40 ± 0.16 Gy/ka and 3.98 ±                          the ages obtained via correlation of the magnetic evidence of the
0.23 Gy/ka for IR50 and between 3.49 ± 0.14 Gy/ka and 4.25 ±                            BAK site with reference records (Supplementary Table 3) are a
0.2 Gy/ka for pIRIR290, respectively. This results in fading                            result of correlative interpretation (see Magnetic Stratigraphy).
corrected IR50 ages between 22.6 ± 2.1 ka and 43.9 ± 3.9 ka                             Because of the scarcity of high resolution paleomagnetic records
(Figure 4). Post-IRIR290 ages for the corresponding samples are                         from the region for the relevant time range, the directional data
between 28.2 ± 2.5 ka and 44.4 ± 3.4 ka (Figure 4). The pIRIR                           do not contribute to the magnetic stratigraphy in this study.
ages were not fading corrected due to the low values measured.                          However, directional data of the ChRM of the BAK pmag
The calculated ages of both sample sets are in good agreement for                       composite are available in the Supplementary Section 3.3,
50% of the samples and results differ for those samples with low                        including a comparison with the inclination and the
fading rates (∼1.3% g2days) as well as for sample BAK1-3 (7.47 m                        declination determined at the Poiana Ciresului site.
depth; Table 1).

Radiocarbon14 Dating                                                                    DISCUSSION
Twelve bulk OC C ages were obtained for subsection BAK1
(Figure 3). In the following, conventional 14C ages are reported.                       Luminescence Dating
The uppermost sample collected from the Holocene soil at 1.90 m                         Dating of quartz (BSL) is often deemed to be the most reliable
depth provided an age of 6,440 ± 60 14C yr BP (Table 2; Figure 5).                      luminescence technique, because quartz signals bleach quickly
Up to 7.05 m depth, 14C ages increase with depth and appear in                          during transport allowing the signal to build up from zero after
stratigraphic order (28,400 ± 280 14C yr BP at 7.05 m). Below                           deposition. In contrast, feldspar and polymineral IR50 signals
7.05 m depth, 14C ages range from 27,300 ± 220 to 29,100 ±                              bleach at a lower rate, but might suffer from signal loss
220 14C yr BP and are either reversed or agree in consecutive                           (anomalous fading) after deposition (Wintle, 1973). Feldspar
depth intervals (Figure 5).                                                             and polymineral pIRIR signals show the slowest bleaching
    Compound-specific 14C ages of n-alkanes and n-alkanoic acids                         rates, but are supposedly less prone to anomalous fading
were analyzed for four depths (Table 2; Figure 5). In general, the                      (Buylaert et al., 2012). The signal loss can be corrected for, but
14
   C ages of n-alkanoic acids increase with increasing molecular                        fading correction requires various assumptions (Thomsen et al.,
weight (chain length). At 3.35 m depth, n-C16 alkanoic acid has                         2008; Guérin et al., 2015). Due to the different bleaching rates,
an age of 2,430 ± 110 14C yr BP, while n-C26 and n-C28+30                               similar ages for three different signals of the same sample are a
alkanoic acids have 14C ages of 14,300 ± 230 and 15,100 ±                               reliable indicator of complete resetting of the luminescence signal
230 14C yr BP, respectively. The n-C29+31 alkanes are slightly                          prior to deposition (Murray et al., 2012; Klasen et al., 2018).

Frontiers in Earth Science | www.frontiersin.org                                    9                                   January 2021 | Volume 8 | Article 598448
Scheidt et al. Chronology of the BAK LPS
TABLE 2 | Radiocarbon isotope data and ages obtained on bulk organic carbon (bulk OC) and n-alkanes and n-alkanoic acids (alk. acids). Calibrated ages are given as 2σ
uncertainty ranges.
Depth Sample ID AMS ID Dated material F14C 14
C age (year BP) Age (year cal BP)
(m b.s.)
1.9 BAK1-11 Col6033 Bulk OC 0.4483 ± 0.0033 6,440 ± 60 7,255–7,432
2.69 BAK1-10 Col6034 Bulk OC 0.2356 ± 0.0025 11,600 ± 90 13,299–13,612
3.35 BAK1-9 Col6035 Bulk OC 0.1212 ± 0.0019 16,950 ± 130 20,178–20,835
Col6355 n-C29+31 alkane 0.1370 ± 0.0029 15,950 ± 170 18,883–19,588
Col6359 n-C16 alk. acid 0.7387 ± 0.0097 2,430 ± 110 2,302–2,754
Col6360 n-C26 alk. acid 0.1684 ± 0.0047 14,300 ± 230 16,869–18,166
Col6361 n-C28+30 alk. acid 0.1526 ± 0.0042 15,100 ± 230 17,903–18,852
4.05 BAK1-8 Col6036 Bulk OC 0.0870 ± 0.0012 19,600 ± 110 23,267–23,846
4.77 BAK1-7 Col6037 Bulk OC 0.0582 ± 0.0012 22,800 ± 160 26,467–27,457
Col6356 n-C29 alkane 0.0680 ± 0.0024 21,600 ± 290 25,234–26,429
Col6357 n-C31 alkane 0.0644 ± 0.0025 22,000 ± 310 25,801–27,059
Col6362 n-C24+26 alk. acid 0.0972 ± 0.0022 18,700 ± 190 22,324–22,997
5.59 BAK1-6 Col6038 Bulk OC 0.0495 ± 0.0011 24,100 ± 180 27,856–28,707
5.94 BAk1-5b Col6039 Bulk OC 0.0438 ± 0.0012 25,100 ± 210 28,968–29,951
6.35 BAK1-5 Col6040 Bulk OC 0.0345 ± 0.0011 27,000 ± 240 30,831–31,632
Col6358 n-C29+31 alkane 0.0264 ± 0.0019 29,200 ± 570 31,953–34,612
Col6363 n-C16 alk. acid 0.6723 ± 0.0092 3,190 ± 115 3,076–3,691
Col6364 n-C24 alk. acid 0.1083 ± 0.0030 17,850 ± 230 20,988–22,226
Col6365 n-C26 alk. acid 0.0606 ± 0.0026 22,500 ± 370 25,967–27,416
Col6366 n-C28+30 alk. acid 0.0446 ± 0.0019 25,000 ± 350 27,704–29,053
7.05 BAK1-4 Col6041 Bulk OC 0.0290 ± 0.0010 28,400 ± 280 31,768–33,502
7.47 BAK1-3 Col6042 Bulk OC 0.0334 ± 0.0009 27,300 ± 220 31,082–31,694
Col6663 n-C29+31+33 alkane 0.0291 ± 0.0015 28,400 ± 420 31,575–33,819
Col6664 n-C24+26 alk. acid 0.0563 ± 0.0020 23,100 ± 290 26,515–27,840
7.93 BAK1-2 Col6043 Bulk OC 0.0271 ± 0.0008 28,900 ± 240 32,322–34,198
8.23 BAK1-1 Col6044 Bulk OC 0.0266 ± 0.0007 29,100 ± 220 33,099–34,248
Ideally, we can distinguish a partially bleached signal from a presented here) as it was shown that quartz signals are
completely bleached signal by comparison of the fading corrected problematic for doses above 150 Gy (fine-grain) and 250 Gy
IR50 with the pIRIR290 signal and the BSL signal. We applied this (coarse-grain), respectively (Avram et al., 2020). Nevertheless,
approach to samples from three depth intervals. For sample the corresponding quartz and pIRIR290 ages of samples BAK1-2,
BAK1-2 (4–11 µm; 7.93 m depth), the obtained ages are BAK1-3 and BAK1-5 are a good indicator that pIRIR290 is a
similar for all three protocols and we conclude that fading suitable dating protocol for the section.
correction of the IR50 signal was successful and the Part of the uncertainty related to the luminescence age
luminescence signal was completely reset prior to deposition. calculation is the estimation of the paleo-water content. Most
A complete reset would be expected for eolian sediments. For this studies use an average water content value for the entire period
sample, all three protocols appear to be equally suitable for dating. between sediment accumulation and sampling. For most samples,
For sample BAK1-5 (4–11 µm, 6.35 m depth), BSL and pIRIR290 this period covers different paleoclimatic conditions, suggesting
ages are in good agreement, while the IR50 age is younger. This is that sediment water contents are not constant. For the BAK
likely due to the low fading rate of 1.23 ± 0.8%. For sample BAK1- samples we measured water contents between 1 and 30%, but it is
3 (4–11 µm, 7.47 m depth), BSL and pIRIR290 ages agree well possible that samples dried out during transport if sample
ruling out incomplete bleaching, while the IR50 age is significantly containers were not completely air tight. Therefore, we use the
older (Table 1). For two of the three samples, the IR50 grain size composition of each sample to estimate a paleo-water
luminescence signal in combination with fading correction content (see Supplement 1, Supplementary Figure 4) of 25 ±
results in different age estimates, which is most likely due to 10% for samples with a fine silt and clay content above 25%
the IR50 fading correction and the underlying assumptions and 15 ± 10% for samples below this value.
included in the modeling approach (Thomsen et al., 2008; The fine-grain (4–11 µm) pIRIR290 and BSL ages of BAK1-1
King et al., 2018). Therefore, for dating the BAK profile we (8.23 m depth) and BAK1-2 (7.93 m depth), which bracket the
regard the fading corrected IR50 ages to be less robust than CI/Y-5 tephra agree well with its established 40Ar/39Ar age of
the pIRIR290 ages obtained on the polymineral fine grain 39.85 ± 0.14 ka (Giaccio et al., 2017), while coarse-grain
fraction. As outlined above, the BSL and pIRIR290 protocols (63–90 µm) pIRIR290 ages at 8.23 m and 7.93 m depth seem to
provide equally robust age estimates for the BAK profile. overestimate the tephra age slightly (∼1 ka when 1σ error is
However, we focused on pIRIR290 dating for the lowermost considered; Figure 4). The older coarse-grain feldspar ages
samples, because we did not want to rely solely on quartz may be explained by contributions of coarse-grained tephra
dating for ongoing measurements of older samples (not particles that were not removed completely during sample
Frontiers in Earth Science | www.frontiersin.org 10 January 2021 | Volume 8 | Article 598448Scheidt et al. Chronology of the BAK LPS
Radiocarbon Analysis
Sedimentary bulk OC contains a mix of organic matter (OM)
from different sources with different 14C isotope signatures that
may either be deposited syn-depositionally or introduced post-
depositionally. For example, OM reworked from older deposits
(e.g., eroded from bedrock or soils in the source area of the dust)
may have a 14C isotope signal, which is older than the actual age
of loess deposition or potentially radiocarbon-dead. In contrast,
OM introduced after sediment deposition, e.g., leaching by
percolating pore water, may be younger than the sediment
(e.g., Hatté et al., 2001). Typically, aboveground biomass is
preferably used for dating terrestrial sediments, since roots can
extend up to several meters below the surface introducing
modern C into deeper layers of the loess profile. In addition
to macroscopic plant remains, epicuticular leaf wax lipids such as
long-chain n-alkanes (n-C27 to n-C35) and n-alkanoic acids
(n-C24 to n-C32) are preserved in sedimentary records. As
done by us in the BAK profile, these lipids have previously
been tested as target OC for loess 14C chronologies (e.g.,
Häggi et al., 2014; Haas et al., 2017; Zech et al., 2017;
Bliedtner et al., 2020). In the following we will discuss to what
extent the 14C ages of bulk OC and of leaf wax lipids provide a
representative estimate of the actual age of sediment deposition in
the BAK profile.
Above 7.05 m depth, bulk OC 14C ages successively increase
with depth, suggesting that bulk OC may provide meaningful age
FIGURE 5 | Conventional 14C ages of bulk organic carbon (OC) and of information (Figure 5). Below this depth, 14C ages do not
n-alkanes and n-alkanoic acids versus depth. Symbols include error bars. increase continually, which could be due to very high
sedimentation rates in this part of the profile. However, an age
reversal at 7.47 m depth indicates that mixing with younger OM
preparation. Dating tephra deposits using luminescence techniques (e.g., by bioturbation) likely influences 14C ages in this part of the
is not always straightforward, even when the surrounding profile (Figures 2, 5). This interpretation is strongly supported by
sediments are dated (cf. Bösken and Schmidt, 2020). the presence of the independent age marker (CI/Y-5 tephra layer,
Independent of the dated grain-size range, samples taken in 39.85 ± 0.14 ka) at ∼8 m depth, since the calibrated bulk OC 14C
close proximity to the tephra layer are particularly critical, since age from below this depth yields 32.71–33.87 cal ka BP (Table 2).
fresh geologic deposits are prone to relocation of radioelements Analogous to soils, loess deposits are not closed systems and the
14
leading to an incorrect ascertainment of dose rates (Krbetschek C isotope signature of bulk OC or individual compounds is
et al., 1994; Biswas et al., 2013; Bösken and Schmidt, 2020). In the determined by their intrinsic turnover times determined by input
Middle and Lower Danube Basins, loess layers embedding the CI/ vs. output flux (e.g., Trumbore, 2009). Soils are also prone to
Y-5 tephra have been often dated using luminescence dating physical disturbance such as bioturbation by roots, which
methods (Constantin et al., 2012; Fitzsimmons et al., 2013; penetrate into deeper horizons and admix younger OM into
Veres et al., 2013; Anechitei-Deacu et al., 2014; Bösken et al., older sediments (e.g., Zech et al., 2017). Similar to leaves, roots
2017; Obreht et al., 2017; Zeeden et al., 2018c): depending on the contain some proportion of n-alkanoic acids, with dominance of
specific dose rate of the profiles, equivalent doses of loess layers the n-C24 homolog (e.g., Wiesenberg et al., 2012). In the BAK
above the CI/Y-5 tephra range from 114 ± 7 Gy to 200 ± 4 Gy for profile, n-C24 alkanoic acid is less 14C-depleted than bulk OC,
fine-grained quartz and 104 ± 6 Gy to 221 ± 12 Gy for fine-grained suggesting the presence of “younger” root-derived material in the
polymineral pIRIR290 measurements, respectively, while values older BAK sediments (Figure 5). Evidence for admixture of
below the tephra layer range from 136 ± 6 Gy to 286 ± 9 Gy younger OC throughout the loess sequence also comes from
(fine-grained quartz) and from 172 ± 12 Gy to 193 ± 4 Gy (fine- the two 14C ages obtained on n-C16 alkanoic acids from 3.35 and
grained polymineral pIRIR290), respectively. These values result in 6.35 m depth. Both alkanoic acids are significantly younger than
ages between 26–44 ka above and 39–57 ka below the tephra. In the the other analyzed OC fractions from the same sediment samples
BAK sequence, equivalent doses and ages are in the same age range with offsets of >25 kyr. Short-chain n-C16 and n-C18 alkanoic
as reported in those studies. This highlights the consistency of acids are produced by plants (leaves and roots, e.g., Wiesenberg
luminescence ages among the BAK site and other loess sites in the et al., 2012) but also derive from microbial sources (e.g.,
region. Given the fact that fine-grain pIRIR290 results seem to phospholipid n-alkanoic acids in soils; Zelles, 1999).
provide the most accurate age around the tephra, we only use the Admixture of OC from roots and microbes with “younger”
fine-grain pIRIR290 ages for our integrated age-depth model. 14
C isotope signatures has particularly large effects on
Frontiers in Earth Science | www.frontiersin.org 11 January 2021 | Volume 8 | Article 598448Scheidt et al. Chronology of the BAK LPS relatively old samples and likely limits the applicability of bulk TABLE 3 | Tie points of RPI correlation (1–6, cf. Figure 6) assigned to the ages OC 14C dating in loess deposits to sediments
Scheidt et al.                                                                                                                                      Chronology of the BAK LPS

the RPI in the BAK composite, but is supported by the                                       record of the Poiana Ciresului site does not extend below the
stratigraphic position just below the CI/Y-5 tephra layer                                   Laschamp geomagnetic excursion, a comparison with BAK is not
(Figure 6). Thus, this excursion defines tie point 4 (8.22 m).                               possible for the complete BAK pmag composite profile. In the
Using this tie point, the BAK record can be directly linked to the                          lowermost part of the BAK pmag composite, the RPI record
RPI record of Poiana Ciresului. However, even though Mono                                   shows a similar trend matching two different sections of the
Lake and Laschamp can be distinguished at the Poiana Ciresului                              GLOPIS-GICC05 record, i.e., at 51.9 ka and 46.9 ka. Considering
site (Zeeden et al., 2009), the magnetic record is partly corrupted                         the thickness of the BAK LPS and the lack of macroscopic
due to the high number of archeological layers (Nițu et al., 2019)                          evidence suggesting an increase of the accumulation rate such
and a visual side-by-side comparison is difficult. Because the RPI                           as sandy layers or a general increase in grain size, we tentatively

  FIGURE 6 | Correlation of the BAK pmag composite. The position of the CI/Y-5 tephra is indicated as a grey horizontal line. RPI of BAK vs. depth is correlated (blue
  lines) with GLOPIS-GICC05 vs. age and compared to the RPI vs. age of the Poiana Ciresului site. The tie points are shown by blue numbers (1-6, cf. Table 3). The
  positions of geomagnetic excursions are noted. The blue arrow is described in the text. The χ vs. depth curve of BAK is correlated (red lines) with the χ vs. age curves of
  the sites Rasova and Vlasca, the χ vs. depth curve of Batajnica (note different scale) and the NGRIP δ18O (Greenland interstadials are numbered). Tie points of the
  magnetic susceptibility correlation are labeled A to H (cf. Table 3). Examples of stylized representations of the trend of the magnetic susceptibility in the lower part are
  shown with purple lines next to Vlasca and BAK. Tie points labeled with question marks are ambiguous and not considered for age modeling.

Frontiers in Earth Science | www.frontiersin.org                                       13                                            January 2021 | Volume 8 | Article 598448
Scheidt et al.                                                                                                             Chronology of the BAK LPS

favor the correlation that leads to an age of 51.9 ka instead of             susceptibility towards larger depth can be recognized more or less
46.9 ka (blue arrow in Figure 6). This solution results in a                 clearly in all magnetic susceptibility records. Stylized
moderate decrease of accumulation that could be explained by                 representations of this trend are visualized with purple lines
hiatuses, while the alternative would require a sudden and                   along the Vlasca and BAK curves in Figure 6. Based on this
extreme increase of sediment deposition rates.                               observation, the tie points F, G (9.36 m) and H (9.75 m) are
    The second magnetic dating approach is based on correlation              defined. F and G are located within an increase of magnetic
of the magnetic susceptibility. This technique was first proven to            susceptibility, H is positioned in a small minimum above a
be useful by Heller and Liu (1986) and is widely applied since               stronger decrease of magnetic susceptibility, which is
then. We correlate eight tie points of the magnetic susceptibility           interpreted to reflect the beginning of GI 14. It should be
curve of the BAK pmag composite profile (labeled A to H from                  noted from the tie lines that the age model resulting from the
top to bottom) to selected loess records of the region (Figure 6),           correlation of the site Rasova with NGRIP (Zeeden et al., 2016;
as well as to the NGRIP δ18O isotope record. The ages obtained               Zeeden et al., 2018c; Zeeden et al., 2019) is different to the
using this method depend either on the age models of the                     correlation we suggest in this study. Accordingly, the positions
reference records or the relationship of the fluctuations of the              of the tie point within the Rasova record provide minimum age
magnetic susceptibility to the interplay of interstadial-stadial             estimates for the magnetic susceptibility age model of BAK. In
events expressed in the NGRIP record. In both cases, the                     contrast, the polymineral pIRIR225 ages of Batajnica in this part of
results should only be used with caution. On the one hand,                   the section appear slightly too old (shown in Figure 6) and will
the age models of the selected loess records are partly compiled             not be further discussed in this study.
from multiple dating approaches, including radiocarbon and                      The BAK age models derived from correlation of RPI and
luminescence dating (Supplementary Table 3). Given that we                   magnetic susceptibility include all tie points (Figure 7) that are
also aim at testing the feasibility of different dating methods, the         not denoted with a question mark in Figure 6. All used tie points
use of these data may result in a vicious circle. On the other hand,         are equally weighted and considered in the integrating age model
the magnetic susceptibility is biased by non-climatic factors such           (Integrating Age Models). According to the age models based on
as grain-size distribution and local dust influx. The characteristic          magnetic susceptibility and RPI correlation, the sediment at the
features of the magnetic susceptibility curve of a section may               depth of the CI/Y-5 tephra was deposited 39.3 and 40.6 kyr ago,
therefore not coincide with those of the NGRIP record, although              respectively. Due to the good agreement with the known age of
they may look similar. Furthermore, a delayed response of the                39.85 ± 0.14 ka (Giaccio et al., 2017), the models appear robust.
loess properties to climate change may have occurred (Újvári                 Overall the models resulting from magnetic dating agree well. In
et al., 2014a). Nevertheless, we apply the correlation of the                the upper part, the age models diverge slightly, because tie points
magnetic susceptibility in order to provide a comparison to                  C, D and E do not correspond to tie points 2 and 3. As a
the RPI derived age model.                                                   consequence, the age models shift between 5.8 and 8.2 m
    Tie point A (5.83 m) is a characteristic peak that is recognized         depth with a maximum age offset of 2.3 ka. In general, ages
in all reference records (Figure 6). At the BAK site, it is a horizon        that are younger than expected might be explained (to a certain
rich in organic matter, which could be a small pedogenic horizon.            degree) by a lock-in effect, which causes the sediment to carry the
Because of its thinness, it might be a short-term regional signal;           magnetic signal of a younger time interval than that of sediment
thus, we did not correlate the peak to the NGRIP record. The                 deposition. The lock-in depths of paleomagnetic signals in LPSs
small peaks defined as tie points B (6.17 m) and C (6.39 m)                   strongly depend on the syn-depositional water availability as well
correspond to Greenland interstadials (GI) 3 and 4 in the NGRIP              as at the degree of diagenesis and pedogenesis (e.g., Liu et al.,
curve. They are also easily identified in the magnetic susceptibility         2015) and are therefore difficult to estimate. However, the BAK
curve of Vlasca, but not unequivocally recognizable at Batajnica             profile is characterized by good preservation of subtle
and Rasova. In contrast, tie points D (7.11 m) and E (7.61 m) are            sedimentological structures such as the CI/Y-5 tephra layer
based on a striking resemblance of the shape of the BAK curve                and macroscopically visible layers of fine sands within
with Batajnica. The further correlation of D is based on the                 unaltered loess as well as in interstadial soils. Thus, an
correlation of Batajnica with Rasova, which show clear                       overprinting of the primary depositional signal by post-
similarities in the range between C and D. By comparison, the                depositional processes (bioturbation, pedogenesis) seems
Vlasca record shows higher similarity to the NGRIP curve than to             minimal. A conservative estimate of the potential temporal
the BAK curve. However, the position of E in Batajnica can be                offset can be calculated assuming a lock-in depth of
correlated very well with Vlasca. The identification of tie point E           0.1–0.15 m in unaltered loess and a slightly higher lock-in
in the Rasova profile is more complicated since characteristic                depth in interstadial soils. This leads to a potential temporal
features are missing.                                                        offset of ∼1 kyr for the average accumulation rate of the BAK
    The CI/Y-5 tephra is found between tie points E and F                    pmag composite profile. However, the ages resulting from RPI
(8.55 m) in the BAK, Vlasca and Rasova profiles. The                          correlation, which are also based on the magnetic properties,
correlation of the curves in the profile section below this                   exclude a significant bias from a lock-in effect. Thus, the age
marker horizon is less obvious than above, which might be                    discrepancies may rather arise from a mismatch during
due to regional differences in the intensity of pedogenetic                  correlation. In the lower part of the BAK profile, tie point G
overprinting. A general trend consisting of multiple changes                 causes a different shape of the age-depth plot of the susceptibility/
between moderate decreases and fast increases of the magnetic                NGRIP based model (Figure 7). This difference can be explained

Frontiers in Earth Science | www.frontiersin.org                        14                                    January 2021 | Volume 8 | Article 598448
You can also read