Oil palm modelling in the global land surface model - ORCHIDEE-MICT - GMD
←
→
Page content transcription
If your browser does not render page correctly, please read the page content below
Geosci. Model Dev., 14, 4573–4592, 2021
https://doi.org/10.5194/gmd-14-4573-2021
© Author(s) 2021. This work is distributed under
the Creative Commons Attribution 4.0 License.

Oil palm modelling in the global land surface model
ORCHIDEE-MICT
Yidi Xu1 , Philippe Ciais2 , Le Yu1,3 , Wei Li1 , Xiuzhi Chen4 , Haicheng Zhang5 , Chao Yue6 , Kasturi Kanniah7 ,
Arthur P. Cracknell8 , and Peng Gong1,3
1 Ministry of Education Key Laboratory for Earth System Modeling, Department of Earth System Science,
Tsinghua University, Beijing 100084, China
2 Laboratoire des Sciences du Climat et de l’Environnement, LSCE/IPSL, CEA-CNRS-UVSQ,

Universite Paris-Saclay, Gif-sur-Yvette 91191, France
3 Joint Center for Global Change Studies, Beijing 100875, China
4 Guangdong Province Key Laboratory for Climate Change and Natural Disaster Studies,

School of Atmospheric Sciences, Sun Yat-sen University, Guangzhou 510275, China
5 Department Geoscience, Environment and Society, Université Libre de Bruxelles, 1050 Bruxelles, Belgium
6 State Key Laboratory of Soil Erosion and Dryland Farming on the Loess Plateau,

Northwest A & F University, Yangling, Shaanxi 712100, China
7 Centre for Environmental Sustainability and Water Security (IPASA), Research Institute for Sustainable Environment

(RISE) and Tropical Map Research Group, Faculty of Built Environment and Surveying,
Universiti Teknologi Malaysia, Johor Bahru, Johor, 81310, Malaysia
8 School of Science and Engineering, University of Dundee, Dundee, DD1 4HN, UK

Correspondence: Le Yu (leyu@tsinghua.edu.cn) and Wei Li (wli2019@tsinghua.edu.cn)

Received: 29 July 2020 – Discussion started: 22 October 2020
Revised: 5 June 2021 – Accepted: 15 June 2021 – Published: 23 July 2021

Abstract. Oil palm is the most productive oil crop that pro-     phology, phenology and harvest process of oil palm were
vides ∼ 40 % of the global vegetable oil supply, with 7 %        implemented, and the plant carbon allocation scheme was
of the cultivated land devoted to oil plants. The rapid ex-      modified to support the growth of the branch and fruit com-
pansion of oil palm cultivation is seen as one of the major      ponent of each phytomer. A new age-specific parameteriza-
causes for deforestation emissions and threatens the conser-     tion scheme for photosynthesis, autotrophic respiration and
vation of rain forest and swamp areas and their associated       carbon allocation was also developed for the oil palm PFT,
ecosystem services in tropical areas. Given the importance       based on observed physiology, and was calibrated by obser-
of oil palm in oil production and its adverse environmental      vations. The improved model generally reproduces the leaf
consequences, it is important to understand the physiological    area index, biomass density and fruit yield during the life
and phenological processes of oil palm and its impacts on the    cycle at 14 observation sites. Photosynthesis, carbon alloca-
carbon, water and energy cycles. In most global vegetation       tion and biomass components for oil palm also agree well
models, oil palm is represented by generic plant functional      with observations. This explicit representation of oil palm
types (PFTs) without specific representation of its morpho-      in a global land surface model offers a useful tool for un-
logical, physical and physiological traits. This would cause     derstanding the ecological processes of oil palm growth and
biases in the subsequent simulations. In this study, we intro-   assessing the environmental impacts of oil palm plantations.
duced a new specific PFT for oil palm in the global land sur-
face model ORCHIDEE-MICT (v8.4.2, Organising Carbon
and Hydrology in Dynamic Ecosystems–aMeliorated Inter-
actions between Carbon and Temperature). The specific mor-

Published by Copernicus Publications on behalf of the European Geosciences Union.
4574                                Y. Xu et al.: Oil palm modelling in the global land surface model ORCHIDEE-MICT

1   Introduction                                                  is lower than TBE (8 m2 m−2 ) in Indonesia and other plan-
                                                                  tations such as rubber (9 m2 m−2 ) (Vernimmen et al., 2007;
Oil palm is one of the most important vegetative oil crops in     Propastin, 2009; Rusli and Majid, 2014). The maximum rate
the world. It provides 39 % of the global supply of vegetable     of carboxylation, Vcmax25 , of mature oil palm, by contrast, is
oil and occupies 7 % of the agricultural land devoted to oil-     higher than in natural tropical forests (Carswell et al., 2000;
producing plants (Caliman, 2011; Rival and Levang, 2014).         Kattge et al., 2009; Teh Boon Sung and See Siang, 2018). Oil
With the increasing demand for palm oil as a biofuel and a        palm has a shallower rooting system and lower aboveground
feedstock for industrial products, oil palm plantation contin-    biomass compared to forests (Carr, 2011), and its above- and
uously expanded from 5.59 to 19.50 × 10⁶ ha during 2001–          belowground biomass ratio is lower than in the natural forests
2016 in the world’s top two palm oil producers, Malaysia          (Kotowska et al., 2015). To maintain a huge fruit productivity
and Indonesia (Xu et al., 2020). This rapid expansion brought     with shallow roots, a large amount of water is required by oil
about high ecological and social costs. About half of the oil     palm for evapotranspiration (∼ 4–6 mm d−1 ), typically 25 %
palm cultivation lands were converted from biodiverse tropi-      higher than in tropical forests in the same region (Meijide
cal forests during 1990–2005 (Koh and Wilcove, 2008), lead-       et al., 2017; Manoli et al., 2018). Ignoring those differences
ing to losses of habitats (Fitzherbert et al., 2008), peatlands   in the parameterizations of LSMs would cause biases when
(Koh et al., 2011; Miettinen et al., 2016) and carbon emis-       simulating oil palm growth, yields and the biophysical pro-
sions from land use change (Guillaume et al., 2018). Land         cesses in a large-scale model application, which calls for new
use change (LUC) from peat swamp forest to oil palm planta-       parameterizations dedicated to oil palm as a specific PFT in
tion contributed about 16 %–28 % of the total national green-     those models.
house gas (GHG) emissions in Southeastern Asia (Cooper               Oil palm has a specific morphology, phenology and man-
et al., 2020). A comprehensive understanding of fruit pro-        agement practice compared to other perennial crops and trop-
duction, land use change, carbon emissions and other envi-        ical evergreen forests. Oil palm has a solitary columnar stem
ronmental consequences of oil palm is urgently needed for         with phytomers (palm branches supporting leaves and fruit
guiding more sustainable management practices.                    bunches) produced in succession at the top of stem. Fruit
   Many field-based studies underpinned the specific phenol-      bunches are developed in the axil of each phytomer and each
ogy and growth of oil palm and its key physiological pro-         phytomer experiences a life cycle from leaf initiation, inflo-
cesses (Noor and Harun, 2004; Lamade and Bouillet, 2005;          rescences and fruit development to harvest and pruning (Cor-
Sunaryathy et al., 2015; Ahongshangbam et al., 2019). Mod-        ley and Tinker, 2015; Lewis et al., 2020). At the maturity
els developed based on these field observations provide a         stage, one oil palm tree holds ∼ 40 visible expanded phy-
useful tool for large-scale simulation of oil palm growth and     tomers from the youngest to the oldest, and 40–60 initiating
yields and their impacts on the regional carbon, water and        phytomers within the apical buds (Combres et al., 2013). It
energy budgets. Oil palm growth models have been devel-           takes about 2–3 years for the reproductive organ to develop
oped to simulate the biomass yields of oil palm based on          before flower initiation and fruit harvest (Corley and Tinker,
the physiological processes and phenological characteristics      2015). Currently, the biomass pool of phytomers is not in-
such as flowering and rotation dynamics (Van Kraalingen et        cluded in the generic tree PFTs of most land surface mod-
al., 1989; Henson, 2009; Combres et al., 2013; Hoffmann et        els (except CLM-Palm), which prevents us from modelling
al., 2014; Huth et al., 2014; Paterson et al., 2015; Teh and      phytomer-specific development, monthly harvest and prun-
Cheah, 2018). Although these models can generally repro-          ing. In addition, the closest PFT of oil palm in the model,
duce the observed yields, they are usually applied for fruit      known as TBE, has a different leaf phenology – with a higher
production simulation without the whole carbon, water and         old leaf turnover and increased new leaf production in the
energy cycle; do not allow the representation of land-use         dry season, based on the satellite and ground-based obser-
changes; and thus usually cannot be integrated for regional       vations (Wu et al., 2016). This leaf phenology scheme was
and global gridded simulations like land surface models.          parameterized for leaf age cohorts in ORCHIDEE (Organis-
   Alternatively, process-based land surface models (LSMs)        ing Carbon and Hydrology in Dynamic Ecosystems, one of
can simulate spatially explicit plant growth, biomass density     the commonly used LSMs) for Amazonian evergreen forest
and yield, and a full set of carbon, nutrient, water and energy   (Chen et al., 2020), but whether it can be adapted to the oil
fluxes and storage pools (Fisher et al., 2014). Vegetation in     palm or not needs further investigations. At the productive
most LSMs is represented by a discrete number of plant func-      stage, regular harvest and pruning are applied to maintain
tional types (PFTs) and oil palm is approximated by tropical      the optimal number of phytomers and maximize harvested
broadleaved evergreen (TBE) trees without a specific rep-         yields. Also, oil palm planted in mineral soil is managed in a
resentation in LSMs (except the Community Land Model-             rotation cycle of 25–30 years (manually cut) due to the diffi-
Palm, CLM-Palm), although the physiological characteris-          culties in harvesting and the potential decline of fruit produc-
tics of oil palm differ from generic TBE trees. For exam-         tion (Hoffmann et al., 2014; Röll et al., 2015). Thus, oil palm
ple, the maximum leaf area index (LAI) of oil palm is up to       cannot be described neither as an annual crop nor as a natural
6 m2 m−2 depending on the genotypes and locations, which          tree PFT with a longevity of decades to centuries. Therefore,

Geosci. Model Dev., 14, 4573–4592, 2021                                           https://doi.org/10.5194/gmd-14-4573-2021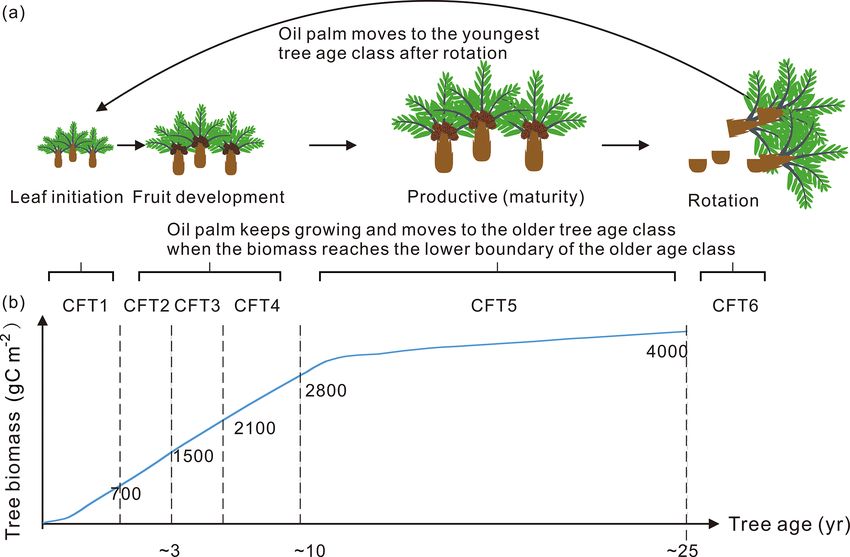
Y. Xu et al.: Oil palm modelling in the global land surface model ORCHIDEE-MICT 4575
including forest age dynamics (Yue et al., 2018) is needed in 2010 (Cheng et al., 2018) (Fig. S1 in the Supplement).
in an LSM to represent the management practice and cycle The MAT, MAP and clay fraction (CF) for the global oil
of growth, fruit harvest and rotation of oil palm at different palm plantation area were based on the climate data from the
age stages. CLM-Palm was the first LSM that introduced oil- Climatic Research Unit National Centers for Environmental
palm-specific PFT with a sub-canopy and sub-PFT frame- Prediction (CRUNCEP) gridded dataset (Viovy, 2011) and
work for modelling oil palm’s phytomer-based structure and the Harmonized World Soil Database (HWSD v1.2, Nachter-
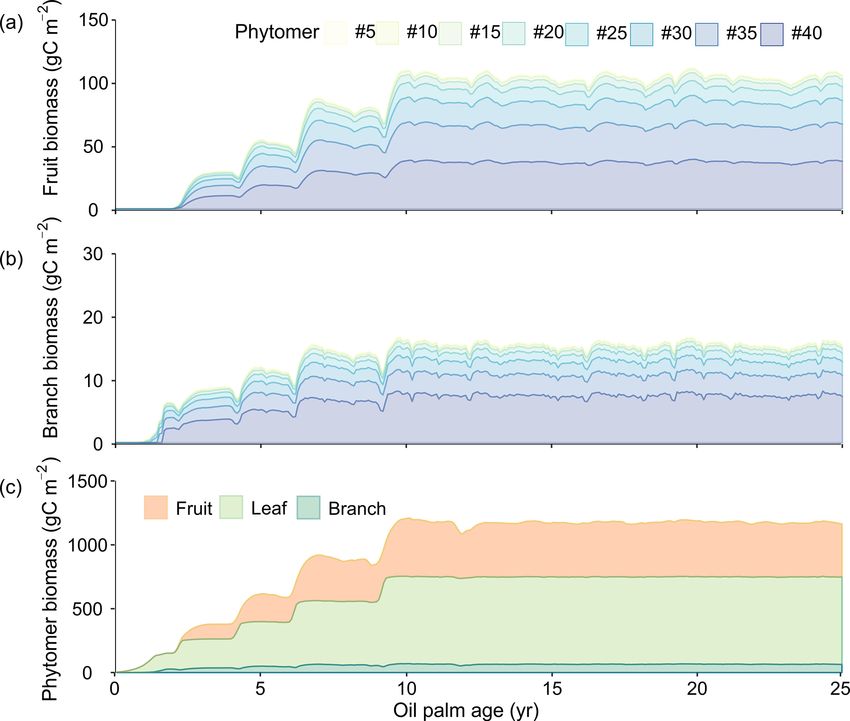
phenological and physiological traits in CLM4.5 (Fan et al., gaele et al., 2010). The observation sites include six smaller
2015). This work provides an important conceptual frame- plantations (< 50 ha, Sites 1 and 2 for smallholders and Sites
work for implementing oil palm modelling in other LSMs. 4, 5, 7 and 12 as research sites; Fig. 1) and seven indus-
In this study, we aimed to model oil palm growth from trial plantations of up to 23 625 ha. Site 12 and Site 14 were
young to mature plants and the specific morphology, phe- covered by very deep peat soil before oil palm cultivation,
nology and management characteristics in the ORCHIDEE where the former natural vegetation was peat swamp forest.
LSM. Incorporating an oil palm PFT into ORCHIDEE would The natural vegetation at other sites was dominated by trop-
contribute to modelling the carbon, water and energy cycle ical rainforest and the clay fraction varied from 0 %–11 %
of this perennial crop in a variety of LSMs except for CLM, (Fig. S1). LAI, gross primary productivity (GPP), net pri-
which already implements oil palm modelling. The oil palm mary productivity (NPP), fruit bunches (yield) and biomass
integration was based on an existing leaf-age-cohort-based at different ages including young and mature oil palms were
phenology of TBE and distinct age classes of the model, collected from these sites for model validation. Annual data
but significant modifications have been made to accommo- of total biomass and yields were available for Site 3 and Site
date the phenology, physiological and management charac- 12. The biomass data at Site 3 were calculated by an allo-
teristics of oil palm. The oil palm growth from leaf initia- metric equation using the measured diameter at breast height
tion, fruit development and maturity to the clear-cutting of (DBH) and height of the stem (Corley and Tinker, 2015),
oil palm PFT at rotation was represented in the ORCHIDEE while yield data at Site 12 were obtained from measurements
LSM. A sub-PFT structure – phytomer with branch and fruit of the harvested fruit bunch every time. Sites 1, 2, 12 and 13
(a leaf component was implemented at the PFT level with provide observations of different NPP components by quan-
four leaf age cohorts) – for oil palm was implemented in tifying all the plant pool change for a specified time interval.
ORCHIDEE based on the sub-PFT structure incorporated in Fractions of different biomass parts were collected by com-
CLM-Palm (Fan et al., 2015). The plant carbon allocation bining measurements of biomass partition and calculations
scheme was modified to support the growth of the branch and using empirical equations at Site 12 and Site 3 (see details
fruit component of each phytomer. Management practices of in Table S1). Due to the lack of accessible continuous ob-
pruning, fruit harvest and rotation were also implemented. servations at one or two sites, we have to utilize the existing
The objectives of this study are to (1) implement growth (es- knowledge regarding oil palm growth phenology and planta-
pecially phytomer development), phenology and harvest pro- tion management, together with the range of field observa-
cesses for oil palm as a new PFT of the ORCHIDEE LSM, tions from all the sites to constrain the model. We also added
(2) adjust physiological and phenological parameters using a test by recalibrating the model using data from Site 12 with
field measurements, and (3) evaluate simulated biomass and more observations compared to other sites, and we then val-
oil palm yields at a range of sites across Indonesia, Malaysia idated the model using data at the remaining sites (Figs. S4
and Benin. and S5). Facing the difficulty in acquiring the original har-
vest records for independent sites, we also ran simulations at
the same site as previous studies (Fig. 11 in Teh and Cheah,
2 Model development and parameterization 2018, and Fig. 6 in Fan et al., 2015) and visually compared
the temporal dynamics of simulated yields.
2.1 Observation data
2.2 Model description
Data from 14 sites with reported coordinates were col-
lected from published literatures for model validation (Ta- Organising Carbon and Hydrology in Dynamic Ecosystems
ble S1 in the Supplement). Since a tropical humid climate (ORCHIDEE) is the land surface component of the French
is favourable for oil palm growth, most of the in situ mea- Institut Pierre Simon Laplace (IPSL) Earth system model
surements are located in Indonesia (six sites) and Malaysia (ESM) and capable of simulating water, energy and carbon
(seven sites) except for one site in Benin (Fig. 1). The ob- processes (Krinner et al., 2005). ORCHIDEE-MICT (aMe-
servation sites have high mean annual precipitation (MAP, liorated Interactions between Carbon and Temperature) is a
574.2–3598.8 mm yr−1 ) and high mean annual temperatures branch of ORCHIDEE with a better representation of high-
(MATs) between 24.3 and 28.8 ◦ C throughout the year, latitude processes with new vertical soil parameterization,
which covers 97.27 % and 85.14 % of the range of MAP snow processes and fires (Guimberteau et al., 2018). The re-
and MAT, respectively, in the global oil palm plantation area cent ORCHIDEE-MICT v8.4.2 also includes modifications
https://doi.org/10.5194/gmd-14-4573-2021 Geosci. Model Dev., 14, 4573–4592, 2021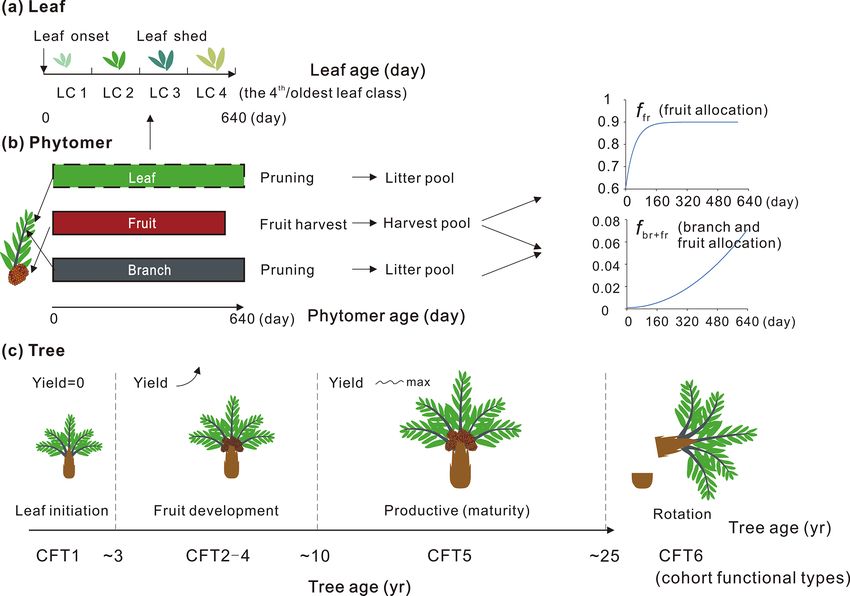
4576                                   Y. Xu et al.: Oil palm modelling in the global land surface model ORCHIDEE-MICT

                                                                      stem and root biomass and the same carbon assimilation pro-
                                                                      cess. In the default version of ORCHIDEE-MICT, there were
                                                                      eight biomass pools namely leaves, sapwood above and be-
                                                                      low ground, heartwood above and below ground, roots, seed
                                                                      and carbon reserve pools. To simplify the modification and
                                                                      parameterization of phytomers and stay consistent with the
                                                                      model structure, the branch and fruit bunch belonging to each
                                                                      phytomer were linked with the original sapwood and fruit
                                                                      biomass pools, although the fruit bunch biomass pool was
                                                                      modified from the original model (Fig. 2). The the number of
                                                                      fruit and branch components was set corresponding to phy-
                                                                      tomer number but the leaf linked with the leaf biomass pool
                                                                      was divided into four age classes without duplication in each
                                                                      phytomers (Fig. 2).

Figure 1. Spatial distribution of the 14 observation sites used for   2.3.2   Phytomer phenology
model calibration and evaluation. The red rectangle in the inserted
map shows the location of the main map (Malaysia and Indonesia).      Here we describe the phytomer dynamics related to planting,
                                                                      vegetative maturity and rotation at plant level and the sequen-
                                                                      tial initiation and pruning at phytomer level. The modifica-
in wood harvest, forest age class and gross land use changes          tion of leaf seasonality is also presented. A schematic dia-
(Yue et al., 2018). The need to represent age-specific physi-         gram of oil palm tree, phytomer and leaf phenology is shown
ological and phenological characteristics for young and ma-           in Fig. 3. Since the phytomer phenology is closely related to
ture oil palm can thus benefit from this pre-existing forest          the age of the tree, the age of the phytomer and the age of
age dynamics representation. Therefore, our development of            the leaf, three temporal variables of tree age (the age of the
oil palm modelling started from ORCHIDEE-MICT v8.4.2.                 oil palm tree in years), the phytomer age (the age for each
   Processes related to the carbon cycle in ORCHIDEE in-              phytomer counted from its initiation, in days) and the leaf
clude photosynthesis, respiration, carbon allocation, litter-         ages (the age of leaves in days) were used to compute tree,
fall, plant phenology and decomposition (Krinner et al.,              phytomer and leaf dynamics (Fig. 3).
2005). We added a new PFT for oil palm starting from the                 Based on the field evidence, there are three major pheno-
default setting of the closest PFT: TBE trees. The major mod-         logical phases for phytomers during a tree life cycle. The first
ification brought was for the carbon allocation, by including         phase is the first 2 years between oil palm planting and the
a new phytomer organ for oil palm, and a new fruit harvest            beginning of fruit fill. In this period, the leaf and branch be-
module for fresh fruit bunch harvesting (Fig. 2). The new             gin to flourish and expand without fruit production. The sec-
model called ORCHIDEE-MICT-OP (oil palm) is schema-                   ond phase is the fruit development phase when fruit begins
tized in Fig. S2.                                                     to grow and harvest begins, while fruit and branch biomass
                                                                      continue to increase. The third phase is the productive phase
2.3     Introduction of the phytomer structure                        with high and stable yields that will last until the age of 25–
                                                                      30 years old. This phase ends when the tree grows very tall
2.3.1    New phytomer structure                                       (harvesting of fruit bunches becomes difficult) and the fruit
                                                                      yield starts to decrease. The modified subroutines of phy-
Oil palm has a monopodial architecture and sequential phe-            tomer dynamics are adopted from the forest age cohorts sim-
nology. The phytomers are produced in succession, each                ulated in ORCHIDEE-MICT v8.4.2. The forest age cohort
bearing a big leaf with a number of leaflets, rachis and a            module was originally designed for modelling forest man-
bunch of fruits (Corley and Tinker, 2015; Fan et al., 2015).          agement such as wood harvest and gross land use changes
To represent the major morphology and phenological pro-               (Yue et al., 2018). This module allows us to represent photo-
cess, we introduce a new phytomer structure in the model              synthesis, allocation and harvest practice for different forest
frame. In the model, only branches and fruit bunches were             age classes (each tree PFT is divided into six age “cohort
specifically simulated at each phytomer while leaf was sim-           functional types” called CFTs) by setting CFT-specific pa-
ulated as the entirety of all phytomers at the PFT level to           rameters. This module is adopted to represent the rotation
remain consistent with the four leaf age cohorts of the mod-          cycle of oil palm and the land conversion to or from oil
elled phenological equations. Phytomers are initiated suc-            palm. Here, the first phase of oil palm growth from age 0–
cessively and developed in parallel on the same tree. Al-             2 corresponds to CFT1, and the second phase corresponding
though each phytomer has its own sequence of initiation, al-          to CFT2-4 starts from the end of age 2. The most produc-
location, fruit production and pruning, they share the same           tive phase corresponds to CFT5 from age ∼ 10–25 (Fig. 3).

Geosci. Model Dev., 14, 4573–4592, 2021                                               https://doi.org/10.5194/gmd-14-4573-2021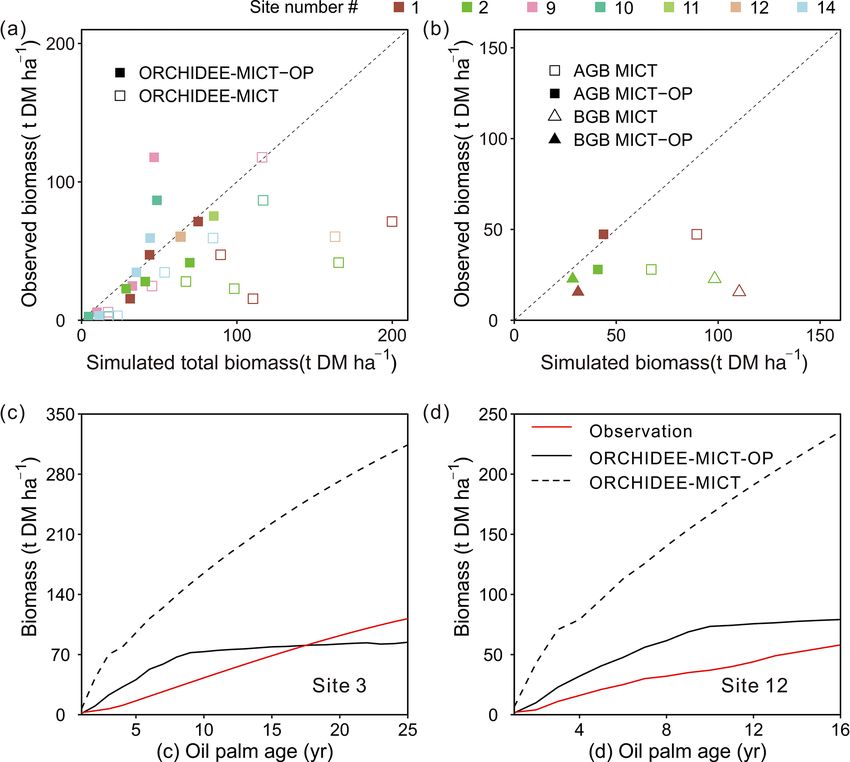
Y. Xu et al.: Oil palm modelling in the global land surface model ORCHIDEE-MICT                                                       4577

Figure 2. Schematic diagram showing the implementation of oil palm in ORCHIDEE-MICT-OP. The major modifications, new plant organs
and harvest module are highlighted using the red blocks. The branch and fruit components (solid lines) were implemented at the phytomer
level, while the leaf component (dashed lines) was simulated as the entirety of all phytomers at the PFT level to remain consistent with the
four leaf age cohorts of the modelled phenological equations. RA refers to autotrophic respiration. FFB harvest refers to fresh fruit bunch
harvest.

Figure 3. Schematic of (a) leaf, (b) phytomer and (c) plant dynamics with leaf, phytomer and tree ages. The branch and fruit allocation
is a function of phytomer age. The oil palm PFT experiences an increase in fruit yield during CFT 2–4 and reaches the maximum and
steady yield at the most productive period (CFT5). The leaf component is not specifically simulated for each phytomer (dashed rectangle)
but implemented at the PFT level with four leaf age cohorts. The major phenological phases for phytomer during the oil palm life cycle are
presented with tree ages. LC and CFT refer to leaf cohort and cohort functional type, respectively.

Detailed parameterization for the new oil palm CFTs is pre-             fruit bunches are harvested every 15–20 d (Combres et al.,
sented in Sect. 2.4.                                                    2013; Corley and Tinker, 2015). Considering the regular de-
   For an adult oil palm tree, the number of newly produced             velopment of phytomers and the periodic harvest and pruning
phytomers is stable at around 20–24 per year (Corley and                practices, the initiation of new phytomers occurs every 16 d,
Tinker, 2015). Phytomers are manually pruned twice a month              and the phytomer longevity (640 = 16 × 40, Fig. 3) is set by
to keep a maximum number of 40 phytomers, while fresh                   this fixed initiation interval and by the maximum number of

https://doi.org/10.5194/gmd-14-4573-2021                                                    Geosci. Model Dev., 14, 4573–4592, 2021
4578 Y. Xu et al.: Oil palm modelling in the global land surface model ORCHIDEE-MICT
expanded phytomers of 40 in the model. Thereafter, we in-
troduce two temporal variables in unit of days, i.e. the critical
i,nphs
phytomer age or phytomer longevity (Agephycrit ) and the age fbr+fr = fbr+fr,min + (fbr+fr,max − fbr+fr,min )
i,nphs P2
of each phytomer (Agephy ). The former defines the time
i,nphs
Agephy
length between phytomer initiation and pruning, while the × × P1 , (1)
latter records the age of each phytomer. When the phytomer Agephycrit
age reaches the critical value, the pruning practice is trig-
i,nphs i,nphs Agetree
gered and the pruned branch from the phytomer and a group Fbr+fr = fbr+fr × 1 − exp − , (2)
of old leaves from total leaf biomass go into the litter pool of P3
the model. Subsequently, another new phytomer is initiated where fbr+fr,min and fbr+fr,max are prescribed values of min-
to maintain the total number of phytomers. The carbon allo- imum and maximum aboveground sapwood and reproduc-
cation and harvest related to phytomer dynamics is discussed tive organ allocation fractions to branch and fruit, which is
in Sect. 2.3.3 and 2.3.4. increased with tree age. Agephy (day) is the age of the phy-
The leaf phenology of a TBE forest is important for tomer, and Agetree (yr) is the age of the oil palm tree. P1 ,
seasonal carbon and water fluxes. In another version of P2 and P3 are empirical coefficients (set at 0.265, 2 and 0.8;
ORCHIDEE-MICT, the leaf phenology of TBE forests was unitless), respectively, based on yield calibration against ob-
implemented using four leaf age cohorts (See Fig. 3) by servations. All abbreviations and parameter values are shown
Chen et al. (2020). Different photosynthetic efficiencies were i,nphs
in Table S2. Note that the modifier (fbr+fr ) range (0–0.07)
used for leaf age cohorts to represent the leaf ageing pro-
is for one phytomer, and the total allocation fraction (a range
cess. In this new canopy phenology scheme, NPP allocation
of 0–1) should be the sum of modifiers in all phytomers.
to new leaves is driven by short-wave downwelling radia-
After fruit initiation started (second phase, corresponding
tion (SWdown ) and the vegetation optical depth of old leaves
to CFT2-4), the allocation strategy changes with more re-
(Eq. 1 in Chen et al., 2020), and weekly vapour pressure
sources shifted to the fruit than the leaf, and the rate of fruit
deficit (VPD) is used to trigger the shedding of old leaves
assimilation is accelerated (Corley and Tinker, 2015). This is
(Eq. 3 in Chen et al., 2020). In the leaf shedding, the leaf
represented by Eq. (1) with more carbon allocated to old and
longevity used in the VPD-triggered leaf shedding scheme
ripening phytomers to achieve the largest amount of yield.
(Eqs. 2 and 3 in Chen et al., 2020) is modified to be the i,nphs
same as phytomer longevity (640 d) to approximate the old The further separation of branch and fruit (Fbr+fr ) and fruit
i,nphs
leaves’ removal in phytomers (it means than when all the fractions (ffruit ) follows a similar scheme, i.e. an increase
“leaves” dies, the phytomer dies). Here, we simplified the with phytomer age to accelerate fruit accumulation (Eq. 3).
leaf growth without considering the “spear leaf” stage. We
i,nphs
also ran a test simulation using a shorter Ageleafcrit (620 d, ffr = ffr,min + (ffr,max − ffr,min )
Test1) in the Supplement (Fig. S8). The shedding leaf then
i,nphs
enters the litter pool. Here, we adopted this leaf phenology × 1 − exp −Agephy × F1
scheme for oil palm modelling.
i,nphs
IF Agephy ≥ ffblagday , (3)
2.3.3 Phytomer allocation i,nphs i,nphs i,nphs
fbr = Fbr+fr − ffr , (4)
In ORCHIDEE-MICT, carbon is allocated to leaf, sapwood
where ffr,min and ffr,max are the tree-age-specific value of
and root in response to water, light and nitrogen limitation i,nphs
(Krinner et al., 2005). The allocation of carbon to phytomers minimum and maximum fruit allocation. fbr stands for
was simulated following this framework. The allocation to the branch fraction in the total branch and fruit fraction
i,nphs
the fruit and branch component for each phytomer was cal- (Fbr+fr ), and F1 is an empirical coefficient, set at 0.02 (unit-
i,nphs i,nphs
culated as a fraction of the aboveground sapwood and the less). The change in fbr+fr and ffr with phytomer age is
reproductive organ, whereas the allocation to leaves was un- shown in Fig. 3. The initiation of fruit begins when the phy-
changed. For each phytomer, the fraction of aboveground tomer age exceeds the pre-defined ffblagday (16 d). Also no-
sapwood and reproductive organ allocated to branch and fruit tice there is no fruit allocation during the first phase (CFT1).
i,nphs
components (fbr+fr , where nphs is the total number of phy- The total phytomer allocation fraction is a sum of leaf,
tomers and i is the index of the phytomer) is a function of branch and fruit allocation:
phytomer age as follows (Eq. 1). This fraction is further ad- Xi i,nphs
justed by the oil palm tree age to account for yield increase fphy = fleaf + fsab+rep × F
nphs br+fr
, (5)
i,nphs
with tree growth (Fbr+fr Eq. 2).
where fleaf is the leaf fraction and fsab+rep is the above-
ground sapwood and the reproductive organ allocation frac-
tion.
Geosci. Model Dev., 14, 4573–4592, 2021 https://doi.org/10.5194/gmd-14-4573-2021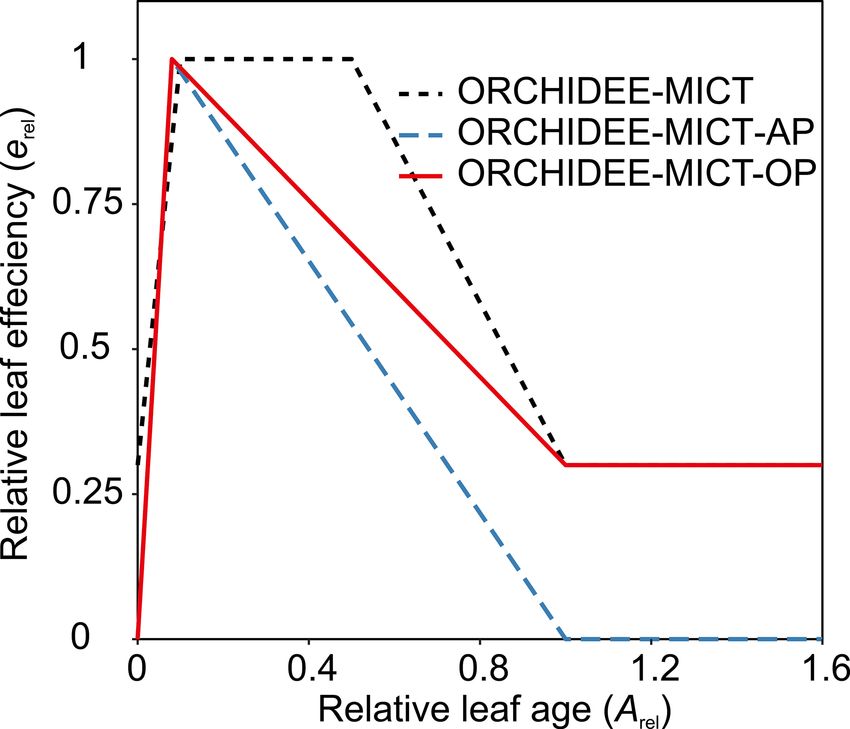
Y. Xu et al.: Oil palm modelling in the global land surface model ORCHIDEE-MICT                                                      4579

2.3.4    Fruit harvest

The default wood harvest in ORCHIDEE-MICT is based on
the different forest age classes (implemented as CFTs). For
each CFT, when the stem biomass reaches the prescribed
maximum woody biomass of current CFT, it will move to
the next CFT. Wood harvest can start from any CFT by the
user’s choice, and the default wood harvest sequence starts
from the second-youngest CFT to the oldest one and back to
the youngest until reaching the required harvest amount (Yue
et al., 2018). Unlike wood harvest, oil palm fruit is produced
in sequence and harvested regularly. Here we assume the
harvested fruits were taken from the oldest phytomer before
pruning. The duration between fruit initiation and harvest is
prescribed (Ageffbcrit (day), Table S2), and fruits will be har-
vested after the phytomer age in the oldest phytomer reaches
the Ageffbcrit . The harvested fruit biomass is then added to a        Figure 4. Relative leaf efficiency (erel ) as a function of relative
new separate harvest pool.                                             leaf age (Arel ) used in (1) this study, ORCHIDEE-MICT with oil
                                                                       palm (ORCHIDEE-MICT-OP), (2) the default ORCHIDEE-MICT
2.4     Parameter calibrations for oil palm                            version (ORCHIDEE-MICT) and (3) the ORCHIDEE-MICT ver-
                                                                       sion with the new leaf phenology scheme in Chen et al. (2020)
Since most parameters vary across different PFTs, we sys-              (ORCHIDEE-MICT-AP).
tematically adjusted parameters related to photosynthesis,
respiration, carbon allocation and morphology for oil palm
according to the observed values from field measurement lit-           erel for the old leaves of oil palms is maintained the same
erature. Some parameters are CFT-specific values in accor-             as the value in the default ORCHIDEE-MICT version (red
dance with the tree age cohorts in the model. Details of the           line in Fig. 4). We also adjusted Vcmax25 for each tree age
parameters for oil palm are summarized in Table S2.                    class of oil palm according to the experimental evidence (Fan
                                                                       et al., 2015; Meijide et al., 2017; Teh Boon Sung and See
2.4.1    Photosynthesis parameters                                     Siang, 2018) (Table S2). Vcmax25 for oil palm increases with
                                                                       tree age (from 35 to 70 µmol m−2 s−1 ) corresponding to the
The photosynthesis module of ORCHIDEE-MICT is based                    increase in gross assimilation (Breure, 1988). Another two
on an extended version (Yin and Struik, 2009) of the Far-              important parameters for photosynthesis are maximum leaf
quhar, von Caemmerer and Berry model (FvCB model; Far-                 area index (LAImax , controlling the maximum carbon allo-
quhar et al., 1980). Leaf age class is introduced to take into         cation to leaf biomass) and specific leaf area (SLA). The
account the fact that the photosynthetic capacity depends on           observed maximum LAI varies from 4 to 7 m2 m−2 across
leaf age (Ishida et al., 1999). The maximum rate of Rubisco            different genotypes, plant densities and soil types (e.g. peat)
activity (Vcmax ) is defined by the prescribed Vcmax25 and             according to nine observation-based publications listed in Ta-
weighted leaf efficiency (erel ; unitless: 0–1). The relative leaf     ble S2, and LAImax was found to increase with oil palm tree
efficiency (erel ) is a function of relative leaf age (Arel ), where   age (Kallarackal, 1996; Kotowska et al., 2015; Legros et al.,
Arel is the ratio of the leaf age to the critical leaf age (the same   2009). SLA, by contrast, generally decreases with oil palm
as Agephycrit ), also known as leaf longevity (Fig. 4, red line).      tree age from 0.0015 to 0.0008 m2 g−1 C (Van Kraalingen et
The erel change with Arel in the default ORCHIDEE-MICT                 al., 1989; Legros et al., 2009; Kotowska et al., 2015). We thus
version is shown in Fig. 4 (black dashed line), which in-              used a CFT-specific value which is close to the median values
creases from a low initial value to 1 (reaching the prescribed         of LAI and SLA obtained from observational data (Table S2).
optimal Vcmax25 ) for a given period and then decreases to a
low level for the old leaves. This was modified by setting the         2.4.2   Respiration parameters
minimum efficiency to 0 at both leaf flushing and longevity
based on observations of the leaf phenology of Amazonian               Autotrophic respiration (AR, including maintenance and
TBE forest in another ORCHIDEE-MICT version with leaf                  growth respiration, MR and GR) in ORCHIDEE-MICT is
cohorts (ORCHIDEE-MICT-AP; blue dashed line) (Chen et                  based on the work of Ruimy et al. (1996). MR is a function
al., 2020). However, unlike the natural TBE forest, the old            of the temperature and biomass for each plant part (Eqs. 6–7),
leaves in the old phytomers of oil palm are probably more              whereas GR is prescribed as 28 % of the allocable assimilates
productive to sustain the high fruit amount because of the se-         for the TBE tree PFT (Krinner et al., 2005). Field evidence
quential growth, phytomer pruning and fruit harvest. Thus,             shows that MR in gross assimilation of palm increases with

https://doi.org/10.5194/gmd-14-4573-2021                                                  Geosci. Model Dev., 14, 4573–4592, 2021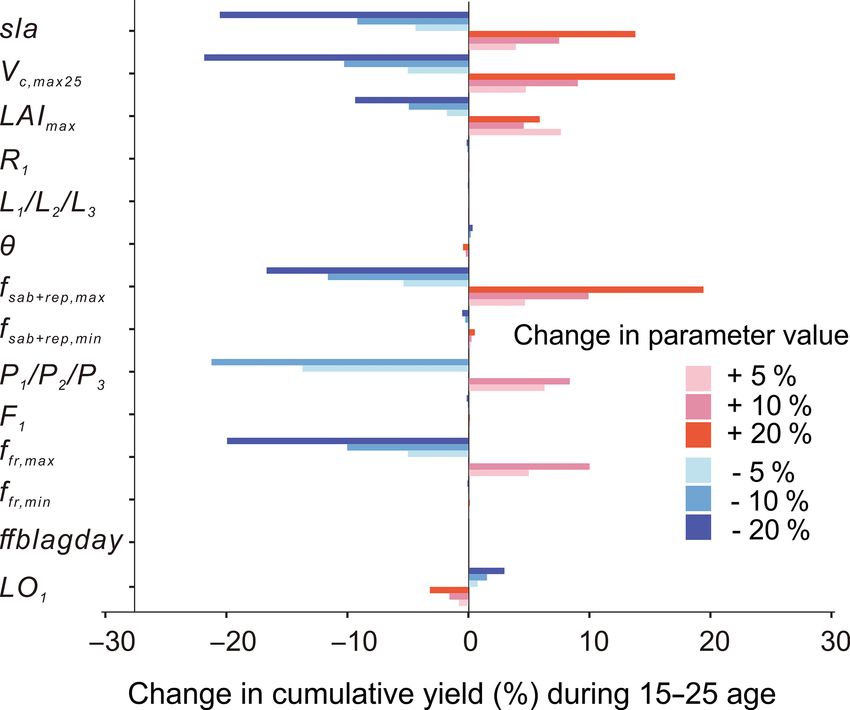
4580                                    Y. Xu et al.: Oil palm modelling in the global land surface model ORCHIDEE-MICT

oil palm tree age but MR per unit of tree biomass decreases             NPP partitioning between the aboveground part of
(Breure, 1988). In total, AR represents 60 %–75 % of GPP             sapwood, reproductive organ and belowground sapwood
for oil palms (Henson and Harun, 2005). Based on this prior          biomass is a function of tree age. Older trees get more al-
knowledge, we adjusted both the constant S1 in Eq. (7) and           location to the aboveground part than younger ones (Krin-
the fraction of GR in GPP (fGR ). The former parameter (S1 )         ner et al., 2005). In the default ORCHIDEE-MICT version,
increases with age and the latter does the opposite (fGR ) (Ta-      the values of minimum and maximum NPP partitioning to
ble S2). The parameter values were calibrated to match the           aboveground biomass are constant. By contrast, observed oil
observation of GR/MR, AR/GPP and GPP.                                palm gross assimilation increases with age (Breure, 1988),
                                                                     and most of the assimilates go into the phytomer to sustain
MRj = Biomassj × C0,j × (1 + slope × T ),                     (6)    fruit production. In ORCHIDEE-MICT-OP, we adopted the
slope = S1 + S2 × Tl + S3 × Tl2 ,                             (7)    original model equation of allocation to aboveground sap-
                                                                     wood and the reproductive organ (fsab+rep ) increasing with
where j is the different plant parts. C0 is prescribed for each      age (Eq. 9) but adjusted parameters to match the observa-
plant part for each PFT. T is the 2 m temperature/root temper-       tions.
ature for above-/belowground compartments. Tl is the long-
                                                                     fsab+rep = fsab+rep,min + (fsab+rep,max − fsab+rep,min )
term (annual) mean temperature. Slope is the second-degree                      −Agetree
polynomial dependency of Tl . S1 , S2 and S3 are empirical              × 1−e θ             ,                                       (11)
coefficients.
                                                                     where fsab+rep,min and fsab+rep,max are prescribed tree-age-
2.4.3   Carbon allocation parameters
                                                                     specific values of minimum and maximum allocation to the
Carbon allocation to new leaves in the ORCHIDEE-MICT-                aboveground sapwood and the reproductive organ, which in-
OP was modified following the ORCHIDEE-MICT-AP by                    creases with tree age. Agetree is the oil palm tree age, and θ
Chen et al. (2020) as described in Sect. 2.3.2. The leaf allo-       is the empirical CFT-dependent coefficients (Table S2).
cation (fleaf ) is both related to the amount of sunlight avail-
                                                                     2.4.4   Other parameters
able at the top of canopy and the light transmission of old
leaves so that the fleaf is expressed as a function of higher        Other adjustments of parameter values include morpholog-
short-wave downwelling radiation (SWdown ) and LAI of the            ical, phenological and turnover parameters. The maximum
old leaves as follows:                                               number of phytomers (nphs) is set as 40 according to ob-
fleaf = fleaf,min + (fleaf,max − fleaf,min )                         servations (Combres et al., 2013; Corley and Tinker, 2015).
                                                                     Given the phytomer initiation rate of 20–24 per year, the
   × (SWdown × e−L1 ×LAI4 /L2 )L3 ,                           (8)    pruning frequency of twice a month and the number of phy-
                                                                     tomers (Combres et al., 2013; Corley and Tinker, 2015), the
where fleaf,min and fleaf,max are the prescribed values for          critical phytomer age (Agephycrit ) is estimated to be around
minimum and maximum leaf allocation. LAI4 is the LAI of              600 to 720 d. Based on previous studies (Van Kraalingen et
the oldest leaf age cohort 4. L1 , L2 and L3 are empirical co-       al., 1989; Corley and Tinker, 2015; Fan et al., 2015), the leaf
efficients, set to be 0.45, 100 and 3 (unitless), based on the       longevity for oil palm is 600–700 d, shorter than the 730 d
calibrations using observed NPP allocation among leaf, sap-          used for the default TBE tree PFT in ORCHIDEE-MICT. As
wood and fruit (Henson and Dolmat, 2003; Van Kraalingen              a result, both the critical leaf age (leaf longevity) and the crit-
et al., 1989).                                                       ical phytomer age (Agephycrit ) are set to be 640 d. The critical
   The original leaf (fleaf,ori ), root (froot,ori ), and sapwood    fruit age (Ageffbcrit ), defined as the duration between the fruit
and reproductive tissue (fsap+rep,ori ) allocation scheme in re-     initiation and harvest, is set as 600 d, that is, shorter than the
sponse to water, light and nitrogen in the ORCHIDEE-MICT-            critical phytomer age, allowing leaf senescence after the fruit
OP was modified from the default ORCHIDEE-MICT. To                   harvest.
harmonize the new leaf allocation fraction (fleaf ) and the             After pruning, cut branches in a pruned phytomer are
original one (fleaf,ori ), root, sapwood and reproductive organ      transferred to the litter pool. Considering that the removal
allocation fractions were further rescaled:                          of leaves is not very well represented at the time of phytomer

froot = max min froot,ori − R1                                       pruning, we further added an extra leaf loss (Lossm    leaf ) of the
                                                                   old leaves (using the leaf age cohort) at the time when the
    ×abs(fleaf − fleaf,ori ), froot,max , froot,min ,          (9)   oldest phytomer is manually pruned as follows:
fsap+rep = 1 − froot − fleaf ,                               (10)
                                                                     Lossm             m
                                                                         leaf = Biomassleaf × LO1 /nphs(m = 3, 4),                  (12)
where froot,min and froot,max are the prescribed values of min-
imum and maximum root allocation according to Kotowska               where Biomassmleaf is the leaf biomass for leaf cohort m and
et al. (2015). R1 is an empirical coefficient (= 0.95).              LO1 is an empirical leaf loss coefficient.

Geosci. Model Dev., 14, 4573–4592, 2021                                                https://doi.org/10.5194/gmd-14-4573-2021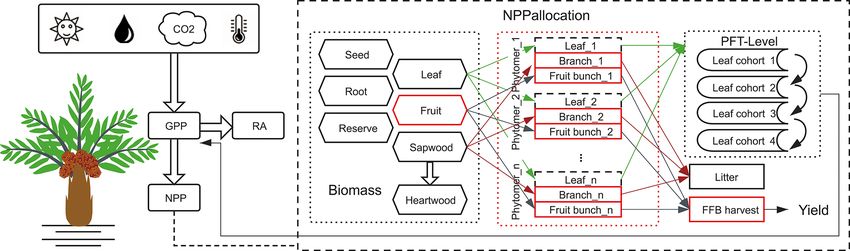
Y. Xu et al.: Oil palm modelling in the global land surface model ORCHIDEE-MICT 4581
In the default ORCHIDEE-MICT version, the carbon res- 20 years for comparison. Fruit yields are converted to kg dry
idence time (τ ) of biomass is set as 70 years for natural trop- matter (DM) ha−1 yr−1 using a carbon ratio of 0.45.
ical forests to represent the natural mortality. Oil palms, on
the other hand, are managed and are clear-cut at ∼ 25 years
for the next rotation cycle. The natural tree mortality is thus 3 Results: model evaluation
not applicable for oil palms. In ORCHIDEE-MICT-OP, we
3.1 LAI and leaf phenology
assumed that oil palm is manually cut down for rotation be-
fore the natural mortality without considering the disease and Figure 6 shows the annual dynamics of observed and sim-
other causes of tree loss as well (clear-cutting every 25 years, ulated LAI vs. tree age averaged over the 14 observation
Fig. 5). sites (black line). For each age, we collected observational
LAI values from different field measurement studies and pre-
2.4.5 Sensitivity analysis sented the medians and ranges (the red marker and error bar)
in Fig. 6. Since there are no continuous LAI measurements
Because of the distinct age cohorts of oil palm and age- available (to the best of our knowledge), we combined sin-
based parameterizations for photosynthesis and allocation gle LAI measurements at a certain age from different stud-
in ORCHIDEE-MICT-OP, performing the sensitivity analy- ies. The simulated LAI increases from 0.3 to 5.3 in the first
sis on every age-specific parameter would be too CPU in- ∼ 10 years and then stays stable at the maximum value (5.5,
tensive. Instead, we performed sensitivity tests of the ma- Fig. 6). The simulated LAI trajectory can generally repro-
jor parameters related to oil palm photosynthesis and alloca- duce the trend from observations. Although simulated LAI
tion, particularly for the phytomer-related allocation param- ranges overlap with the ranges of LAI observations at most
eters without enough constraints from field observations. For ages, some observations are not reproduced at Age 13 and
the age-specific parameters (e.g. Vcmax25 , sla), the calibrated Age 19 when the model achieved a stable and maximum
value for CFT5 (the most productive phase with the maxi- LAI (Fig. 6). This variability of LAI measurements reflects
mum yield) was tested. The sensitivity tests were conducted the use of different sites with different oil palm species and
by changing the selected parameters (variables with ∗ in Ta- management practices. In the model, however, genotypes and
ble S2) by ±5 %, ±10 % and ±20 % from the originally cal- practices are uniform. The detailed intra-annual variations in
ibrated value while keeping the other parameters unchanged. LAI, combined with leaf biomass and Vcmax for each leaf
Their impacts on the cumulative yields at the most produc- age cohort, are shown in Fig. S3 with significant seasonal-
tive phase ageing from 10–25 (corresponded to CFT5) were ity after merging the leaf phenology scheme from Chen et
evaluated. For the grouped parameters such as the phytomer al. (2020). Compared to the ORCHIDEE-MICT version with
allocation coefficient (P1 /P2 /P3 ), the sensitivity was tested no seasonality in LAI (dashed line in Fig. S3a), the LAI of
by changing ±5 %, ±10 % and ±20 % of the target function young leaves increases but decreases for old leaves during
i,nphs
(Fbr+fr ) using different combinations of P1 –P3 . the canopy rejuvenation period (January to May, solid line
in Fig. S3a). The opposite behaviour is shown in the rest of
2.5 Site simulation setup the year. Similarly, the default ORCHIDEE-MICT version
shows no seasonality of leaf age and leaf photosynthetic ef-
The 6-hourly 0.5◦ global climatic data, CRUNCEP v8 and ficiency in different leaf age classes (dashed line in Fig. S3b
the 0.08◦ global soil texture map were used as forcing data in and c), while the seasonality of leaf age and leaf efficiency is
the simulations (Reynolds et al., 2000). The vegetation cover successfully captured in this version (solid lines in Fig. S3b
of the 14 sites (Fig. 1 and Table S1) was all set to the oil and c).
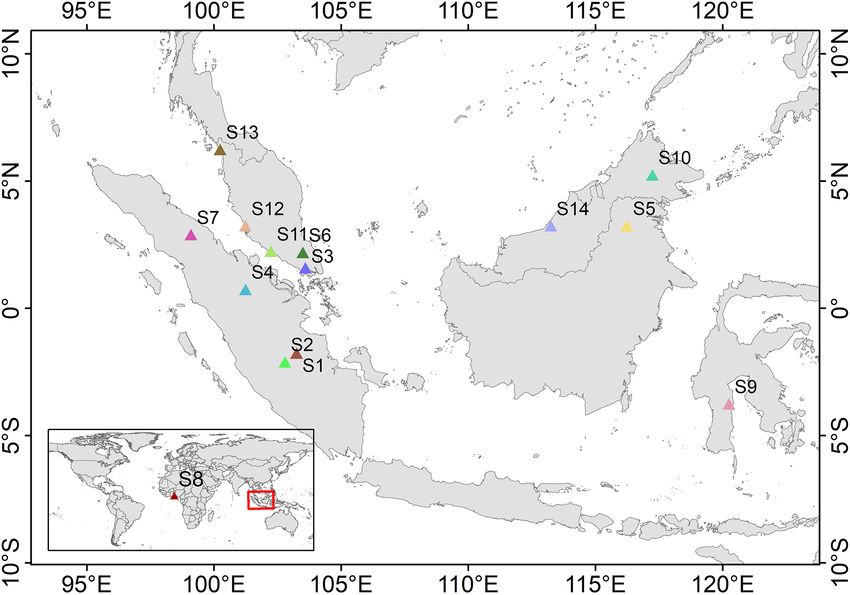
palm PFT with a coverage of 100 %. Biomass boundary val-
ues for each age class (Fig. 5) are prescribed for oil palm 3.2 Productivity and fruit yield
based on the prior knowledge from observation (Tan et al.,
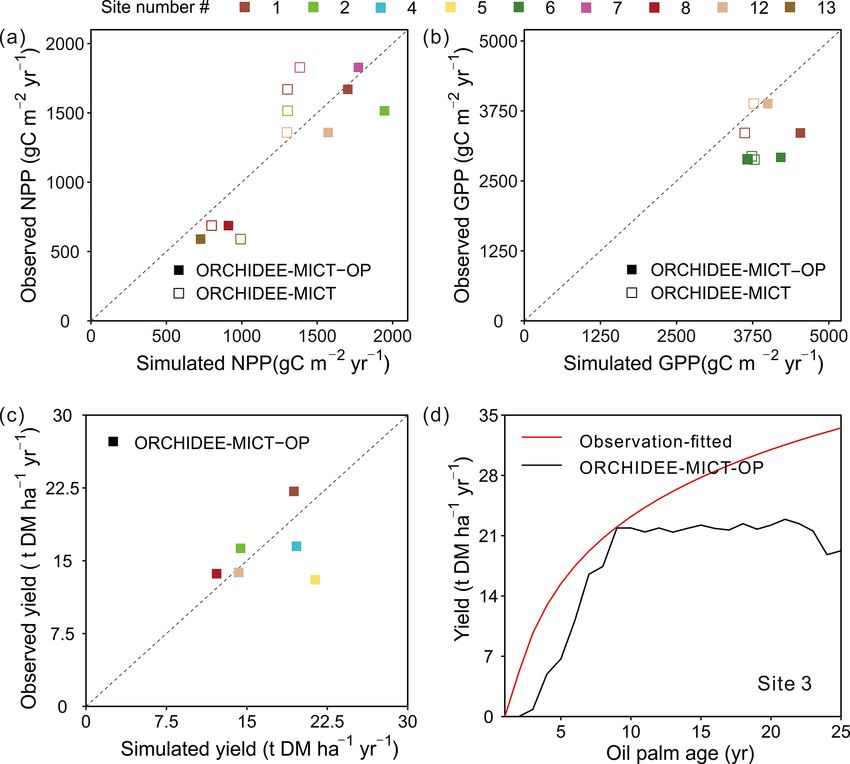
2014). When the total biomass reaches the lower boundary The simulated GPP, NPP and fruit yield in comparison with
of the oldest tree age class (CFT6, Figs. 3 and 5) and moves field measurements are shown in Fig. 7. Compared to the de-
to CFT6, wood harvesting will be performed, and oil palm fault ORCHIDEE-MICT version, NPP can be better repro-
trees will thus be cut down. New oil palms will be estab- duced by ORCHIDEE-MICT-OP (solid squares closer to the
lished in the youngest tree class (CFT1) for the next rota- 1 : 1 line than the open square, Fig. 7a) with a normalized
tion cycle. Site simulations were run for 30 years, which is mean bias error (NMBE, defined as the sum of biases divided
consistent with the rotation duration of ∼ 25 years, and the by the sum of field values) of 12.87 % and r 2 of 0.9 across
climatic forcings for the period between 1986 to 2015 were sites. Among the 14 sites with NPP observations, simulated
used. Spin-up simulation was not performed since we did not NPP at Sites 1, 7 and 12 is comparable with observations
focus on the soil organic carbon and there is no feedback of with an NMBE of only 4.0 % while simulated results from
soil carbon to plant growth in the model. Oil palm yields at other sites are relatively higher than observations (NMBE
maturity were calculated using the average values during 11– of 28.8 %). For GPP, there are only three observations avail-
https://doi.org/10.5194/gmd-14-4573-2021 Geosci. Model Dev., 14, 4573–4592, 2021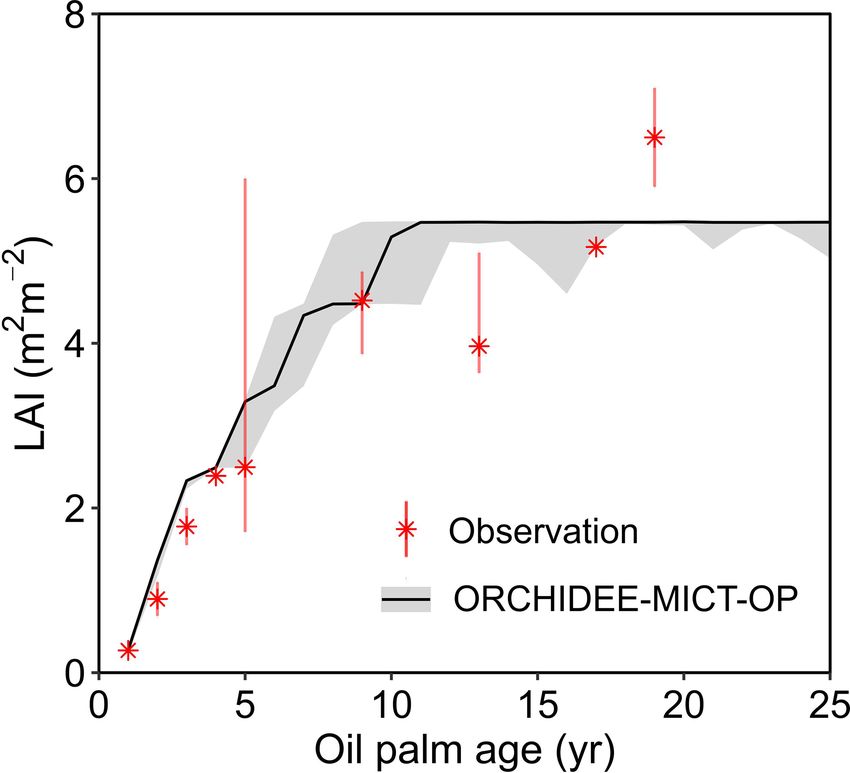
4582                                     Y. Xu et al.: Oil palm modelling in the global land surface model ORCHIDEE-MICT

Figure 5. Tree age classes of oil palm along with the temporal change in total biomass. (a) An example of oil palm tree age class dynamics:
(1) keep growing and move to the older tree age class; (2) move to the youngest age class after clear-cutting for rotation. (b) The growing
curve of total biomass for the oil palm tree. The labelled numbers are the biomass boundary of each CFT.

                                                                            For fruit yields, we collected six single-year observa-
                                                                         tions at different sites for oil palm plantations aged from
                                                                         10–15 years, except for one site where yield data cover
                                                                         ages 4 to 16. The observed oil palm yields at matu-
                                                                         rity vary from 13.0 to 22.1 t DM ha−1 yr−1 with a median
                                                                         of 15.0 t DM ha−1 yr−1 , and the simulated yields show a
                                                                         similar range of 12.2–21.4 t DM ha−1 yr−1 with a median
                                                                         of 16.9 t DM ha−1 yr−1 . Thus, simulated fruit yields show
                                                                         an overall good agreement with site observations with an
                                                                         NMBE of 6.1 % (Fig. 7c). There is only one site (Site 3)
                                                                         with available yield estimates for successive years (Fig. 7d).
                                                                         It should be noted that it is not real observations but a fit-
                                                                         ted curve with oil palm age of yield data provided by the
                                                                         Malaysian Palm Oil Board (MPOB) research station at Ker-
                                                                         atong (Tan et al., 2014). This yield-age curve shows a strong
                                                                         yield increase after Age 10 and even Age 25 (Fig. 7d), which
                                                                         goes against the field evidence that fruit yields for oil palms
Figure 6. Temporal dynamics of LAI for oil palm. The black solid         reach a maximum at ∼ 10 years, stay relatively stable and de-
line and the grey shade indicate the median and range of simulated       crease after ∼ 25 years (Goh et al., 1994; van Ittersum et al.,
LAI for oil palm across all sites in ORCHIDEE-MICT-OP. The er-           2013). The reduction in yields after ∼ 25 years is also one
ror bars of observations represent the range of different observations   of the reasons for clear-cutting for the next rotation. Still,
at a certain age from various locations, treatments and species.         we compared our simulated yields with that yield-age curve
                                                                         (Fig. 7d). The simulated annual fruit yield at Site 3 is gen-
                                                                         erally consistent with data during the first 9 years but lower
able, and simulated values by ORCHIDEE-MICT-OP are rel-                  than the curve in the subsequent years, probably due to the
atively higher than the observed values with an NMBE of                  uncertainties in the yield-age curve. Besides, the simulated
25.4 %.                                                                  annual and cumulative yields also showed good agreement
                                                                         with observations at the two independent sites (site in the

Geosci. Model Dev., 14, 4573–4592, 2021                                                  https://doi.org/10.5194/gmd-14-4573-2021
Y. Xu et al.: Oil palm modelling in the global land surface model ORCHIDEE-MICT 4583
Figure 7. Comparison of simulated (a) NPP, (b) GPP, (c) fruit yield and (d) temporal dynamics of yields against observations. “ORCHIDEE-
MICT-OP” refers to the simulation results by the ORCHIDEE-MICT-OP version using the newly added oil palm PFT. “ORCHIDEE-MICT”
refers to the simulation results by the default ORCHIDEE-MICT version using the TBE tree PFT. The dashed line indicates the 1 : 1 ratio
line.
Merlimau estate in Fig. 11, Teh and Cheah, 2018, and site default ORCHIDEE-MICT. We further compared the simu-
PTPN-VI in Fig. 6, Fan et al., 2015), indicating the model’s lated above- and belowground biomass and their ratio with
ability to capture yield dynamics (Figs. S6 and S7). observations (Fig. 8b). Similarly, the ORCHIDEE-MICT-OP
version can better reproduce the observations than the de-
3.3 Biomass fault ORCHIDEE-MICT version. The NMBE for above- and
belowground biomass between ORCHIDEE-MICT-OP and
Figure 8 shows the comparison of simulated biomass and observations is 12.1 % and 55.3 %, respectively. The ratio of
time series with observations. The biomass here includes the AGB and BGB is calculated as being 1.7, which is much
developing fruit but excludes the harvested fruit biomass. closer than the observation (1.1–3.0) compared with that of
Note that some sites have several observed values (Sites 1, 2, the default ORCHIDEE-MICT (0.7–0.8).
9 and 10 in Fig. 8a) at different ages and for biomass compo- There are only two sites (Sites 3 and 12, Fig. 8c and
nents, e.g. total biomass (TB), aboveground biomass (AGB) d) with time series of biomass. Similar to the fruit yields
and belowground biomass (BGB). A total of 13 biomass ob- (Fig. 8d) simulated biomass by ORCHIDEE-MICT-OP gen-
servations were collected for different age groups (three in erally agrees with observed values but is higher in the
the young age group, eight at maturity, and the remaining first 18 years and lower afterward (Fig. 8c). At Site 12,
two for averaged biomass among several years, Table S1). ORCHIDEE-MICT-OP-simulated biomass is higher than ob-
Compared to the default ORCHIDEE-MICT version, sim- servations for the whole oil palm life cycle. This is probably
ulated biomass by ORCHIDEE-MICT-OP is more consis- because Site 12 was covered by very deep peat soil (> 3 m)
tent with observations (Fig. 8a). Of the 13 sites, 10 are dis- with a high soil water table and high C density, and the po-
tributed close to the 1 : 1 line, except for Site 2 (TB at age tential impact on the oil palm production is not considered
10), Site 9 (AGB at age 16) and Site 10 (AGB at maturity). (e.g. different nutrient availability in peat and mineral soil
The NMBE of oil palm biomass is 10.4 % after excluding and palm leaning in peat soil which may cause the decline
Site 9 with the largest bias, compared with 156.7 % by the of yield). A detailed discussion of the oil palm on peat is
https://doi.org/10.5194/gmd-14-4573-2021 Geosci. Model Dev., 14, 4573–4592, 20214584 Y. Xu et al.: Oil palm modelling in the global land surface model ORCHIDEE-MICT
Figure 8. Comparison of simulated (a) total biomass, (b) aboveground biomass (AGB) and belowground biomass (BGB), and temporal
dynamics of estimated biomass for oil palm at (c) Site 3 and (d) Site 12 against observations. The observations from Site 3 and Site 12 were
calculated by an allometric equation using the measured diameter at breast height (DBH) and height of the stem. “ORCHIDEE-MICT-OP”
refers to the simulation results by the ORCHIDEE-MICT-OP version using the newly added oil palm PFT. “ORCHIDEE-MICT” refers to
the simulation results by the default ORCHIDEE-MICT version using the TBE tree PFT. The dashed line in (a) and (b) indicates the 1 : 1
ratio line.
presented in Sect. 4.2 and 4.3. Also, the calibration is based also consistent with the observed fraction (60 %–75 %, Hen-
on the observations from all sites and no calibration was ap- son and Harun, 2005). In the simulation by ORCHIDEE-
plied for this site, which may cause the higher estimation. MICT-OP, stem and leaf (median of 18.9 % in GPP) oc-
The NMBE is 16.2 % and 15.5 % at Site 3 and Site 12. The cupies the largest parts of NPP, followed by fruit alloca-
default ORCHIDEE-MICT version largely overestimated the tion (17.5 %) and root allocation (2.8 %). The differences
biomass at both sites (dashed line in Fig. 8c, d). between the simulated NPP fraction for stem and leaf, root
and yield by ORCHIDEE-MICT-OP and observed fraction
3.4 Partitioning of GPP, NPP and biomass are 10.9 %, −1.4 % and −2.0 %, respectively, indicating a
good representation of NPP allocation to different biomass
Comparison of oil palm GPP and biomass partitioning be- components in the new model.
tween simulations and observations is shown in Fig. 9. Com- Simulated partitioning of biomass by ORCHIDEE-MICT-
pared to the default ORCHIDEE-MICT version (grey bars), OP is closer to observations (Breure, 1988; Henson and Dol-
simulated results from the ORCHIDEE-MICT-OP version mat, 2003; Tan et al., 2014) than the default ORCHIDEE-
(black bars) are closer to the observations (red bars, Fig. 9). MICT version (Fig. 9b). The simulated leaf and root and
GPP is partitioned into GR, MR and NPP, whereas NPP is other organs (stem, fruit and branch biomass) proportion of
further divided into allocation to stem and frond, root and total biomass varies between 51.7 %–75.1 %, 14.7 %–32.4 %
fruit (Fig. 9a). The simulated growth and MR fraction in and 8.5 %–16.0 %. The simulated fraction to other organs is
GPP ranges from 17.1 %–28.8 % and 28.1 %–54.3 %, respec- higher (14.7 %) than observations, and correspondingly it is
tively, which is comparable with observations (21 %–31 % lower for leaf (−6.1 %) and root (−5.6 %) fractions; the im-
and 34 %–44 %) from Henson and Dolmat (2003). The sim- provements reach 18.8 %, 13.0 % and 6.2 % compared to the
ulated fraction of autotrophic respiration in GPP (60.87 %) is biases in the default ORCHIDEE-MICT. Note that the pro-
Geosci. Model Dev., 14, 4573–4592, 2021 https://doi.org/10.5194/gmd-14-4573-2021Y. Xu et al.: Oil palm modelling in the global land surface model ORCHIDEE-MICT 4585
Figure 9. Components of (a) GPP and (b) standing biomass. The fruit component in (b) is the developing fruit in the phytomer and the
harvested fruit is not accounted for in the total biomass. Error bars show the ranges across different sites and ages. GR and MR stand for
growth respiration and maintenance respiration.
portion of fruit bunch and branch of a phytomer is not sep- tree age class to the next older class. This is because values
arated but added in the stem proportion because most of the for some parameters (e.g. Vcmax and LAImax , Table S2) are
studies presented fruit and branch biomass fraction as a part different among the CFT 2–4 in the fruit development phase.
of stem biomass (Van Kraalingen et al., 1989; Henson and For example, LAImax increases from 3.5 in CFT3 to 4.5 in
Dolmat, 2003). Also, the time and frequency of collecting CFT4. In the ORCHIDEE framework, biomass will prefer-
fruits and measuring biomass are usually not synchronous. entially be allocated to the leaf to reach LAImax in order to
There is only one field study showing that the phytomer (fruit grow more leaves to increase GPP and then be allocated to
and branch) fraction varies between 5.0 %–14.5 % of the to- other biomass parts when LAI reaches LAImax (Krinner et
tal biomass after fruit harvest (Breure, 1988), which is com- al., 2005). Therefore, when oil palms move from CFT3 to
parable with the simulated median proportion of 14.4 % by CFT4, the increased LAImax drives more biomass going to
ORCHIDEE-MICT-OP. leaf (Fig. 10c) and less to the fruit and branch at the be-
ginning of CFT4, resulting in the small decline in the fruit
3.5 Phytomer development and branch biomass. We acknowledge that this model be-
haviour may contradict the reality, but the small magnitude
and short duration of the decline (Fig. 10c) may have little
The growth of phytomers during the life cycle (initiation, impact on the modelling results. At the productive (maturity)
fruit development and productive phases) of oil palm is pre- phase after age 10, the average leaf, fruit and branch biomass
sented in Fig. 10. Figure 10a and b show the fruit and branch is 683.8, 424.0 and 64.8 gC m−2 , which consists to 58.3 %,
growth in single phytomer (8 in 40 phytomers were shown 36.1 % and 5.5 % of the total phytomer biomass (40 in total),
for a better visualization), while Fig. 10c is the total biomass respectively.
for all the 40 phytomers as a sum of leaf, branch and fruit
components. The initiation phase roughly corresponds to an
oil palm tree age between 0 to 2 without any fruit production. 3.6 Sensitivity analysis results
Subsequently, age 2–10 is the fruit development phase. Af-
ter 10 years old, an oil palm reaches the productive phase The maximum rate of carboxylation (Vcmax25 ) is the most
with maximum and steady fruit yields. This phenological sensitive photosynthesis parameter because it determines
characteristic is consistent with the oil palm development the photosynthesis rates of the leaf, followed by sla.
observed in previous studies (Sunaryathy et al., 2015). One Changes of ±20 % of the baseline value of Vcmax25 lead
study even shows that the productive phase can start as early to 13.8 %/20.5 % increase/decrease in the cumulative yields
as at ∼ 7 years old (Henson and Dolmat, 2003). from age 10 to 25 (Fig. 11). The maximum leaf area index
The biomass of leaf and branch of all the phytomers starts (LAImax ), a threshold beyond which there is no allocation of
to increase after planting (Fig. 10c) and reaches about 211.3 biomass to leaves, has a smaller influence on the yields than
and 28.6 gC m−2 at the end of age 2. The fruit production Vcmax25 and sla. Yields are not changed linearly with changes
and harvest begin after entering the fruit development phase in the LAImax value since it is a threshold parameter by defi-
(the end of age 2) (Fig. 10a), whereas the total fruit biomass nition.
increases rapidly to 367.6 gC m−2 at age ≈ 10. From age 2 to For the allocation parameters, the empirical coefficients
10, phytomer biomass increases with a step shape, and fruit for the leaf (L1 /L2 /L3 ) (Eq. 8) and root (R1 ) (Eq. 9) allo-
and branch biomass slightly decline when moving from one cation have a very small impact on the fruit yields. The other
https://doi.org/10.5194/gmd-14-4573-2021 Geosci. Model Dev., 14, 4573–4592, 2021You can also read