Black carbon and organic carbon dataset over the Third Pole
←
→
Page content transcription
If your browser does not render page correctly, please read the page content below
Earth Syst. Sci. Data, 14, 683–707, 2022
https://doi.org/10.5194/essd-14-683-2022
© Author(s) 2022. This work is distributed under
the Creative Commons Attribution 4.0 License.

                             Black carbon and organic carbon
                                dataset over the Third Pole
       Shichang Kang1,11 , Yulan Zhang1 , Pengfei Chen1 , Junming Guo1 , Qianggong Zhang2 , Zhiyuan Cong2 ,
       Susan Kaspari3 , Lekhendra Tripathee1 , Tanguang Gao4 , Hewen Niu1 , Xinyue Zhong5 , Xintong Chen1 ,
             Zhaofu Hu1 , Xiaofei Li6 , Yang Li7 , Bigyan Neupane8 , Fangping Yan1 , Dipesh Rupakheti9 ,
           Chaman Gul10 , Wei Zhang1 , Guangming Wu2 , Ling Yang1 , Zhaoqing Wang4 , and Chaoliu Li1
          1 State   Key Laboratory of Cryospheric Science, Northwest Institute of Eco-Environment and Resources,
                                      Chinese Academy of Sciences, Lanzhou 730000, China
                      2 State Key Laboratory of Tibetan Plateau Earth System, Resources and Environment,

                   Institute of Tibetan Plateau Research, Chinese Academy of Sciences, Beijing 100101, China
               3 Department of Geological Sciences, Central Washington University, Ellensburg, Washington, USA
                      4 Key Laboratory of Western China’s Environmental Systems (Ministry of Education),

                   College of Earth and Environmental Sciences, Lanzhou University, Lanzhou 730000, China
              5 Key Laboratory of Remote Sensing of Gansu Province, Northwest Institute of Eco-Environment and

                                 Resources, Chinese Academy of Sciences, Lanzhou 730000, China
              6 School of Environmental Science and Engineering, Shannxi University of Science and Technology,

                                                       Xi’an 710021, China
           7 Institute of International Rivers and Eco-security, Yunnan University, Kunming 650091, Yunnan, China
                        8 School of Geography, South China Normal University, Guangzhou 510631, China
           9 Jiangsu Key Laboratory of Atmospheric Environment Monitoring and Pollution Control, Collaborative

       Innovation Center of Atmospheric Environment and Equipment Technology, School of Environmental Science
             and Engineering, Nanjing University of Information Science and Technology, Nanjing 210044, China
          10 Reading Academy, Nanjing University of Information Science and Technology, Nanjing 210044, China
       11 College of Resources and Environment, University of Chinese Academy of Sciences, Beijing 100049, China

         Correspondence: Shichang Kang (shichang.kang@lzb.ac.cn) and Yulan Zhang (yulan.zhang@lzb.ac.cn)

                                   Received: 11 June 2021 – Discussion started: 28 June 2021
                      Revised: 27 December 2021 – Accepted: 5 January 2022 – Published: 17 February 2022

      Abstract. The Tibetan Plateau and its surroundings, also known as the Third Pole, play an important role in the
      global and regional climate and hydrological cycle. Carbonaceous aerosols (CAs), including black carbon (BC)
      and organic carbon (OC), can directly or indirectly absorb and scatter solar radiation and change the energy bal-
      ance on the Earth. CAs, along with the other atmospheric pollutants (e.g., mercury), can be frequently transported
      over long distances into the inland Tibetan Plateau. During the last decades, a coordinated monitoring network
      and research program named “Atmospheric Pollution and Cryospheric Changes” (APCC) has been gradually
      set up and continuously operated within the Third Pole regions to investigate the linkage between atmospheric
      pollutants and cryospheric changes. This paper presents a systematic dataset of BC, OC, water-soluble organic
      carbon (WSOC), and water-insoluble organic carbon (WIOC) from aerosols (20 stations), glaciers (17 glaciers,
      including samples from surface snow and ice, snow pits, and 2 ice cores), snow cover (2 stations continuously
      observed and 138 locations surveyed once), precipitation (6 stations), and lake sediment cores (7 lakes) collected
      across the Third Pole, based on the APCC program. These data were created based on online (in situ) and labo-
      ratory measurements. High-resolution (daily scale) atmospheric-equivalent BC concentrations were obtained by
      using an Aethalometer (AE-33) in the Mt. Everest (Qomolangma) region, which can provide new insight into
      the mechanism of BC transportation over the Himalayas. Spatial distributions of BC, OC, WSOC, and WIOC
      from aerosols, glaciers, snow cover, and precipitation indicated different features among the different regions

Published by Copernicus Publications.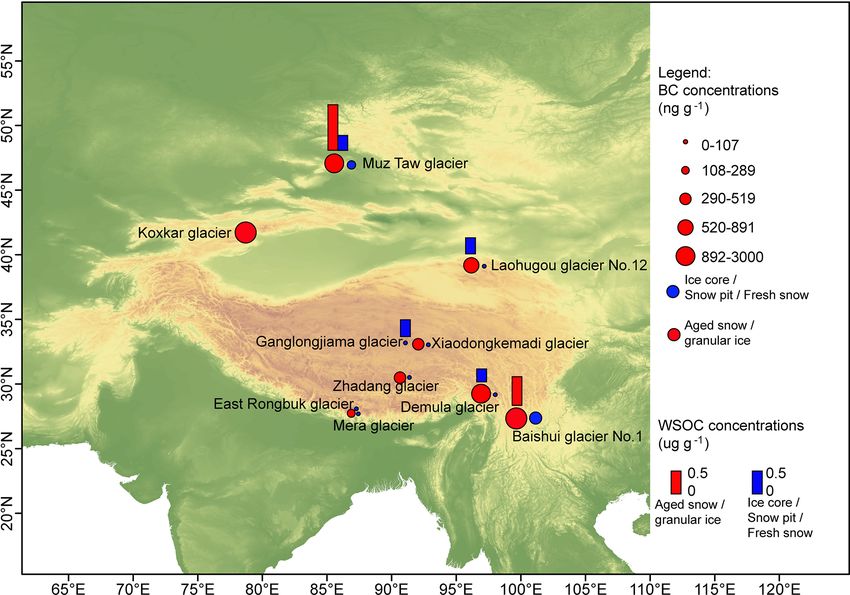
684                                             S. Kang et al.: Black carbon and organic carbon dataset over the Third Pole

       of the Third Pole, which were mostly influenced by emission sources, transport pathways, and deposition pro-
       cesses. Historical records of BC from ice cores and lake sediment cores revealed the strength of the impacts
       of human activity since the Industrial Revolution. BC isotopes from glaciers and aerosols identified the relative
       contributions of biomass and fossil fuel combustion to BC deposition on the Third Pole. Mass absorption cross
       sections of BC and WSOC from aerosol, glaciers, snow cover, and precipitation samples were also provided.
       This updated dataset is released to the scientific communities focusing on atmospheric science, cryospheric sci-
       ence, hydrology, climatology, and environmental science. The related datasets are presented in the form of excel
       files. BC and OC datasets over the Third Pole are available to download from the National Cryosphere Desert
       Data Center (https://doi.org/10.12072/ncdc.NIEER.db0114.2021; Kang and Zhang, 2021).

1   Introduction                                                  lated and combined with westerlies and local mountain val-
                                                                  ley breeze (Cong et al., 2015; Kang et al., 2019; Painicker et
With high elevations (average > 4000 m a.s.l.), the Tibetan       al., 2021; Yang et al., 2018). Although the atmospheric envi-
Plateau (TP) and its surroundings, known as the Third Pole,       ronment over the TP is minimally disturbed by local anthro-
play an important role in the Earth’s climate through its com-    pogenic activity because of the sparse population and limited
plex topography (Yao et al., 2019). Due to the wide distribu-     industries (Cong et al., 2013; Kang et al., 2019), local emis-
tions of mountain glaciers, snow cover, permafrost, and sea-      sions from booming tourism traffic or domestic fossil fuel
sonally frozen ground, the TP and its surroundings are also       and biomass burning also potentially contributed to the cli-
known as the Asian Water Tower (Immerzeel et al., 2010;           matic and environmental changes (Li et al., 2018a). The in-
Yao et al., 2012), which consists of the source regions of        vestigations of CAs from various environmental media in the
several large Asian rivers (e.g., Yellow, Yangtze, Brahmapu-      TP will improve our understanding of recent environmental
tra, Ganges, and Indus rivers). The TP is particularly sen-       changes and their impact on rapid cryospheric melting under
sitive to climate change and regional anthropogenic forc-         climate warming.
ing and currently has been experiencing significant warming          The glaciers provide natural archives of climate and en-
(Chen et al., 2015; Gao et al., 2019; Huss and Hock, 2018;        vironmental information (Jouzel, 2013; Thompson, 2000;
IPCC, 2021; Kang et al., 2010; Ramanathan et al., 2007b;          Yao et al., 2006). Historical BC records from the Tibetan
Ramanathan and Carmichael, 2008; Xu et al., 2009; You et          glacier ice cores revealed the impact of anthropogenic emis-
al., 2021). Recent rapid cryospheric changes (e.g., glacier       sions, with BC concentrations increasing by a factor of 2–
melting, permafrost thawing, snow cover declining) on the         3 since the 1950s (Kaspari et al., 2011; Wang et al., 2015,
TP profoundly affect the regional water cycle and ecosys-         2021). Light-absorbing BC and OC (including water-soluble
tems (Brun et al., 2020; M. Chen et al., 2019; Kang et al.,       organic carbon (WSOC) and water-insoluble organic car-
2015; Immerzeel et al., 2020; Nie et al., 2021; Sun et al.,       bon (WIOC)) deposited on the glacier and snow cover in-
2021; Yao et al., 2012, 2019; G. Zhang et al., 2020).             duced surface darkening and enhanced melting (Flanner et
   Due to the harsh environment and poor accessibility, ob-       al., 2007; Kang et al., 2020; Lau and Kim, 2018; Santra et
served data on the TP are still scarce, which limits the ef-      al., 2019; Xu et al., 2009; Y. Zhang et al., 2020, 2021b).
fective investigation, verification, and calibration of reanal-   Estimates indicated that BC in snow resulted in accelerated
ysis data and modeling simulations (Qian et al., 2015; You        glacier melt by approximately 15 %–20 % in the southeast-
et al., 2020). In particular, studies on atmospheric carbona-     ern and central TP and Central Asia (Li et al., 2020; Zhang
ceous components (e.g., black carbon, BC; organic carbon,         et al., 2017a, 2020b) and reduced snow cover duration by
OC) have gained wide attention due to the fact that they          3–4 d across the TP and 3–6 d in northern Xinjiang (Zhang
can directly or indirectly absorb or scatter solar radiation,     et al., 2018b; Zhong et al., 2019), respectively. Meanwhile,
alternately interact with the nucleation of clouds, and influ-    WSOC in snow may also contribute to glacier melting (Hu et
ence the precipitation efficiency (Bond et al., 2013; IPCC,       al., 2018; Gao et al., 2020) due to its light absorption property
2013; Ji et al., 2016; Ramanathan et al., 2005; Ramanathan        equal to approximately 10 % of that by BC in the northern TP
and Carmichael, 2008; Ramachandran et al., 2020; Yang et          and northern Xinjiang (Yan et al., 2016; Zhang et al., 2019).
al., 2020). These carbonaceous aerosols (CAs) have substan-       The isotopic signatures of BC from glaciers and modeling re-
tially influenced the climate and environmental changes on        sults constrained BC sources in the TP, which indicated that
the Earth (Kang et al., 2020; X. Li et al., 2017; Xu et al.,      BC was predominately derived from fossil fuel combustion
2012; P. Chen et al., 2019; Zhang et al., 2017a; Zhang et al.,    (> 60 %) in the northern TP. Meanwhile in the southern TP,
2012). The TP has recently been polluted by anthropogenic         comparable contributions from fossil fuel combustion (46 %)
emissions mainly from long-range atmospheric transport, es-       and biomass burning (54 %) to BC were observed (Li et al.,
pecially during the pre-monsoon, when the aerosols accumu-        2016a; Yang et al., 2018; Zhang et al., 2017a). WSOC in

Earth Syst. Sci. Data, 14, 683–707, 2022                                            https://doi.org/10.5194/essd-14-683-2022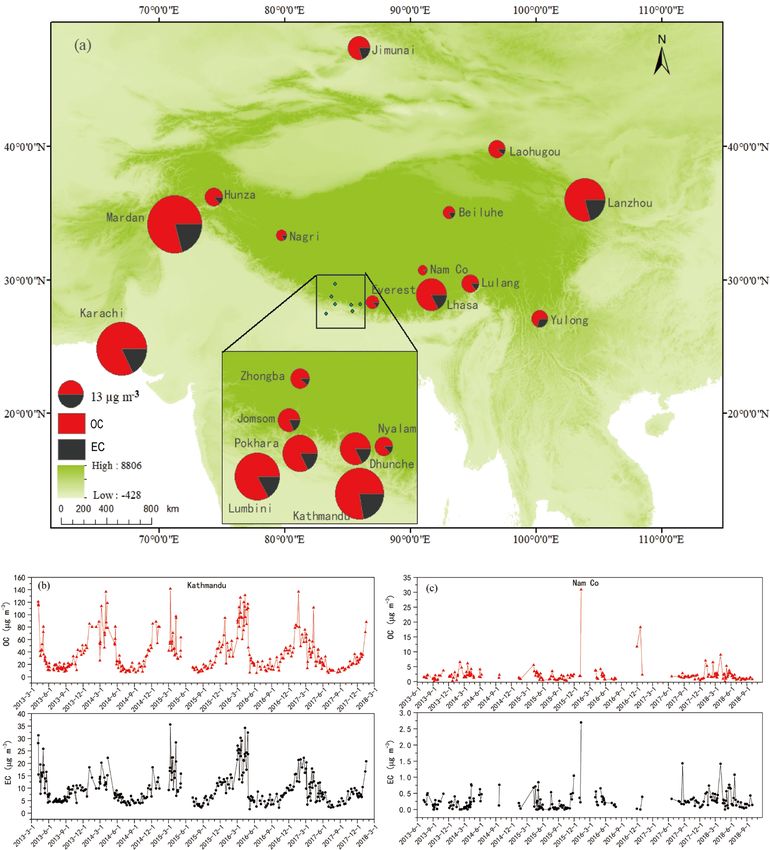
S. Kang et al.: Black carbon and organic carbon dataset over the Third Pole                                                 685

precipitation can provide carbon to the ecosystems (Li et al.,    the systematic dataset of BC and OC from the atmosphere,
2018b). It was reported that the average WSOC concentra-          glaciers (including ice cores), snow cover, precipitation, and
tions of precipitation in the Nam Co region (inland TP) were      lake sediment cores over the TP and its surroundings based
lower than those in the urban areas but higher than those from    on the APCC program. The site description, online observa-
snow pit samples (Li et al., 2018b).                              tions, and sampling are summarized in Sects. 2 and 3, respec-
   Over the TP, large numbers of lakes are distributed (in-       tively. A detailed data description of laboratory analysis and
cluding proglacial lakes) (Brun et al., 2020; G. Zhang et         BC, OC, WSOC, and WIOC concentrations from aerosols,
al., 2020). As BC is chemically inert in the lake sediment        glaciers, precipitation, snow cover, and refractory BC (rBC)
cores, it can serve as an archive and reliable indicator to in-   historical records from ice cores and BC from lake sediment
vestigate the source and transport of BC in the past (Han et      cores is given in Sect. 4, highlighting the primary results
al., 2012). The BC investigation from lake sediment cores         and differences and similarities among the studied regions.
over the plateau revealed an increasing trend of BC concur-       Meanwhile, mass absorption cross section (MAC) values of
rent with increased anthropogenic emissions since the 1950s       BC and WSOC from aerosols, glaciers, snow cover, and
(Cong et al., 2013; Han et al., 2015; Neupane et al., 2019;       precipitation and carbon isotopic signatures (114 C, δ 13 C)
Zhu et al., 2020) and suggested that BC deposition in recent      from glacier snow pits, precipitation, and aerosols are also
decades has increased about 2–3-fold compared to the back-        provided. The data availability and access are provided in
ground level.                                                     Sect. 5, and the conclusions are summarized in Sect. 6.
   During the past decades, our research team has gradu-
ally set up a coordinated monitoring network and research
                                                                  2     Research site descriptions
program (Atmospheric Pollution and Cryospheric Changes;
APCC), linking atmospheric pollution and cryospheric              2.1    Overview of site distributions
changes, covering the TP and its surrounding region (Fig. 1)
(Kang et al., 2019). Based on the APCC program, our over-         The TP can be divided into three distinct sub-regions, respec-
arching goal is to perform more integrated and in-depth in-       tively associated with the dominant influence of the wester-
vestigations of the origins and distributions of atmospheric      lies (northern TP), Indian monsoon (southern TP), and the
pollutants and their impacts on cryospheric changes. The up-      transition region in between. These sub-regions do not have
dated specific goals include the following:                       an exact boundary (Yao et al., 2013). These different features
                                                                  in sub-regions motivated the need for network observations
 1. Characterize the features of atmospheric pollutants (in-      to understand the atmospheric pollutants and their possible
    cluding new emergent pollutants), and depict their spa-       impact on the environment. The APCC program currently
    tial and seasonal variations in different environmental       consists of 29 stations across the TP and its surroundings
    media over the Third Pole region.                             covering these 3 distinct sub-regions (Fig. 1). As shown in
                                                                  Table 1, there is only one station (Nam Co) for observations
 2. Investigate the source appointment of different atmo-
                                                                  of aerosol, glacier, precipitation, and snow cover together;
    spheric pollutants based on chemical tracers and model-
                                                                  one station (Laohugou) for observation of aerosol, glacier,
    ing, and reveal the transport pathways and mechanisms
                                                                  and snow cover together; and three stations (Everest, Lulang,
    by which atmospheric pollutants are transboundary-
                                                                  and Yulong) for observation of aerosol, precipitation, and
    transported to the Third Pole region.
                                                                  glaciers together. Meanwhile, there are six stations for ob-
 3. Quantify the contribution of atmospheric pollutants de-       servation of aerosol and glaciers and one station (Lhasa) for
    posited as light-absorbing impurities to the glacier and      observation of aerosols and precipitation. Besides, there are
    snow melting, determine the fate of environmentally rel-      14 stations for only observation of aerosol, 1 station (Qilian)
    evant pollutants within glaciers and snowpack, and fur-       for only observation of precipitation, 1 station (Tanggula) for
    ther estimate the feedback of cryospehric melting to the      only observation of glacier, and 1 station (Koktokay) for only
    carbon (and nitrogen) cycle and hydrological changes.         observation of snow cover (Table 1). In summary, there are
                                                                  27 stations supporting aerosol sampling and observations, 20
A series of search results have been published on the re-         glaciers observed, 3 stations for snow cover observations,
search progress that depends on or is related to the APCC         138 locations for snow cover sampling once, and 6 stations
program during the past several years (Kang et al., 2019).        for precipitation observations (Table 1 and Fig. 1). In ad-
Recently, new progress was also achieved, including extend-       dition, lake sediment cores were studied from seven lakes
ing the study area to Central Asia (P. Chen et al., 2021;         across the Himalayas and TP. According to the distance and
Zhang et al., 2021b), investigating new emergent pollutant        the extent of impact from anthropogenic activity, these sta-
microplastics in snow (Zhang et al., 2021c), and discussing       tions were distributed into two major types, namely urban
the potential impact of glacier melting and permafrost thaw       stations (strongly influenced by anthropogenic activity) and
on the carbon cycle (Gao et al., 2021a; Zhang et al., 2021a).     remote stations (weakly impacted by direct anthropogenic
Therefore, in this article, we introduce and provide access to    emissions). As this paper is the first dataset report based on

https://doi.org/10.5194/essd-14-683-2022                                            Earth Syst. Sci. Data, 14, 683–707, 2022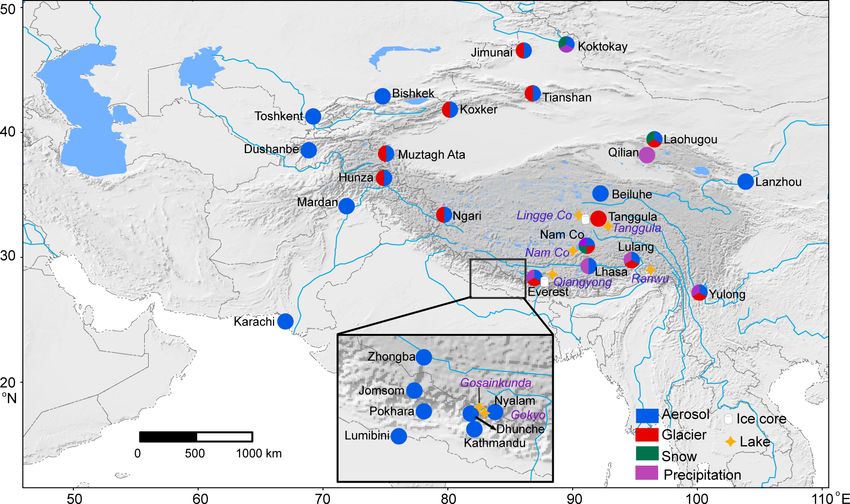
686                                              S. Kang et al.: Black carbon and organic carbon dataset over the Third Pole

Figure 1. Schematic overview of measurements from the Atmospheric Pollution and Cryospheric Changes program over the Third Pole, in
which coordinated carbonaceous component measurements were made on samples from the atmosphere, glaciers, snow cover, precipitation,
and lake sediment cores. The location information for each station, glacier, and lake is provided in Tables 1, 2, and 3.

the APCC program, we will release the carbonaceous dataset          mainly controlled by the westerlies. In the inland TP, two sta-
from 20 stations for aerosols, 17 glaciers (including samples       tions (Nam Co, Tanggula) are distributed across the Nyain-
from surface snow and ice, snow pits, and 2 ice cores), 2 sta-      qentanglha Mountains to the Tanggula Mountains, which are
tions for continuous snow cover observations, 138 locations         alternately influenced by the Indian monsoon and wester-
during snow cover surveys, 6 stations for precipitation, and        lies (as the transition sub-region; Yao et al., 2013). Aerosol
7 lake sediment cores across the TP and its surroundings. In        samples were also collected from Lhasa and Lanzhou city.
the future, more comprehensive datasets on mercury, heavy           The elevations of these stations ranged from 13 to over
metals, and persistent organic pollutants will also be reported     5000 m a.s.l. (Table 1), with landscapes including forest,
gradually from the APCC program.                                    alpine steppe, alpine meadow, and desert. These sites served
                                                                    as the key locations for field observations and measurements.
                                                                        There are five stations located on the southern side of the
2.2   Stations for the aerosol and precipitation studies            Himalayas in Nepal, focusing on aerosol studies to resolve
                                                                    the transboundary transport of air pollutants (Tripathee et al.,
The APCC network has a total of 29 stations for the
                                                                    2017; Chen et al., 2020). A list of the detailed information
aerosol and precipitation studies. In specific, for the spa-
                                                                    on observation items is in Table 1. Kathmandu, the capital
tial distributions (Fig. 1 and Table 1), the APCC program
                                                                    city of Nepal, is characterized by rapid but uncontrolled ur-
includes eight stations from Nepal across the central Hi-
                                                                    ban growth and has severe air pollution problems. Pokhara,
malayas to Tibet (Lumbini, Kathmandu, Jomsom, Pokhara,
                                                                    a famous tourist city, has undergone rapid urbanization with
Dhunche, Nyalam, Zhongba, Everest), three stations in Pak-
                                                                    increased numbers of vehicles and industries. Lumbini, lo-
istan (Hunza, Mardan, Karachi), and two stations in the
                                                                    cated on the northern edge of the Indo-Gangetic Plain (IGP),
southeastern TP (Lulang, Yulong), all of which are dom-
                                                                    is a typical rural site located in a mixed setting with a large
inantly influenced by the Indian monsoon. There are 12
                                                                    number of agricultural and industrial activities. Dhunche is
sites (Dushanbe, Toshkent, Bishkek, Jimunai, Koktokay,
                                                                    a small town situated in the Langtang National Park in the
Tianshan, Koxkar, Muztagh Ata, Ngari, Laohugou, Qilian,
                                                                    Rusuwa District in the foothills of the Himalayan Mountains;
Beiluhe) distributed in Central Asia, the Xinjiang Uygur Au-
                                                                    it is approximately 50 km north of Kathmandu. Jomsom is a
tonomous Region (China), and the western and northern TP,

Earth Syst. Sci. Data, 14, 683–707, 2022                                              https://doi.org/10.5194/essd-14-683-2022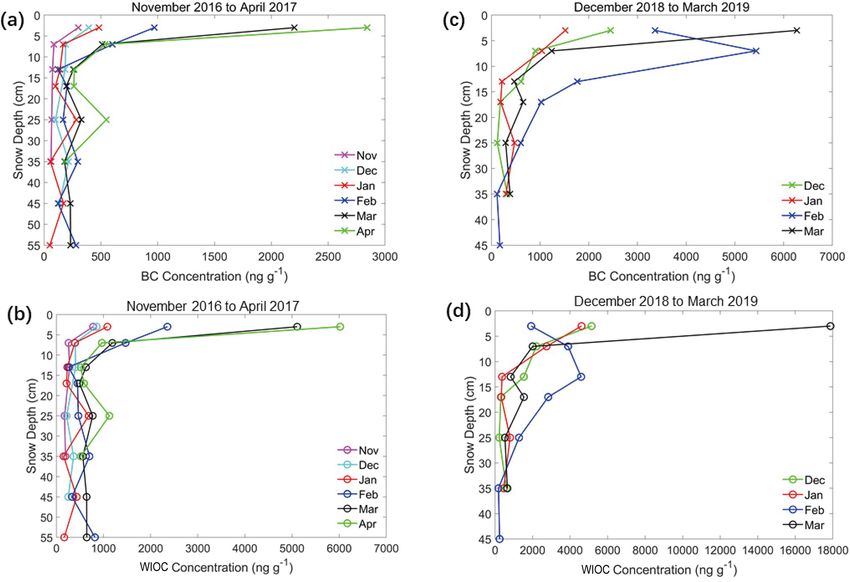
S. Kang et al.: Black carbon and organic carbon dataset over the Third Pole 687
Table 1. Detailed geographic characteristics of the Atmospheric Pollution and Cryospheric Changes program observation stations across the
Tibetan Plateau and its surroundings in this paper.
Regions Abbreviations Full station name Latitude Longitude Elevation Observations
(◦ N) (◦ E) (m a.s.l.)
Altai Jimunai Altai Observation and Research Station of 46.843 88.133 997 Muz Taw glacier, aerosol
Cryospheric Science and Sustainable Development
(Jimunai, northern Xinjiang) (roof height: 2 m)
Koktokay Koktokay Snow Station, northern Xinjiang (roof 47.353 89.662 1379 Snow cover
height: 2 m)
Tianshan Tianshan Tianshan Glaciological Station, Xinjiang (roof 43.105 86.807 2100 Urumqi glacier no. 1, aerosol
height: 2 m)
Koxkar Koxkar (Tianshan), Xinjiang (roof height: 2 m) 41.813 80.17 3000 Koxkar glacier, aerosol
Tibetan Plateau Muztagh Ata Muztagh Ata Station for Westerly Environment Ob- 38.291 75.055 5725 Muztagh Ata glacier, aerosol
servation and Research, western Tibetan Plateau
(roof height: 2 m)
Ngari Ngari Station for Desert Environment Observation 33.392 79.701 4270 Anglong glacier, aerosol
and Research, western Tibetan Plateau (roof height:
2 m)
Laohugou Qilian Observation and Research Station of 39.429 96.556 4230 Laohugou glacier no. 12, snow
Cryosphere and Ecologic Environment, northern cover, aerosol
Tibetan Plateau (roof height: 2 m)
Qilian Qilian Alpine Ecology and Hydrology Research 38.25 99.8667 3040 Precipitation
Station, northern Tibetan Plateau
Beiluhe Beiluhe Observation and Research Station on 35.428 92.556 4000 Aerosol
Frozen Soil Engineering and Environment in
Qinghai–Tibet Plateau (roof height: 2 m)
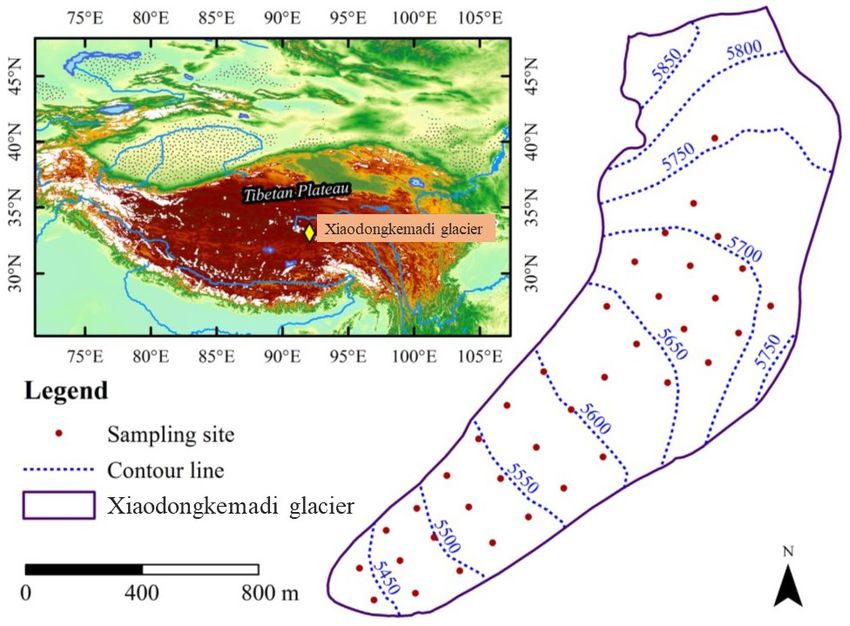
Tanggula Tanggula Cryosphere and Environment Observa- 33.083 92.067 5000 Xiaodongkemadi glacier and
tion Station, central Tibetan Plateau Ganglongjiama glacier
Nam Co Nam Co Station for Multisphere Observation and 30.779 90.991 4730 Zhadang glacier, snow cover,
Research, southern Tibetan Plateau (roof height: aerosol, precipitation
2 m)
Zhongba Zhongba, southern Tibetan Plateau (roof height: 29.7 83.983 4704 Aerosol
2 m)
Nyalam Nyalam, southern Tibetan Plateau (roof height: 2 m) 28.167 85.983 4166 Aerosol
Everest Qomolangma Atmospheric and Environmental Ob- 28.35 86.933 4276 East Rongbuk glacier, aerosol,
servation and Research Station (Everest), Hi- precipitation
malayas (roof height: 2 m)
Lulang South-East Tibetan Plateau Station for Integrated 29.767 94.733 3326 Aerosol, precipitation, Demula
Observation and Research of Alpine Environment glacier, Yarlong glacier, Ren-
(Lulang), southeastern Tibetan Plateau (roof height: longba glacier, and Dongga
2 m) glacier
Yulong Yulong Snow Mountain Glacial and Environmental 27.167 100.167 2650 Baishui glacier no. 1, aerosol,
Observation and Research Station, southeastern Ti- precipitation
betan Plateau (roof height: 2 m)
Related cities Lanzhou Lanzhou city, Gansu Province (roof height: 25 m) 36.05 103.859 1520 Aerosol
Lhasa Lhasa city, Xizang (Tibet) Autonomous Region 29.633 91.3 3642 Aerosol, precipitation
(roof height: 15 m)
Nepal Dhunche Dhunche (roof height: 3 m) 28.117 85.3 2051 Aerosol
Pokhara Pokhara (roof height: 6 m) 28.183 83.983 813 Aerosol
Jomsom Jomsom (roof height: 3 m) 28.767 83.717 3048 Aerosol
Kathmandu Kathmandu (roof height: 15 m) 27.683 85.4 1300 Aerosol
Lumbini Lumbini (roof height: 15 m) 27.483 83.283 100 Aerosol
Pakistan Karachi Karachi (roof height: 10 m) 24.85 66.983 13 Aerosol
Hunza Hunza (roof height: 3 m) 36.46 74.892 2519 Passu glacier, Gulkin glacier,
Barpu glacier, Mear glacier,
Sachin glacier, snow cover,
aerosol
Mardan Mardan (roof height: 10 m) 34.239 72.048 485 Aerosol
Central Asia Dushanbe Dushanbe (roof height: 3 m) 38.5588 68.8558 864 Aerosol
Toshkent Toshkent (roof height: 10 m) 41.2667 69.2167 821 Aerosol
Bishkek Bishkek (roof height: 2 m) 42.8833 74.7666 750 Aerosol
https://doi.org/10.5194/essd-14-683-2022 Earth Syst. Sci. Data, 14, 683–707, 2022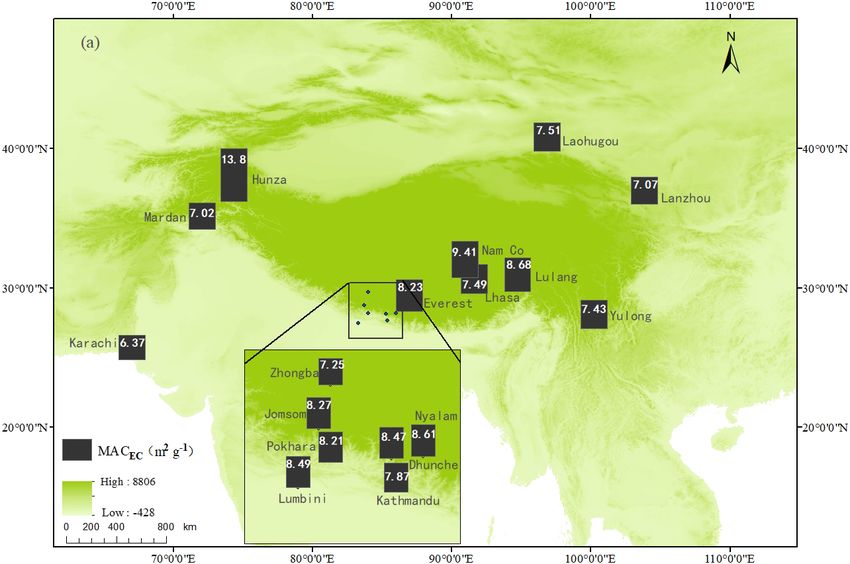
688                                              S. Kang et al.: Black carbon and organic carbon dataset over the Third Pole

semi-arid small town in the Mustang District, located in the       TP, a typical arid area covered by bare soil or grasslands.
Kali Gandaki River valley across the Himalayas.                    The Koxkar station is located on the southern slope of Mt.
   In Pakistan, three stations (namely Karachi, Mardan, and        Tomur, which is the highest peak in western Tianshan. Tian-
Hunza) are studied based on the APCC program (Gul et               shan Glaciological Station (Tianshan station) is located in
al., 2018). Karachi is the capital city of Sindh Province,         the upper reaches of the Urumqi River. Jimunai is located
with almost half of the domestic industries in this city. The      in northern Xinjiang, near the Altai Mountains.
sampling place is in the extreme southern portion, just a             Precipitation samples in this paper were collected from six
few kilometers away from the Arabian Sea. Mardan, lo-              stations (Fig. 1), namely the upper Heihe River basin (Qil-
cated near Peshawar city, is the second-largest city in Khy-       ian), Nam Co, Everest, Lulang, Yulong, and Lhasa city (Gao
ber Pakhtunkhwa Province. The sampling locations are 10 to         et al., 2021b; Li et al., 2018b; Niu et al., 2019). The upper
15 km away towards the northern side of central Mardan city.       Heihe River basin is a typical permafrost basin, located in
Hunza is situated in a valley of Gilgit-Baltistan, on the north-   the Qilian Mountains of the northern TP (Chen et al., 2014).
ern edge of Pakistan, sharing borders with the Wakhan Cor-         The other five stations have been described in the previous
ridor of Afghanistan and Xinjiang Province of China. The           paragraphs.
sampling location is at the terminus of Passu glacier and very
close to Gulkin glacier.                                           2.3   Glaciers
   In the Central Asian countries, three stations were selected
and set up for the aerosol studies. Dushanbe is the capital city   Carbonaceous data from a total of 17 glaciers are pro-
of Tajikistan. The aerosol sample collection is performed at       vided in this paper (Table 2, Fig. 1). There are 11 glaciers
the Physical Technical Institute of the Academy of Sciences        located in the Indian-monsoon-dominated region. Among
of Tajikistan, which is located in an urban environment on a       them, Baishui glacier no. 1 of Yulong Snow Mountain and
hill in the eastern part of Dushanbe. Toshkent Shahri is the       the other four glaciers (namely Demula, Renlongba, Yarlong,
capital city of Uzbekistan, located in the eastern part of the     Dongga) are located in the southeastern TP (Niu et al., 2018a;
country and between the Tianshan Mountains and the Syr             Zhang et al., 2017a), and the East Rongbuk glacier is located
River. Bishkek is the capital of Kyrgyzstan, at the foot of        in the central Himalayas on the northern slope of Mt. Ever-
the Alatao Mountains in the north of the country and in the        est. In the inland TP, three glaciers are observed and studied.
central Chu River basin. All of these sites are located in the     The Zhadang glacier, with an area of 2.0 km2 and a length of
arid and semi-arid regions with a dry continental climate.         2.2 km, is located on the northeastern slope of the Nyainqen-
   There are 18 stations (Lanzhou, Lhasa, Everest, Zhongba,        tanglha mountain range (X. Li et al., 2018). The Xiaodongke-
Nyalam, Lulang, Yulong, Nam Co, Tanggula, Beiluhe, Qil-            madi glacier, with an area of approximately 1.60 km2 and
ian, Laohugou, Ngari, Muztagh Ata, Koxkar, Tianshan, Kok-          facing southwest, is located at the headwaters of the Dongke-
tokay, and Jimunai) continuously observed over the TP and          madi River, a tributary at the upper reaches of the Buqu River
its surroundings within China. Lanzhou is the capital city         near the Tanggula Pass in the central TP (Gao et al., 2012;
of Gansu Province and is an important industrial base and          C. Li et al., 2017b). The Ganglongjiama glacier (also known
comprehensive transportation hub in northwestern China.            as Guoqu glacier) is located on the northern slope of Mt.
Lhasa, China’s highest-altitude city, is located on the banks      Geladaindong, the summit peak of the Tanggula Mountains
of the Lhasa River and serves as the capital of the Tibet          (Hu et al., 2020). Meanwhile, there are five glaciers studied
Autonomous Region. Everest, Zhongba, and Nyalam are lo-            in northern Pakistan. The Passu and Gulkin glaciers are lo-
cated on the northern side of the Himalayas, characterized by      cated very near the Karakoram highway connecting Pakistan
agriculture and yak husbandry and dominated by the Indian          with China. The Barpu and Mear glaciers are located very
monsoon. In particular, at the Qomolangma Atmospheric              close to each other and around 3 km away from the residen-
and Environmental Observation and Research Station of the          tial area of the Hopar and Nagar valleys, and Sachin glacier
Chinese Academy of Sciences (CAS) on the northern slope            is close to a small city (Astore) (Gul et al., 2018).
of Mt. Everest (Everest station), real-time data of equiva-           There are six glaciers monitored in the westerly-
lent BC concentrations (eBC; measured by the Aethalometer          dominated regions. The Laohugou glacier no. 12, a typical
model, AE-33) have been observed since May 2015 (Chen et           valley glacier, is located on the northern slope of the west-
al., 2018). Lulang is located in a sub-valley of the Yarlung       ern Qilian Mountains in the northern TP and covers an area
Tsangpo Grand Canyon, a corridor for the warm and hu-              of 21.9 km2 (Y. Li et al., 2019; Zhang et al., 2017b). The
mid Indian monsoon to penetrate the inland TP. Yulong, the         Muztagh Ata glacier has an area of ∼ 0.96 km2 and a length
southernmost glaciated mountain in the Eurasian continent,         of 1.8 km, located in the eastern Pamir Plateau (Yao et al.,
close to Lijiang city (Yunnan Province), may be affected by        2012). The Anglong glacier is located in the headwater re-
local emissions. Nam Co is a typical pastoral area in the in-      gion of Indus, covering an area of 1.5 km2 (Y. Chen et al.,
land TP. Beiluhe is located to the east of Kekexili of the in-     2021). The Koxkar glacier (also named Keqikaer glacier)
land TP. Laohugou is a remote hinterland site located in the       is located on the southern slope of Mt. Tomur, the high-
western Qilian Mountains. Ngari is located in the western          est peak in western Tianshan, on the border between China

Earth Syst. Sci. Data, 14, 683–707, 2022                                            https://doi.org/10.5194/essd-14-683-2022
S. Kang et al.: Black carbon and organic carbon dataset over the Third Pole                                                                                                 689

Table 2. Detailed information for the observed glaciers based on the Atmospheric Pollution and Cryospheric Changes program across the
Third Pole.

      Regions                                Mountains                                Glacier name                                          Latitude           Longitude
      Southeastern Tibetan Plateau           Hengduanshan                             Baishui glacier no. 1                                 27.17◦ N           100.15◦ E
      Southeastern Tibetan Plateau           Nyainqentanglha Mountains                Demula glacier, Renlongba glacier,                    29.355◦ N          97.02◦ E
                                                                                      Yarlong glacier, and Dongga glacier
      Himalayas                              Mt. Everest, Himalayas                   East Rongbuk glacier                                  28.031◦ N          86.961◦ E
      Inland Tibetan Plateau                 Nyainqentanglha Mountains                Zhadang glacier                                       30.467◦ N          90.633◦ E
      Inland Tibetan Plateau                 Tanggulha Mountains                      Xiaodongkemadi glacier                                33.067◦ N          92.067◦ E
      Inland Tibetan Plateau                 Tanggulha Mountains                      Ganglongjiama glacier (Guoqu glacier)                 33.833◦ N          91.683◦ E
      Northern Tibetan Plateau               Qilian Mountains                         Laohugou glacier no. 12                               39.44◦ N           96.542◦ E
      Western Tibetan Plateau                Mt. Anglonggangri, Ngari                 Anglong glacier                                       32.849◦ N          80.932◦ E
      Tianshan                               Western Tianshan                         Koxkar glacier                                        41.813◦ N          80.17◦ E
      Tianshan                               Eastern Tianshan                         Urumqi glacier no. 1                                  43.1142◦ N         86.811◦ E
      Northern Xinjiang                      Sawir Mountains                          Muz Taw glacier                                       47.06◦ N           85.56◦ E
      Eastern Pamir Plateau                  Mt. Muztagh                              Muztagh Ata glacier                                   38.283◦ N          75.067◦ E
      Northern Pakistan                      Karakoram and Himalayas                  Passu glacier                                         36.45◦ N           74.85◦ E
      Northern Pakistan                      Karakoram and Himalayas                  Gulkin glacier                                        36.42◦ N           74.77◦ E
      Northern Pakistan                      Karakoram and Himalayas                  Barpu glacier                                         36.18◦ N           74.08◦ E
      Northern Pakistan                      Karakoram and Himalayas                  Mear glacier                                          36.15◦ N           74.82◦ E
      Northern Pakistan                      Karakoram and Himalayas                  Sachin glacier                                        35.32◦ N           74.76◦ E
  Note: an ice core with a depth of 108 m was collected from the col of the East Rongbuk glacier (28.03◦ N, 86.96◦ E; 6518 m a.s.l.) located on the northeastern ridge of Mt.
  Everest; an ice core with a depth of 147 m was collected from the upper basin of the Ganglongjiama glacier (Guoqu glacier; 33.58◦ N, 91.18◦ E; 5750 m a.s.l.) on the northern
  slope of Mt. Geladaindong.

and Kyrgyzstan (Zhang et al., 2017c). The Urumqi glacier                                    and semi-shade and by grassland and shrubs on the sunny
no. 1 is located at the headwater of the Urumqi River in east-                              and semi-sunny slopes (Zhang et al., 2016). The lowest air
ern Tianshan, which is surrounded by the Taklimakan Desert                                  temperature is below −45 ◦ C in winter. Average annual max-
to the south, the Gurbantungut Desert to the north, and the                                 imum snow depth exceeds 1 m (Zhang et al., 2014). Floods
Gobi Desert to the east. This glacier has an area of 1.65 km2                               in the river basin are due to rain-on-snow events, originating
(50 % of the basin) (X. Li et al., 2019). The Muz Taw glacier                               from the combination of rapidly melting snow and intense
is located on the northern slope of the Sawir Mountains in                                  precipitation. There were 27 sampling locations for snow
northern Xinjiang, south of the Ertix River in Central Asia                                 cover sampling distributed in the southern TP, 10 locations in
(Y. Zhang et al., 2020).                                                                    the central TP, and 10 locations from one glacial river basin
   There are two ice cores retrieved from the East Rong-                                    (Laohugou region in the northern TP) (Zhang et al., 2018b).
buk glacier (Mt. Everest region) and the Ganglongjiama                                      There were 91 surveyed locations distributed across northern
(Mt. Geladaindong region) glacier, respectively (Jenkins et                                 Xinjiang. Among them, 11 sampling locations were selected
al., 2016; Kaspari et al., 2011; Zhang et al., 2015) (Fig. 1).                              during the whole snow season, including 5 locations in the
                                                                                            southern Altai Mountains, 3 locations on the western side of
                                                                                            the Junggar Basin, and 3 locations in the northern Tianshan
2.4     Snow cover
                                                                                            Mountains (Zhong et al., 2019).
Snow cover samples were collected from 2 stations (the Lao-
hugou and Koktokay) (Fig. 1) and 138 snow survey loca-                                      2.5     Sediment cores from the lakes
tions once in the TP and the northern Xinjiang (Zhang et
al., 2018a; Zhong et al., 2019, 2021). The Koktokay Snow                                    Lake sediment cores were studied from seven lakes dis-
Station at the headwater of the Irtysh River is selected as                                 tributed across the Himalayas and TP (Cong et al., 2013;
the fixed-point site, which is located in the Kayiertesi River                              Neupane et al., 2019) (Table 3, Fig. 1). Gosainkunda Lake
basin, the first tributary of the Irtysh River. The Kayiertesi                              and Gokyo Lake are located on the southern slope of the
River basin is in the southern Altai Mountains in China, cov-                               Nepalese Himalayas. Qiangyong Lake and Ranwu Lake are
ering 2365 km2 . Seasonally frozen soil and permafrost are                                  located in the southern and southeastern TP, respectively.
widely spread in the basin, and the basin is rich in vegetation                             Nam Co Lake, Lingge Co Lake, and Tanggula Lake are lo-
(39.2 % vegetation coverage in 2014) (Zhang et al., 2016).                                  cated in the inland TP. Riverine BC inputs to the Qiangyong
The land surface is generally covered by forest in the shade                                and Ranwu lakes were controlled by the surrounding snow

https://doi.org/10.5194/essd-14-683-2022                                                                            Earth Syst. Sci. Data, 14, 683–707, 2022
690                                                    S. Kang et al.: Black carbon and organic carbon dataset over the Third Pole

Table 3. Detailed information for the lake sediment cores across the        observed by automatic weather stations (Fig. 2). Generally,
Third Pole in this paper.                                                   for glacier surface snow and ice sampling, different types
                                                                            of snow and ice (fresh snow, aged snow, and granular ice)
 Regions           Lake name          Latitude    Longitude   Elevation     samples were collected across the ablation and accumulation
                                                               (m a.s.l.)
                                                                            zone of the entire glacier (Fig. 3). Whirl-Pak bags were used
 Tibetan Plateau   Ranwu Lake         29.441◦ N   96.796◦ E        3800     to collect surface snow samples from the upper 0–10 cm (or
                   Qiangyong Lake     28.89◦ N    90.226◦ E        4866
                   Nam Co Lake        30.779◦ N   90.991◦ E        4730     0–5 cm) of depth (approximately 2 L, unmelted) as well as
                   Tanggula Lake      32.903◦ N   91.953◦ E        5152     surface granular ice samples. In general, the snow pit sam-
                   Lingge Co Lake     33.831◦ N   88.603◦ E        5051     ples were collected at the accumulation zone of glaciers us-
 Nepal             Gokyo Lake         27.951◦ N   86.69◦ E         4750     ing a stainless-steel spoon with a vertical depth interval of 5,
                   Gosainkunda Lake   28.095◦ N   85.65◦ E         4390     10, or 15 cm and transferred into a Whirl-Pak bag, follow-
                                                                            ing the protocol described by Kang et al. (2007). Generally,
                                                                            duplicate samples were collected to evaluate the differences
cover and glacier meltwater. All the above lakes are located                between sampling. In situ observations included snow thick-
far from areas with large amounts of anthropogenic activity.                ness, density, grain size, and surface albedo, which are used
                                                                            to estimate the post-deposition processes, chemicals flux, and
                                                                            effect of BC on glacier melt.
3     Sampling in the field
                                                                               In field surveys across the northern, eastern, and south-
3.1    Atmospheric aerosol and precipitation sampling                       ern TP and northern Xinjiang (Zhang et al., 2018b; Zhong
                                                                            et al., 2019), snow depth, snow density, snow grain size, and
In this study, carbonaceous data (elemental carbon, EC; OC;                 surface albedo were observed, and snow cover samples were
WSOC) from atmospheric aerosols (total suspended partic-                    collected. At each sampling location, snow samples were col-
ulates, TSPs) were collected and reported from 19 stations                  lected from the top 5 cm of the snowpack and stored in a
based on the APCC program, distributed in the TP, Southeast                 Whirl-Pak bag. The vertical resolution of the snow pit pro-
Asia, and Central Asia. Generally, the TSPs were collected                  file at Koktokay Snow Station was 5 cm intervals from the
on pre-combusted (550 ◦ C, 6 h) quartz fiber filters (90 mm in              snow surface to a depth of 20 cm; then samples were col-
diameter, with pore size of 2.2 µm, Whatman) with a TSP                     lected every 10 cm from a depth of 20 cm to the bottom. Dur-
cyclone at a flow rate of 100 L min−1 for 24 h (urban or rural              ing the snow accumulation period (November) and the stable
sites) or 48 h (remote sites) (P. Chen et al., 2019). The TSP               period (from December through early March), snow pit sam-
sampler was set up on the roof of the observation building                  ples were collected three times a month at 10:00 (UTC/GMT
to avoid the effects of ground dust (Fig. 2). After sampling,               +8.00, the same below). During the intense snowmelt period
the filters were kept frozen until analysis. TSP samples were               (from early or mid-March to early April), snow samples were
collected every 6 d to bypass the “weekend effect”, which in-               collected twice a day at 10:00 and 19:00, respectively. Snow
dicated that the weekly cycle of aerosol composite (with low                cover samples for analyses of WSOC were directly collected
values on weekends and high values on weekdays) was usu-                    into the square polycarbonate bottles (Zhang et al., 2019).
ally governed by the anthropogenic emissions (Satheesh et                   The samples were kept frozen until they were melted and fil-
al., 2011). These quartz filters will be used for measurement               tered in the laboratory.
of EC, OC, and WSOC from the aerosols.                                         In this paper, historical rBC records from two ice cores
   When precipitation occurred, wet deposition samples were                 were reported. In 2002, a 108 m ice core was collected from
collected by an automated precipitation collector for the anal-             the col of the East Rongbuk glacier located on the northeast-
ysis of BC and WIOC. After the precipitation event, the pre-                ern ridge of Mt. Everest on the northern slope of the Hi-
cipitation amount was also recorded, and the samples were                   malayas (Kaspari et al., 2011). In 2016, a shallow ice core
transferred into high-density polyethylene bottles (250 mL)                 (8 m length) was drilled by the team from the same glacier to
and kept frozen until analysis. Samples of WSOC were col-                   expand rBC records since 2000. In November 2005, a 147 m
lected in prebaked aluminum basins (450 ◦ C, 6 h) that were                 ice core was collected from the upper basin of the Gang-
placed on a 1.5 m high platform (Li et al., 2016b, c, 2018b,                longjiama glacier (Guoqu glacier) on the northern slope of
2021; Niu et al., 2019). Due to limitations in the volume                   Mt. Geladaindong using an electro-mechanical drill (Jenkins
of samples collected during small precipitation events, only                et al., 2016; Zhang et al., 2015). The drilled ice cores were
those with a large enough volume of sample were selected to                 packed in polyethylene tubing in the field, transported frozen
determine 114 C and δ 13 C.                                                 to the State Key Laboratory of Cryospheric Science, Chinese
                                                                            Academy of Sciences, in Lanzhou, and kept in a cold room
3.2    Glaciers, snow cover, and ice core sampling
                                                                            at −20 ◦ C until sample preparation and analysis (Kang et al.,
                                                                            2015).
Surface snow and ice and snow pits were sampled from
glaciers, and meteorological variables in glacial regions were

Earth Syst. Sci. Data, 14, 683–707, 2022                                                     https://doi.org/10.5194/essd-14-683-2022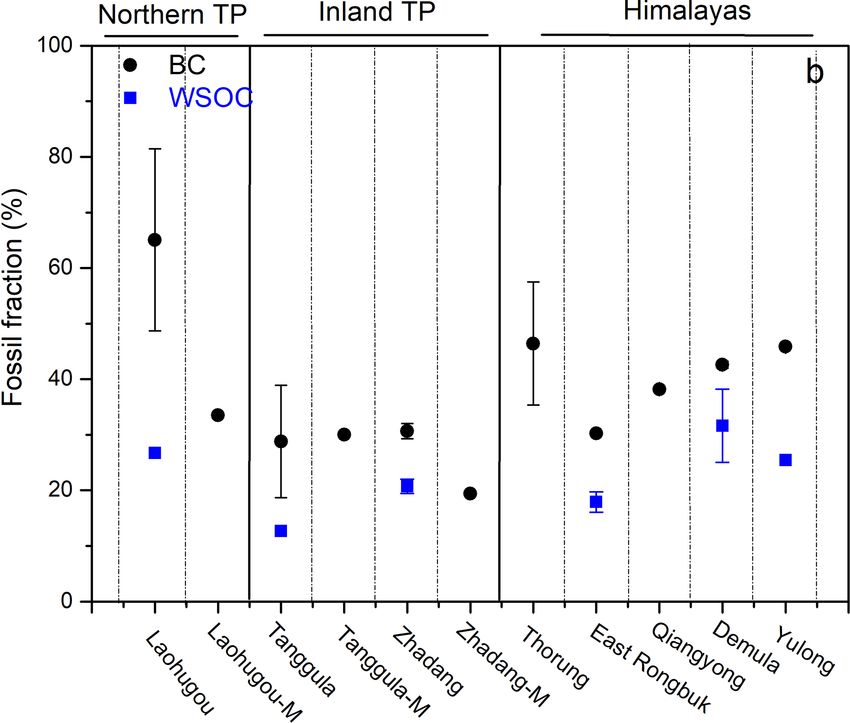
S. Kang et al.: Black carbon and organic carbon dataset over the Third Pole                                                    691

Figure 2. Photos of aerosol sampling, snow sampling, and ice core drilling on the Tibetan Plateau.

Figure 3. Black carbon and organic carbon data in surface snow and snow pit sampling sites from the Xiaodongkemadi glacier in the
Tanggula Mountains in the central Tibetan Plateau. Modified from X. Li et al. (2017).

https://doi.org/10.5194/essd-14-683-2022                                                   Earth Syst. Sci. Data, 14, 683–707, 2022
692                                              S. Kang et al.: Black carbon and organic carbon dataset over the Third Pole

3.3    Lake sediment core sampling

Lake sediment cores were drilled from the deep basin of the
studied lakes during 2008–2017 using a gravity coring sys-
tem with a 6 cm inner diameter polycarbonate tube (Cong et
al., 2013; Neupane et al., 2019). The core sediments were
sliced in the field at intervals of 0.5 cm, except for Lingge Co
Lake and Ranwu Lake, which were sliced at 1 cm intervals,
stored in plastic bags, and kept frozen until analysis.

4     Observations, measurement methods, and data
      descriptions

4.1    Real-time atmospheric BC observation using an
       Aethalometer                                                Figure 4. Daily mean BC aerosol concentrations at the Everest sta-
                                                                   tion (Mt. Everest region) measured by AE-33 from 15 May 2015
BC is an important part of atmospheric particulate aerosols        to 29 December 2019. Light-blue lines refer to daily data; the thick
and imposes adverse effects on atmospheric visibility, health,     blue lines represent the smoothing results.
and climate change (Ramanathan and Carmichael, 2008).
The eBC is operationally defined as the amount of strongly
light-absorbing carbon with the approximate optical proper-        northwesterly winds in the lower atmosphere and then further
ties of carbon soot that would give the same signal in an opti-    transported across the Himalayas by mountain valley winds
cal instrument (e.g., Aethalometer) (Andreae and Gelencsér,        (Cong et al., 2015). Simulations further indicated that the BC
2006). At the Everest station, a real-time optical instrument      aerosols in South Asia could be uplifted and transported to
(Aethalometer model AE-33, Magee Scientific Corporation,           the Mt. Everest region by the southerly winds in the upper at-
USA) for measurement of eBC from atmospheric aerosols              mosphere in the monsoon season (Chen et al., 2018). The re-
was operated with an inlet installed at approximately 3 m          sults indicated that the seasonal cycle of BC was significantly
above the ground level since March 2015. The airflow rate          influenced by the atmospheric circulation and combustion
was operated at 4 L min−1 . The eBC concentrations can be          intensity in the Mt. Everest region. Meanwhile, there were
acquired according to the light absorption and attenuation         continuously high concentrations of eBC above 1000 ng m−3
characteristics from the seven fixed wavelengths (e.g., 370,       during 8–10 June 2015, 19–22 March 2016, 9–30 April 2016,
470, 520, 590, 660, 880, and 950 nm) (Chen et al., 2018; Dri-      and 11–14 April 2017, indicating that the heavy-pollution
novec et al., 2015). In general, the eBC concentration mea-        episodes occurred at Mt. Everest during those days (Chen
sured at 880 nm is used as the BC concentration in the at-         et al., 2018).
mosphere as the absorption of other types of aerosols (e.g.,
OC and dust) is greatly reduced at this wavelength (San-
                                                                   4.2   Analysis methods and data of atmospheric aerosol
dradewi et al., 2008). When calculating eBC concentrations,
                                                                         EC and OC
it is therefore possible to eliminate the “loading effect” with
the loading compensation parameter k, which allows extrap-         After the TSP sampling, the aerosol EC and OC concen-
olation to zero loading, and the accurate ambient BC concen-       trations were measured by a thermal-optical carbon ana-
tration is obtained (Drinovec et al., 2015). Previous studies      lyzer (Desert Research Institute DRI Model 2001 or Sun-
have evaluated the real-time compensation algorithm of the         set Lab) (P. Chen et al., 2019). In detail, for the aerosol
dual-spot Aethalometer model AE-33 and indicated that the          samples (TSP quartz filters), a punch of sample (with a fil-
AE-33 agreed well with the post-processed loading-effect-          ter area of 0.5 cm2 ) was put in a quartz boat inside the
compensated data obtained using earlier Aethalometer mod-          analyzer and heated stepwise at the different temperature
els and other filter-based absorption photometers (Chen et al.,    plateaus (IMPROVE_A temperature protocol with an op-
2018; Drinovec et al., 2015).                                      tical reflectance correction for sample charring) (Chow et
    At the Everest station, daily and monthly mean eBC             al., 2007). The IMPROVE_A temperature protocol defined
concentrations presented strong seasonal variations during         temperature plateaus for thermally derived carbon fractions
2015–2019, which showed the highest values in the pre-             of 140 ◦ C for OC1, 280 ◦ C for OC2, 480 ◦ C for OC3, and
monsoon season (∼ 923 ng m−3 in April) and the lowest val-         580 ◦ C for OC4 in a helium (He) carrier gas and 580 ◦ C for
ues in the monsoon season (∼ 88.5 ng m−3 in July) (APCC            EC1, 740 ◦ C for EC2, and 840 ◦ C for EC3 in a 98 % He/2 %
dataset I-1 and Fig. 4). In the pre-monsoon season, BC from        oxygen (O2 ) carrier gas. Each carbon fraction reported to
the Indo-Gangetic Plain (IGP) region can be transported and        the IMPROVE_A network database consisted of a value and
concentrated on the southern slope of the Himalayas by the         a precision. The aerosol OC and EC by thermal-optical re-

Earth Syst. Sci. Data, 14, 683–707, 2022                                              https://doi.org/10.5194/essd-14-683-2022
S. Kang et al.: Black carbon and organic carbon dataset over the Third Pole 693
flectance (TOR) were sensitive to the change in such tem- spatio-temporal variations in carbonaceous particles over
perature protocol. Therefore, EC, OC, and total carbon (TC) the vast Third Pole region, which was of great importance
were calculated from the eight carbon fractions as for scientific communities worldwide. Furthermore, these
datasets were critical for further scientific studies in the
OC = OC1 + OC2 + OC3 + OC4 + OP (1) future on the atmospheric environment across this sentinel
EC = EC1 + EC2 + EC3 − OP (2) region.
TC = OC + EC, (3)
4.3 Mass absorption cross section (MAC) of aerosol EC
where OP in the equation represented pyrolyzed OC, which and WSOC from atmospheric aerosols
was defined as the carbon evolving between the introduc-
tion of oxygen in the helium atmosphere and the return of The optical attenuation (ATN) can be calculated based on the
reflectance to its initial values (the OC–EC split) (Chow et transmittance signal with Eq. (4) (Cheng et al., 2011):
al., 2005). The accuracy of the measurement was ±10 %, and
Tfinal
the detection limits for OC, EC, and TC were 0.43, 0.12, and ATN = ln , (4)
0.49 µg C cm−2 , respectively (P. Chen et al., 2019). Tinitial
Approximately 1000 samples from 19 different sta- where Tinitial and Tfinal are the transmittance signal before and
tions are analyzed in this paper (APCC dataset I-1). after the thermal-optical analysis, respectively. The ATN can
Annual average TC, EC, and OC distributions across be used to determine the absorption coefficient (babs ) based
the TP usually showed higher values in the urban and on Eq. (5):
rural stations and lower values in the remote stations,
which considerably decreased from outside to the in- A
babs = ATN × , (5)
land TP (P. Chen et al., 2019) (Fig. 5). The highest TC, V
EC, and OC values were found over urban areas (e.g.,
Kathmandu: OC = 34.8 µg m−3 , EC = 9.97 µg m−3 ; Mar- where A is the filter area (cm2 ), and V is the volume of air
dan: OC = 44.7 µg m−3 , EC = 11.7 µg m−3 ; Lanzhou: sampled (m3 ). Thus the MAC of EC (MACEC , m2 g−1 ) can
OC = 25.4 µg m−3 , EC = 6.7 µg m−3 ), indicating the be calculated as
impact from increased anthropogenic emissions. The babs ATN × A ATN
OC and EC concentrations at stations on the edge MACEC = = = × 102 , (6)
EC EC × V ECS
of the TP were much lower than those in cities
(e.g., Lulang: OC = 4.86 µg m−3 , EC = 0.7 µg m−3 ; where ECS (µg C m−2 ) is the filter loading of EC concentra-
Hunza: OC = 5.12 µg m−3 , EC = 0.78 µg m−3 ; Lao- tions. As multiple-scattering effects occur associated with the
hugou: OC = 4.81 µg m−3 , EC = 0.59 µg m−3 ) but filter-based measurement of absorption, they are corrected by
higher than those in the inland TP regions (e.g., an empirical factor of 3.6 (P. Chen et al., 2021) (Eq. 7):
Ngari: OC = 1.82 µg m−3 , EC = 031 µg m−3 ; Nam Co:
OC = 1.63 µg m−3 , EC = 0.13 µg m−3 ). Meanwhile, aerosol ATN 1
MACEC = × 102 × . (7)
TC, EC, and OC concentrations revealed apparent sea- ECS 3.6
sonality (Fig. 5). Higher concentrations were observed
over the South Asian stations (e.g., Lumbini located in the The light absorption spectra of WSOC were measured be-
northern IGP and Kathmandu valley), particularly during the tween wavelengths of 200 to 800 nm with a precision of 5 nm
pre-monsoon season, due to regional-scale pollution plumes bandwidth by a UV-visible spectrophotometer (SpectraMax
known as atmospheric brown clouds (Ramanathan et al., M5). The value of MACWSOC can be calculated from Eq. (8)
2007a). However, different seasonal patterns were observed (Bosch et al., 2014; Kirillova et al., 2014):
in the inland to northern TP. For example, at the Nam Co Ab
station, relatively high OC and EC concentrations occurred MACWSOC = × ln(10), (8)
C ×L
during the monsoon and post-monsoon. The regional dif-
ferences in CA seasonal variations suggested differences where Ab (absorbance) is derived directly from the spec-
in the pollutant sources and transport pathways. In Central trophotometer, L is the absorbing path length, and C is
Asia, the OC and EC concentrations demonstrated clear WSOC concentration.
seasonal variations, with elevated concentrations observed The MACEC at 632 nm exhibited significant spatial varia-
during August to February (P. Chen et al., 2021). These tions, differing by a factor of up to 2 with a clear increas-
results of different seasonal variations between southern and ing trend from the outside to the inland TP (Fig. 6). For
northern parts of the TP suggested differences in the patterns the studied stations, the annual MACEC ranged from 6.37
of pollutant sources and in distance from the sources to 8.49 m2 g−1 . Karachi had the lowest MACEC among the
between the regions (P. Chen et al., 2019). All of these stations. Other stations, including Mardan and Lanzhou, ex-
measurements have provided the basis for understanding the hibited a similar annual average MACBC of approximately
https://doi.org/10.5194/essd-14-683-2022 Earth Syst. Sci. Data, 14, 683–707, 2022694 S. Kang et al.: Black carbon and organic carbon dataset over the Third Pole
Figure 5. Aerosol OC and EC concentration distributions in the Tibetan Plateau and its surroundings (top) and temporal variations in OC
and EC concentrations at the Kathmandu and Nam Co station (bottom) during the observed periods, respectively. The abbreviations can be
found in Table 1.
7.0 m2 g−1 during the sampling period. On the southern MACEC values at remote sites were mostly attributed to the
side of the TP, stations (e.g., Dhunche, Jomsom, Everest, coating enhancement of BC aerosols (P. Chen et al., 2019).
Zhongba, Nyalam, Lulang) had moderate MACEC values, Aerosol MACWSOC was analyzed for 10 stations, includ-
which were slightly higher than those at urban sites but lower ing Kathmandu, Lumbini, Karachi, Jomsom, Lulang, Ever-
than in the inland remote regions (e.g., Nam Co, Hunza, est, Lhasa, Nam Co, Lanzhou, and Laohugou (Chen et al.,
Ngari, and Beiluhe). In the northern TP, Laohugou demon- 2020; Li et al., 2016b, c, 2021). Relatively higher MACWSOC
strated slightly lower MACEC , comparable to that in urban was observed in Lumbini, which had an annual average value
areas. The lower MACEC values in urban areas were mainly of 1.64 m2 g−1 . Kathmandu, Lanzhou, and Laohugou had
affected by local fresh emissions, while the relatively higher moderate values of approximately 1.30 m2 g−1 . Jomsom and
Karachi had relatively lower MACWSOC values of 0.97 and
Earth Syst. Sci. Data, 14, 683–707, 2022 https://doi.org/10.5194/essd-14-683-2022S. Kang et al.: Black carbon and organic carbon dataset over the Third Pole 695
Figure 6. Spatial distribution of mass absorption cross section of EC (MACEC ) (annual average value) on the Tibetan Plateau. Modified
from P. Chen et al. (2019).
0.87 m2 g−1 , respectively. The MACWSOC values were gen- optical carbon analyzer (Yang et al., 2015; Wang et al.,
erally higher in urban regions than those at remote stations, 2012). Specifically, the method was modified such that only
probably because of the larger primary and anthropogenic one temperature plateau (550 ◦ C) was used in the 100 % he-
contribution for WSOC in urban areas in contrast to remote lium atmosphere to reduce the time that the BC was ex-
regions (Chen et al., 2020). posed to the catalyzing atmosphere. The reported OC con-
centrations from the snow and ice samples accounted for
4.4 BC and WIOC from glaciers and snow cover only WIOC because most of the WSOC was not captured
by the filter-based method. The detection limit of the anal-
Before filtration, the frozen snow pit, surface snow, and snow ysis was 0.19 ± 0.13 µg TC cm−2 , and the filter blank was
cover samples were rapidly melted via a hot water bath (ap- 1.23 ± 0.38 µg TC cm−2 , which was about 1 order of mag-
proximately 20 min for complete melting), and the meltwa- nitude lower than the measured sample values (Zhang et al.,
ter (typically 0.5 to 1 L) was filtered through a pre-dried (in 2017a).
a desiccator at 550◦ C for 6 h) weighted quartz filter (What- The evaluated blank filters for total carbon were <
man, with pore size of 2.2 µm) using a vacuum pump (Zhang 1 µg cm−2 . For the same filter, multiple measurements
et al., 2017a, 2018b; Zhong et al., 2019, 2021). Samples were showed small relative standard deviations (RSDs; < 10 %),
filtered twice, and the filtration equipment was rinsed with ul- indicating that the data points tended to be close to the mean
trapure water twice (< 18.2 m) in order to prevent particle value, an acceptable filtration. The duplicate snow samples
loss. The estimated total uncertainty in the particle concen- demonstrated the similar concentrations of BC and WIOC.
trations was < 1 % (including background counts and ran- The evaluated impact of inorganic carbonates interfering
dom counting errors). with BC measurements showed that the carbonate acidifi-
After filtering the meltwater, the quartz filters were dried cation and analysis indicated acceptable data quality with a
and weighed gravimetrically, then analyzed for BC and discrepancy < 20 % (Zhang et al., 2017a).
WIOC. Generally, the dust loads in the snow and ice sam- According to the measurements, the average BC con-
ples were greater (approximately 2–3 orders of magnitude) centrations in glacier snow and ice ranged from several
than in the airborne aerosol samples. In order to eliminate nanograms per gram to hundreds of nanograms per gram,
the impact of dust, BC and WIOC were measured by a with marked differences between the glaciers (APCC dataset
modified IMPROVE_A protocol by a DRI model thermal-
https://doi.org/10.5194/essd-14-683-2022 Earth Syst. Sci. Data, 14, 683–707, 2022696 S. Kang et al.: Black carbon and organic carbon dataset over the Third Pole
Figure 7. BC and WSOC concentrations from studied glaciers distributed on the Tibetan Plateau and its surroundings.
I-2 and Fig. 7). In particular, BC concentrations in the aged precision, and average WSOC concentration of the blanks
snow and granular ice were usually much higher (1–2 or- were 0.015 mg L−1 , ±5 %, and 0.025 ± 0.006 mg L−1 , re-
ders of magnitude) than that in fresh snow, snow pits, and ice spectively, demonstrating that contamination was minimal
cores (Kang et al., 2020). Concentrations of BC and WIOC during the pre-treatment and analysis processing. WSOC
were higher in the central and northern TP than in the south- concentrations from glacier samples were lower in the snow
ern TP. There was large spatial variability in BC and WIOC pit and fresh snow but higher in the aged snow or granular ice
in snow cover across the TP and northern Xinjiang. Con- (Fig. 7). For the benchmark glaciers (Muz Taw glacier and
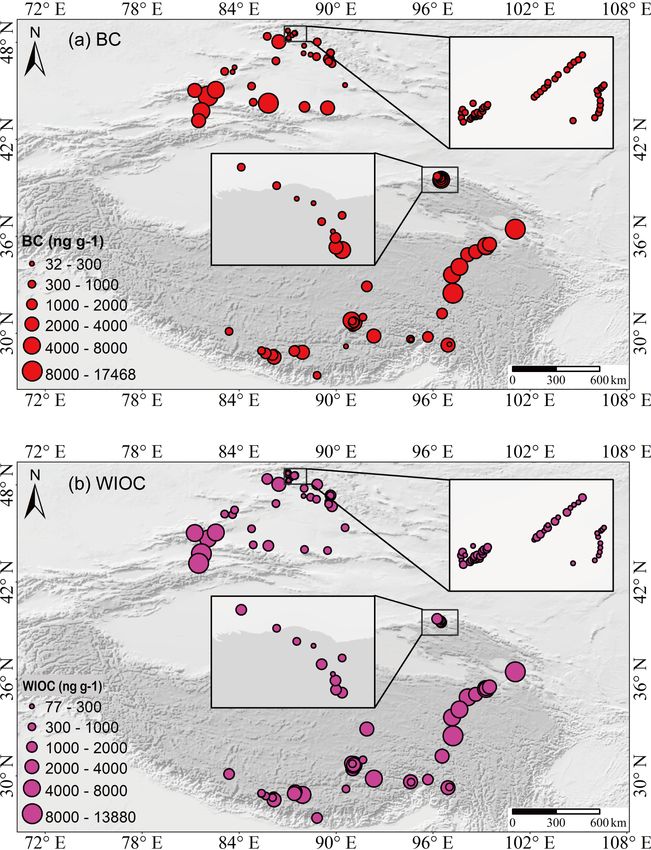
centrations of BC and WIOC in snow cover over the TP Laohugou glacier no. 12), the spatial distribution of WSOC
were 202–17 468 and 491–13 880 ng g−1 , respectively. The generally decreased with increasing elevation, indicating that
values of BC and WIOC in snow cover across northern Xin- more intense melting occurred in the lower-elevation ablation
jiang varied from 32 to 8841 and 77 to 8568 ng g−1 , re- zones exposed to higher concentrations of WSOC (Gao et al.,
spectively. Greater BC and WIOC concentrations in snow 2020; Hu et al., 2018).
cover appeared in the western areas (west of 83◦ E) than The light absorption spectra of the WSOC were mea-
other areas in northern Xinjiang (Fig. 8). Vertical variations sured with a UV-visible spectrophotometer (SpectraMax
in monthly mean BC and WIOC concentrations in the snow M5, Molecular Devices, USA) between the wavelengths
pit profiles showed that the maximum monthly mean BC and of 200 and 800 nm with an interval of 5 nm (Hu et al.,
WIOC concentrations generally appeared at the snow surface 2017; Yan et al., 2016). Each spectrum was determined
(302–6271 ng g−1 for BC and 780–17 877 ng g−1 for WIOC) relative to that of Milli-Q water. The MAC values for
(Fig. 9), suggesting that the magnitude of downward migra- WSOC in glaciers and snow cover samples were calculated
tion of BC and WIOC was much less than the enrichment in by Eq. (8). The MACWSOC from snow pits of Laohugou
surface snow for snow cover. glacier no. 12 and Ganglongjiama glacier (central TP) was
4.71 ± 3.68 and 2.17 ± 2.13 m2 g−1 , respectively (Hu et al.,
2018, 2020). MACWSOC from snow cover in the Altai Moun-
4.5 WSOC from glaciers and snow cover tains was 0.45 ± 0.35 m2 g−1 , with higher values in March
Before the measurement, the melted snow and ice samples and April 2017; the fraction of radiative forcing caused by
(collected using pre-cleaned 60 mL square-shaped polycar- WSOC relative to BC accounted for approximately 10.5 %,
bonate bottles) were filtered through a 0.45 µm (pore size) indicating that WSOC was a non-negligible light-absorber in
PTFE membrane filter (Macherey–Nagel). WSOC concen- snow of the Chinese Altai region (Zhang et al., 2019). The
trations were determined using a TOC-5000A analyzer (Shi- calculated MACWSOC from Baishui glacier no. 1 at Mt. Yu-
madzu Corp, Kyoto, Japan) (Hu et al., 2021; Yan et al., 2016; long was 6.31±0.34 m2 g−1 (Niu et al., 2018b). The compar-
Zhang et al., 2018a). The detection limit of the instrument, isons of MACWSOC from glaciers and snow cover revealed
Earth Syst. Sci. Data, 14, 683–707, 2022 https://doi.org/10.5194/essd-14-683-2022You can also read