Classification of atmospheric aerosols and clouds by use of dual-polarization lidar measurements
←
→
Page content transcription
If your browser does not render page correctly, please read the page content below
Research Article                                        Vol. 29, No. 15 / 19 July 2021 / Optics Express 23461

Classification of atmospheric aerosols and
clouds by use of dual-polarization lidar
measurements
S IQI Q I , 1,2 Z HONGWEI H UANG , 1,* X IAOJUN M A , 2,3 J IANPING
H UANG , 1 T IAN Z HOU , 1 S HUANG Z HANG , 1 Q INGQING D ONG , 1
J IANRONG B I , 1 AND J INSEN S HI 1
1 CollaborativeInnovation Center for West Ecological Safety (CIWES), College of Atmospheric Sciences,
Lanzhou University, Lanzhou, 73000, China
2 Department of Atmospheric and Oceanic Sciences & Institute of Atmospheric Sciences, Fudan University,
Shanghai, 200438, China
3 Innovation Center of Ocean-Atmosphere System Observation and Prediction, Zhuhai Fudan Innovation
Institute, Hengqin New Area, Zhuhai, Guangdong, China
* huangzhongwei@lzu.edu.cn

Abstract: Accurate identification of aerosols and cloud from remote sensing observations is
of importance for quantitatively evaluating their radiative forcing and related impacts. Even
though polarization lidar has exhibited a unique advantage of classifying atmospheric aerosols
and clouds over the past several decades, polarization measurements are often achieved at one
wavelength (UV or VIS) using laser remote sensing. To better identify the types of aerosols and
clouds, we developed a ground-based dual-polarization lidar system that can simultaneously
detect polarization measurements at wavelengths of 355 nm and 532 nm. Our results show that
the volume depolarization ratios (VDRs) at 355 nm and 532 nm markedly differ for typical types
of aerosols and clouds in the atmosphere. For non-spherical particles, the ratio of VDRs at
532 nm and 355 nm are 2.87 ± 1.35 for ice cloud and 1.51 ± 0.29 for dust-dominated aerosols,
respectively. However, for spherical particles, the ratios are 0.43 ± 0.26 for water cloud and
0.56 ± 0.05 for air pollutants. Consequently, we proposed a simple reliable method for classifying
atmospheric aerosols and clouds from polarization measurements observed by the developed
lidar system. The proposed method first distinguishes clouds from aerosols using a combination
of the color ratio (CR, 532 nm/355 nm) and attenuated backscattering coefficients (ABC) at 532
nm. Then, subtypes of clouds and aerosols are identified based on the ratio of VDRs at 532
nm and 355 nm. The results showed that dual-polarization lidar measurements can remarkably
improve the classification of atmospheric aerosols and clouds, compared with results using a
traditional method. This study illustrates that more information on atmospheric aerosols and
clouds can be obtained from polarization measurements at multiple wavelengths by active remote
sensing.

© 2021 Optical Society of America under the terms of the OSA Open Access Publishing Agreement

1.   Introduction
Previous studies have shown that aerosols and clouds play a significant role in regional and global
climate systems [1]. Aerosols can change the radiation balance of Earth’s atmospheric system by
scattering and absorbing shortwave and longwave radiation [2–5]. In addition, aerosols can act
as cloud condensation nuclei, consequently affecting the cloud occurrence and lifetime [6–9]
and changing the microphysics of clouds [10,11], which is related to the number, phase and
size of cloud droplets and ice crystals [12,13]. Clouds also have a strong modulation effect on
Earth’s radiation budget by reflecting solar radiation and absorbing longwave thermal emission
from Earth. For example, the net effect of boundary layer clouds is cooling the climate system

#430456                                                                      https://doi.org/10.1364/OE.430456
Journal © 2021           Received 10 May 2021; revised 26 Jun 2021; accepted 26 Jun 2021; published 9 Jul 2021
Research Article                                  Vol. 29, No. 15 / 19 July 2021 / Optics Express 23462

[14,15]. On the other hand, various aerosols, which mainly come from natural and anthropogenic
pollution processes, play different roles in the atmosphere. It has been proven that anthropogenic
aerosols can completely change the attribution of drought to meteorological variables by causing
large negative anomalies of surface temperature [16,17], effective energy and precipitation [18],
and also favor haze conditions in particular periods of the year [19].
   The influence of aerosols on atmospheric radiation depends on the spatial-temporal distribution
of their microphysical and chemical properties. In recent years, ground-based and spaceborne
lidar has been widely used in aerosol and cloud detection [20,21,22–29,30]. Reichardt et al.
[31] developed a Raman lidar for unattended, continuous multi-parameter atmospheric profile
measurements, which is used to observe water vapor, temperature, aerosols and clouds in the
atmosphere. Intrieri et al. [32]. determined the temporal distributions of cloudiness, the
vertical distribution of cloud boundary heights and the occurrence of the liquid phase in the
clouds with a combination of radar/lidar observations. Li et al. [33] analyzed the long-term
variation in the cloud droplet number concentrations (Nd ) from space-based lidar measurements,
indicating that the climatology of temperature-dependent Nd can reduce the uncertainties of
indirect effect estimations of aerosols in model simulations. Yorks et al. [34] analyzed the optical
property trends of ice clouds and liquid water clouds (altocumulus clouds) based on four-year
observations from a multi-wavelength polarization lidar. Ansmann et al. [35] studied several
pollution outbreaks in Europe during the Second Aerosol Characterization Experiment (ACE
2) in the summer of 1997 based on multi-wavelength lidar and sun photometer measurements.
Tesche et al. [36]. investigated the vertical distributions of Sahara dust in southern Morocco
by using Raman lidar and high-spectral-resolution lidar (HSRL). Using a combination of lidar
measurements of dust aerosols during three field activities, Zhou et al. [37] found that the
frequency of dust occurrence in Northwest China was higher than 88%, and the maximum height
of dust layers typically reached 7.8–9 km or higher. Moreover, numerous previous studies have
focused on lidar measurements of the vertical distributions of aerosols and clouds in China
[38–44]. Hu et al. [45] observed the characterization of Taklimakan dust (including polluted
dust) in Kashi using multi-wavelength polarization Raman lidar in April 2019. Sugimoto et
al. [46] observed fluorescence signals from dust aerosols and air pollutants in the atmosphere
using a lidar spectrometer with excitation wavelength of 355 nm. With the development of space
technology, increasing attention has been paid to spaceborne lidar in global aerosol research due
to its advantages of a wide detection range and high resolution [47,48]. More frequent summer
dust aerosol plumes over the Tibetan Plateau have been detected by the Cloud–Aerosol Lidar and
Infrared Pathfinder Satellite Observations (CALIPSO) lidar, showing that these dust eruptions
will affect the radiation balance of the atmosphere in the region [49]. Moreover, the vertical
distribution of aerosols and clouds in the atmosphere has been studied using four-year CALIPSO
observations in the Arctic [50].
   Classification of aerosols and clouds is the basis for investigating their effects on climate
systems and the environment. In recent decades, polarization lidar measurements have been
widely used to identify different aerosol and cloud types [51–58]. Many methods have been
proposed to classify and identify aerosols [59–61] and clouds [62–64]. Polarization lidar has
unique research capabilities in unambiguous cloud-phase discrimination and an almost ideal
sensitivity to cirrus clouds [65]. Liu et al. [66] introduced a three-dimensional algorithm for
distinguishing clouds and aerosols detected in a two-wavelength backscatter lidar profile by
using the layer-averaged attenuation backscatter at 532 nm, the layer-averaged color ratio (1064
nm/532 nm), and the middle layer height from the CALIPSO observation mission, consequently
improving the theoretical basis of the CALIPSO lidar cloud and aerosol discrimination (CAD)
algorithm [67]. Zhou et al. [68] identified dust aerosols by using the depolarization–attenuated
backscatter relationship from CALIPSO lidar observations. Wang and Sassen [69] distinguished
various atmospheric targets, such as ice and water clouds, virga, precipitation, and aerosols, based
Research Article                                     Vol. 29, No. 15 / 19 July 2021 / Optics Express 23463

on lidar measurements. Zhao et al. [70] proposed a new algorithm for aerosol and cloud detection
based on micro pulse lidar measurements. Veselovskii et al. [71] asserted that the calculation the
accuracy of microphysical parameters of bimodal particle size distribution from multi-wavelength
Mie-Raman lidar can reach 50%. Groß et al. [72] proposed that the combination of the lidar
ratio and particle linear depolarization ratio can be used to distinguish continental pollution
aerosols from other types of aerosols over Europe. Floutsi et al. [73] combined multi-wavelength
polarization Raman lidar observations with HYSPLIT backward trajectory analysis to identify
advection of biomass burning aerosols towards Punta Arenas. Burton et al. [74] identified aerosol
types by integrating the lidar ratio, backscatter color ratio and depolarization ratio from lidar
measurements. Moreover, the spectrum depolarization ratio of particles has also been reported
in the literature by Burton et al. [75]. For dust-dominated aerosols, the DR at 532 nm is greater
than that at 355 nm, but for smoke particles, the results are opposite [76]. Mishchenko et al. [77]
found that the linear depolarization ratio (LDR) measurement of spectral backscatter can indicate
the presence of smoke particles with complex morphology.
   To better identify the types of aerosols and clouds, we developed a ground-based dual-
polarization lidar system that can simultaneously detect polarization measurements at both 355
nm and 532 nm. In this study, a simple yet reliable method was proposed to distinguish the
different types of aerosols and clouds from dual-polarization lidar measurements. In Section
2, the developed lidar system is briefly introduced. The results and discussion are provided in
Section 3. Finally, the conclusion is given in Section 4.

2.   Lidar and observational data
A ground-based dual-polarization lidar system that simultaneously collected polarization measure-
ments at 532 nm and 355 nm was developed by Lanzhou University. A schematic diagram of the
developed lidar system is shown in Fig. 1. The system employs a flash-lamp-pumped Nd:YAG
laser to generate fundamental laser beam at wavelength of 1064 nm, then convert into a 532
nm source in second harmonic generation (SHG). Finally, 355 nm laser is generated combing
the remaining 1064 nm and newly created 532 nm lasers in third harmonic generation (THG).
After that the lidar system sends laser beams to the atmosphere simultaneously at wavelengths of
532 nm and 355 nm. The energy of a single pulse is ∼ 210 mJ (532 nm) and ∼80 mJ (355 nm),
and the pulse repetition rate and duration are 20 Hz and 8.7 ns, respectively. Then, backscatter
signals from atmospheric aerosols and clouds were collected by a receiving Schmidt-Cassegrain
telescope with a diameter of 350 mm, consequently separated by a dichroic mirror. The field of
view (FOV) of the system was 0.5 mrad. Polarization measurements at 532 nm and 355 nm were
detected simultaneously by using two polarizing beam splitters (PBS). Finally, signals in analog
and photon counting modes were simultaneously measured by Licel transient recorders and then
detected by four photomultiplier tubes (PMTs). The spatial resolution and temporal resolution of
the developed dual-polarization lidar system were 3.75 m and 2 min, respectively.
   The vertical structure of tropospheric aerosols and clouds was measured by the developed lidar
over northern China in Lanzhou (36.05 °N, 103.85 °E, 1493.1 m AGL) in March 2014 and Linze
(34.73 °N, 114.00 °E) in April 2014. The volume depolarization ratio (VDR) is defined by the
ratio of the parallel and perpendicular components of the backscattering signals, and the color
ratio (CR (532/355)) is defined by the ratio of the attenuated backscattering coefficients (ABC) at
532 nm and 355 nm. Lidar data corrections, such as background subtraction, range correction
and polarization calibration, were achieved in this study.
   The VDR is the total depolarization ratio of atmospheric molecules and particles, whose value
can be used to measure the physical properties of particles. It is a parameter of particle shape:
                                                  β⊥
                                           δ=C        ,                                                     (1)
                                                  β//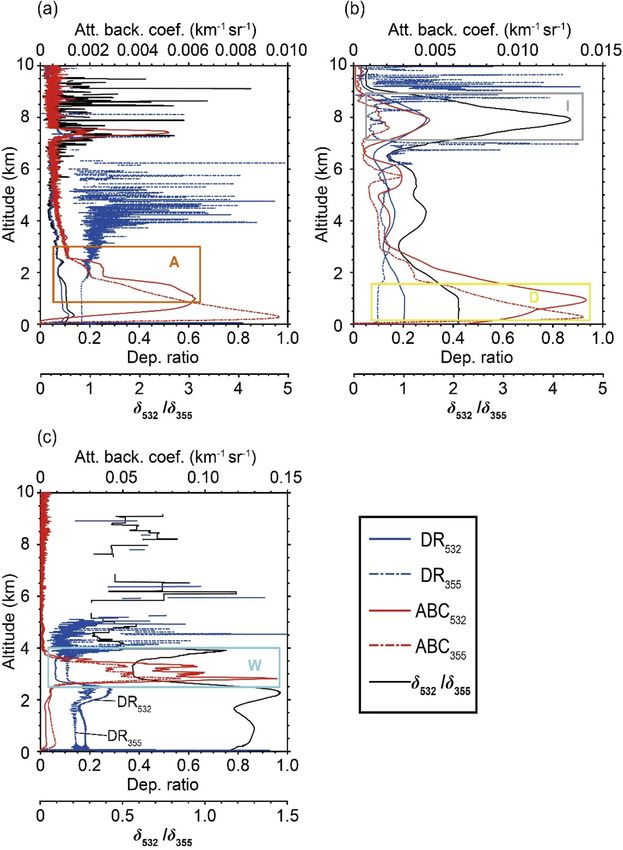
Research Article Vol. 29, No. 15 / 19 July 2021 / Optics Express 23464
Fig. 1. Schematic diagram of the developed dual-polarization lidar system used in this
study.
where β⊥ is the attenuated backscattering coefficient of the perpendicular channel and β// is the
attenuated backscattering coefficient of the parallel channel signal. C is the calibration factor of
polarization measurements. In this study, the ratio of VDRs (δ532 /δ355 ) is defined as a parameter
to distinguish aerosols and clouds.
Color ratio is a parameter relating to particle size, in which large color ratios corresponds to
coarse particle:
β532,⊥ + β532,//
χ= . (2)
β355,⊥ + β355,//
3. Results and discussion
Dust events originating from the Taklimakan Desert and Gobi Desert usually occur in East Asia
in late winter and spring. In March, 2014, there were dust-dominated aerosol events and haze
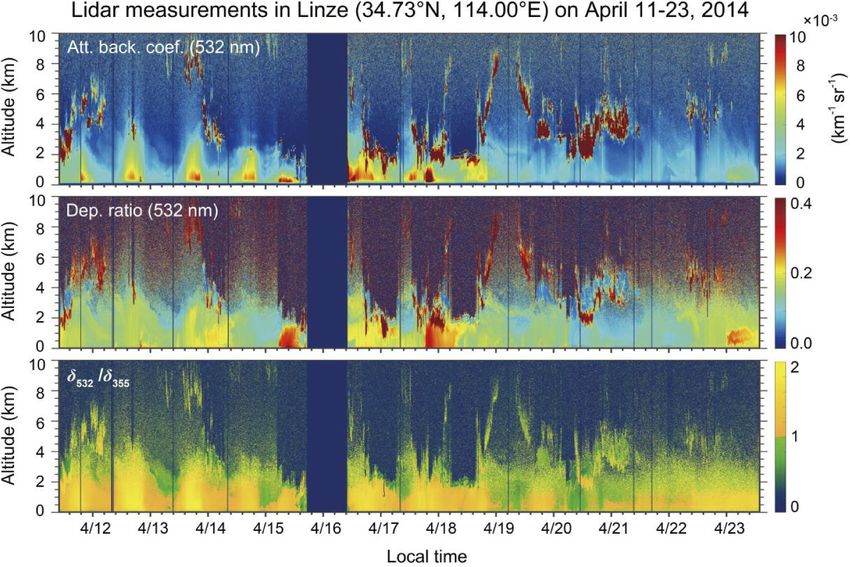
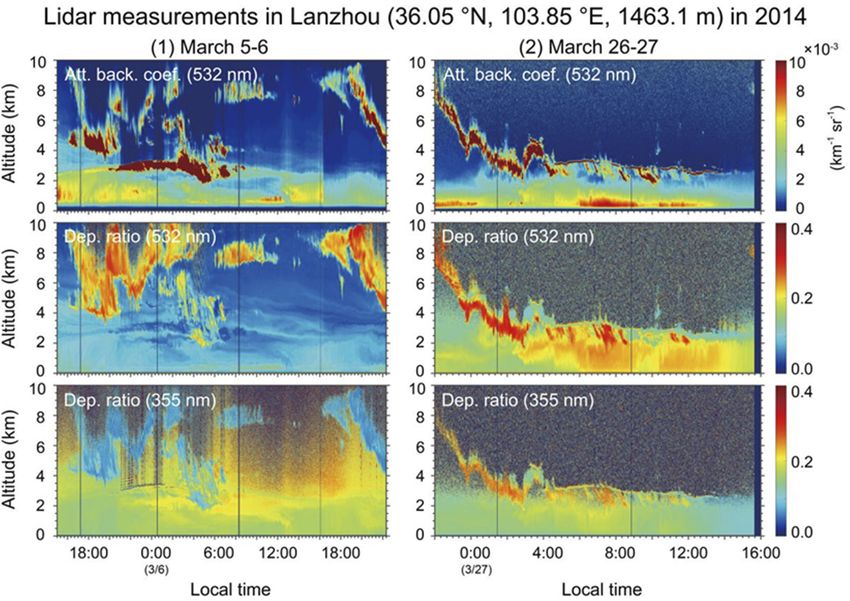
episodes in Lanzhou, China. Figure 2 shows the vertical structure of clouds and aerosols observed
by the developed dual-polarization lidar on March 5–6 and March 26–27. The results show that
there was a distinct air pollutant layer at 0–2 km in the afternoon on March 5–6. The ABCs of
the air pollutant layer were small with a low VDR (∼0.1) at 532 nm. However, the VDRs at
532 nm were much smaller than those at 355 nm in this layer. On March 26–27, we found a
dust layer at 0–2 km. The ABCs of the dust layer were small with a high VDR (∼0.24) at 532
nm. However, the VDRs at 355 nm were much smaller than those at 532 nm in this layer. This
phenomenon has been proven by other previous studies [75–77]. We also observed ice cloud
layers at approximately 6–9 km on March 5–6. For ice clouds, at 532 nm, the ABCs were stronger
and the VDRs were larger than the corresponding values of dust-dominated aerosols. However, it
is interesting that the VDRs at 355 nm were smaller than those at 532 nm, also indicating similar
results for ice clouds on other observed days in March and April. In addition, for water clouds,
the VDRs at 355 nm were larger than those at 532 nm. Therefore, we can confirm that aerosols
and clouds show different features on lidar measurements at UV and visible wavelengths, which
may be related to particle size.
To explore the differences in aerosol and cloud observation results at 532 nm and 355 nm, we
studied the relationship between the ABC, VDR and CR at wavelengths of 532 nm and 355 nm
for typical types of aerosols and clouds, such as air pollutants (A), dust-dominated aerosols(D),
water clouds (W), mixed phase clouds (MP) and ice clouds (I). Data sets of the five types were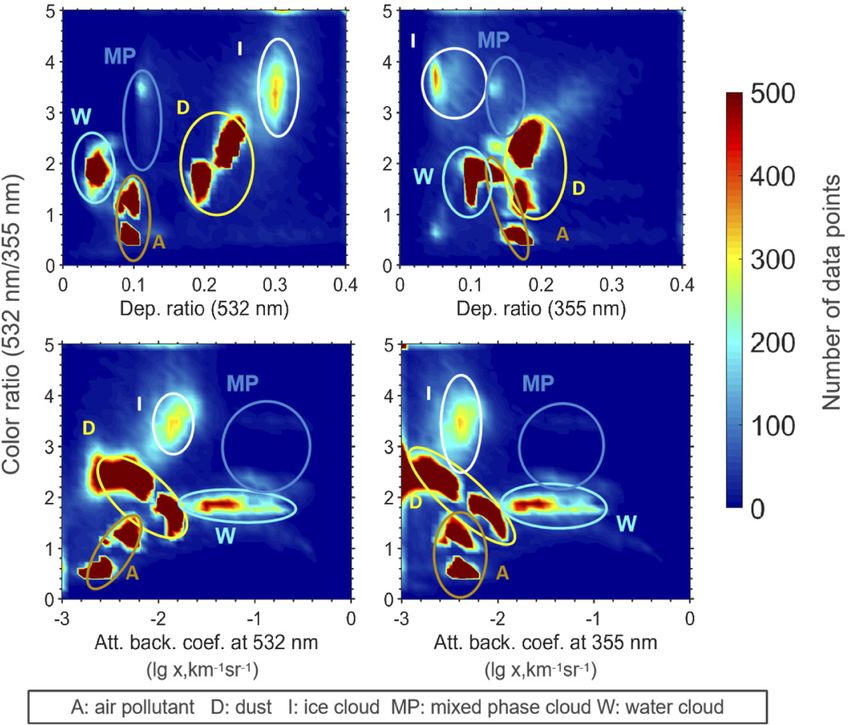
Research Article Vol. 29, No. 15 / 19 July 2021 / Optics Express 23465
Fig. 2. Vertical structure of atmospheric aerosols and clouds observed by the developed
lidar in Lanzhou (36.05°N, 103.85°E, 1493.1 m) on March 5–6 and March 26–27, 2014.
selected from polarization lidar measurements in March and April. The time and heights of the
aerosol and cloud layers are summarized in Table 1. The relationships between the ABC and
VDR at wavelengths of 532 nm and 355 nm for these five types are shown in Fig. 3. The results
show that for ice clouds and dust-dominated aerosols, the VDRs at 532 nm were larger than 0.18,
but those at 355 nm were smaller. Moreover, the VDR of ice cloud was the largest (smallest) at
532 (355) nm. In particular, the VDRs of water clouds and air pollutants were similar at both
532 nm and 355 nm, indicating that the VDR cannot be used to distinguish water clouds from air
pollutants. In addition, classification of the four types cannot be achieved according to the results
of the ABCs at 532 nm and 355 nm, even though they are slightly different.
The relationships between the CR (532/355), ABC and VDR at wavelengths of 532 nm and
355 nm for these five types are shown in Fig. 4. The CRs of ice clouds were the largest among
the five types. According to the results, the relationships between the CR (532/355) and VDR
at wavelengths of 532 nm and 355 nm did not show clear features for the four types. The
combination of CRs and the ABC at the wavelength of 532 nm can distinguish atmospheric
aerosols from clouds. The CRs of clouds are greater than 3.0, and the ABC at 532 nm is larger
than 0.015/km/sr. These thresholds could be used to successfully separate clouds and aerosols.
Finally, we compared the differences in VDRs at 532 nm and 355 nm for aerosols and clouds, as
shown in Fig. 5. The VDRs of non-spherical particles (ice clouds and dust-dominated aerosols)
at 532 nm are larger than those at 355 nm, but for spherical particles (water clouds and air
pollutants), the opposite is true.
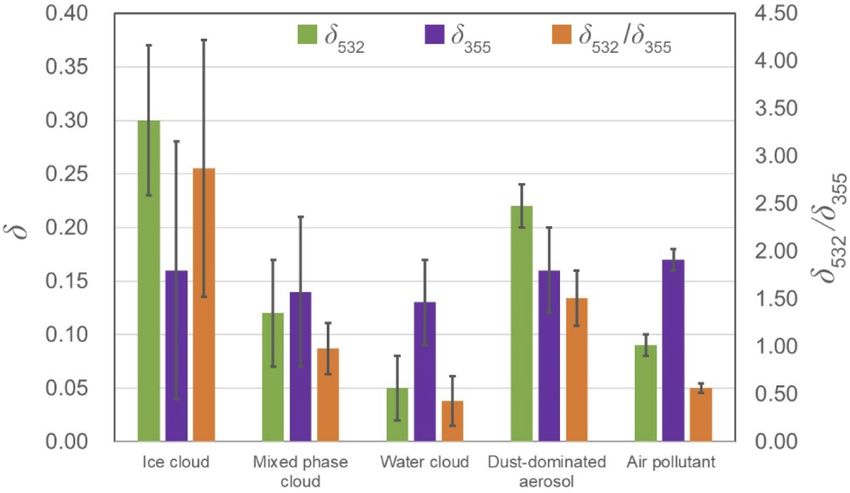
The mean values and standard deviations of the VDRs for the five types were calculated
and are provided in Fig. 6. We can see that for aerosols, the average VDR values at 532 nm
are 0.22 ± 0.02 for dust-dominated aerosols and 0.09 ± 0.01 for air pollutants, but these values
are 0.16 ± 0.04 for dust-dominated aerosols and 0.17 ± 0.01 for air pollutants at 355 nm. In
addition, for clouds, the average VDR values at 532 nm are 0.30 ± 0.07 (ice cloud), 0.05 ± 0.03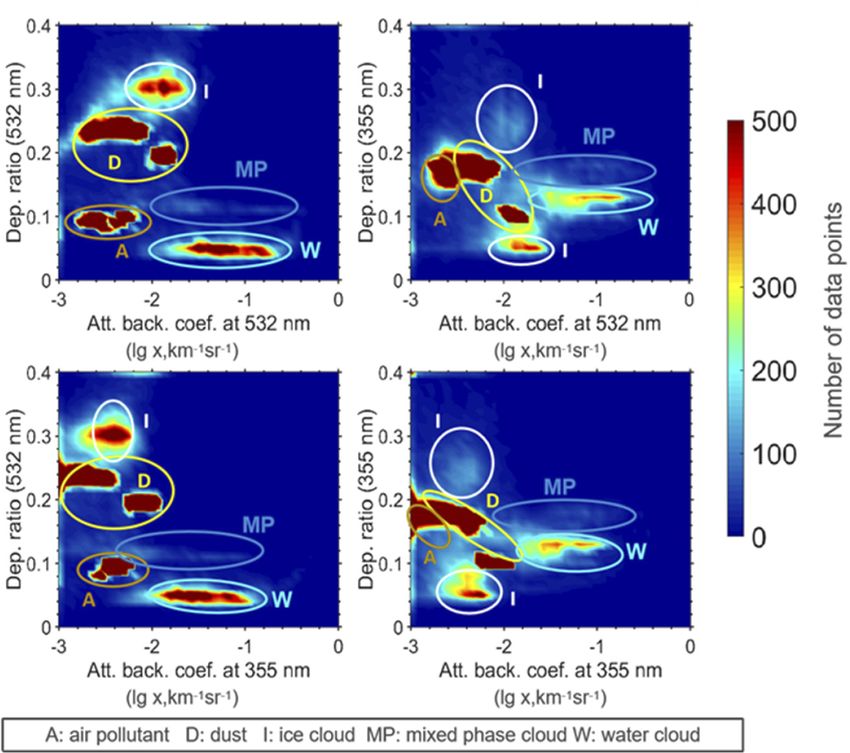
Research Article                                    Vol. 29, No. 15 / 19 July 2021 / Optics Express 23466

       Fig. 3. Relationship between the attenuated backscatter coefficient and volume depolar-
       ization ratio at wavelengths of 532 nm and 355 nm for air pollutants (A), dust-dominated
       aerosols (D), ice clouds (I), water clouds (W) and mixed phase clouds (MP) from lidar
       measurements in Lanzhou in March and in Linze in April, 2014. The datasets are summarized
       in Table 1. The grid resolution is 40×40.

(water cloud) and 0.12 ± 0.05 (mixed phase cloud), while these values are 0.16 ± 0.12 (ice cloud),
0.13 ± 0.04 (water cloud) and 0.14 ± 0.07 (mixed phase cloud) at 355 nm. Then, we found that for
non-spherical particles, the ratio of VDRs at 532 nm and 355 nm are 2.87 ± 1.35 for ice cloud and
1.51 ± 0.29 for dust-dominated aerosol, while for spherical particles, the ratios are 0.43 ± 0.26 for
water cloud and 0.56 ± 0.05 for air pollutants. Finally, lidar observations of atmospheric aerosols
and clouds in March and April were used to calculate the ratio of VDRs at 532 nm and 355
nm, as shown in Fig. 7 and 8. We found that layers of ice clouds and dust-dominated aerosols
are clearly seen and separated from others. This study indicated that spectral VDRs at UV and
visible wavelengths are very useful for the identification of aerosols and clouds in the atmosphere
by lidar measurements.
   Now, we can conclude that for spherical particles, the ratio of VDRs at 532 nm and 355
nm (δ532 /δ355 ) are less than 1, while for non-spherical particles, the values are greater than 1.
Moreover, we found that the threshold value of the ratio for dust-dominated aerosols is 1.1–2.5,
and for air pollutants, this value is less than 0.8. According to this result, a ratio between 0.8 and
1.1 is attributed to a mixture of dust and air pollutants. These thresholds are consistent with our
previous results (Huang et al., 2020). In addition, the ratio of VDRs for water clouds are less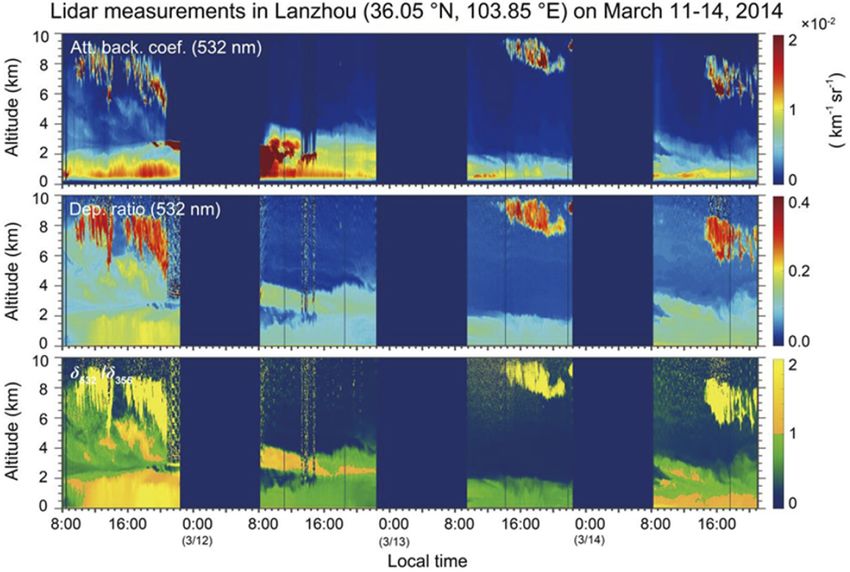
Research Article                                  Vol. 29, No. 15 / 19 July 2021 / Optics Express 23467

       Table 1. Information on the data points selected for the analysis shown in Figures 3–5.
   Date             Ice cloud (I)   Water cloud (W)    Mixed-phase           Dust-           Air pollutant (A)
 (Location)                                            cloud (MP)         dominated
                                                                          aerosol (D)
    Mar. 6                -                -                 -                  -              15:00–17:00
  (Lanzhou)                                                                                    1.0–2.0 km
   Mar. 11          19:30–20:00            -           21:00–22:00        18:00–20:00          10:00–12:00
  (Lanzhou)          6.0–7.0 km                         2.5–3.0 km         0.5–1.5 km           2.5–2.8 km
   Mar. 12                -           13:00–15:00                               -                    -
  (Lanzhou)                           1.8–2.0 km
   Mar. 13          17:00–19:00            -                 -                  -              15:00–17:00
  (Lanzhou)          8.5–9.5 km                                                                1.0–2.0 km
   Mar. 27                -                -            3:00–4:00         6:00–9:00                  -
  (Lanzhou)                                             3.5–4.0 km        0.5–2.0 km
Apr.11 (Linze)            -           12:30–15:00            -                  -                    -
                                       2.8–3.5 km
Apr.13 (Linze)      18:00–20:20            -                 -                  -                    -
                     7.0–8.5 km
Apr.14 (Linze)            -                -            2:00–3:00         0:00–4:00                  -
                                                        3.2–4.0 km        0.5–1.0 km

       Fig. 4. Upper panel: relationships between the color ratio (532 nm/355 nm) and volume
       depolarization ratios at 532 nm and 355 nm. Lower panel: the relationships between the
       color ratio (532 nm/355 nm) and attenuated backscatter coefficient at 532 nm and 355 nm.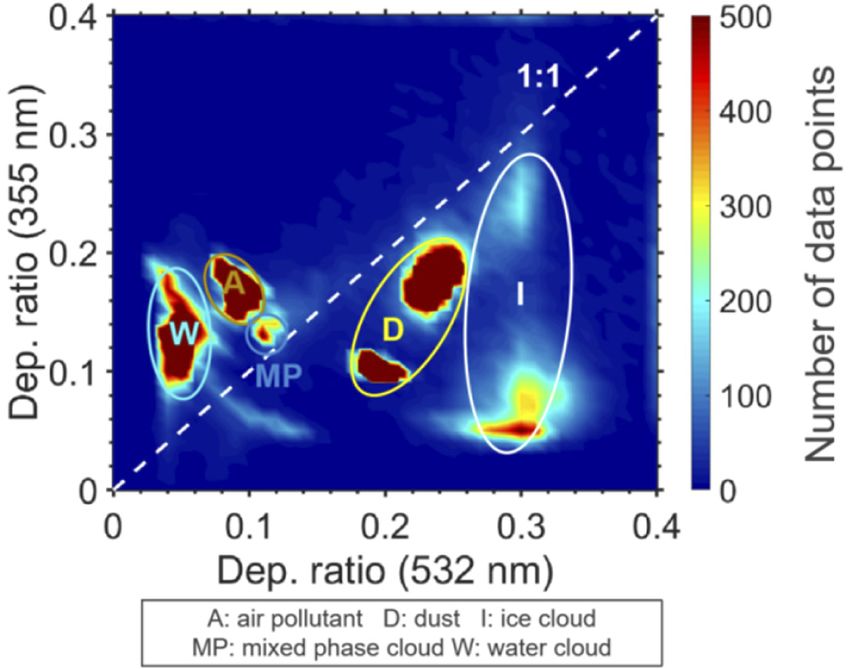
Research Article                                    Vol. 29, No. 15 / 19 July 2021 / Optics Express 23468

 Fig. 5. Relationship between volume depolarization ratios at 532 nm and 355 nm for typical
 types of aerosols and clouds.

 Fig. 6. Mean and standard deviation of volume depolarization ratios at 532 nm and 355 nm
 of typical aerosols and clouds.
Research Article                                  Vol. 29, No. 15 / 19 July 2021 / Optics Express 23469

 Fig. 7. Vertical structure of atmospheric aerosols and clouds from lidar observations in
 Lanzhou on March 11–14, 2014.

 Fig. 8. Vertical structure of atmospheric aerosols and clouds from lidar observations in
 Linze on April 11–23, 2014.
Research Article                                     Vol. 29, No. 15 / 19 July 2021 / Optics Express 23470

than 0.5, but for ice clouds, these values are greater than 1.5. Using these results, we can clearly
separate water clouds from ice clouds. In this study, mixed-phase clouds were detected during
our observational period, leading to the identification of mixed-phase clouds being achieved, the

       Fig. 9. Vertical profiles of lidar measurements. (a) Data are from Lanzhou at 14:00 on
       March 6, 2014; (b) Data are from Lanzhou at 18:00 on March 11, 2014; (c) Data are from
       Linze at 13:00 on April 11, 2014 (A: air pollutant; D: dust; W: water cloud; I: ice cloud).
Research Article Vol. 29, No. 15 / 19 July 2021 / Optics Express 23471
ratio of VDRs for mixed-phase clouds are about 1.0. The value is consistent with the results of
previous study [78]. Figure 9 shows the vertical profiles of three different time points, and the
expression of the results is more intuitive. Finally, a method for accurately classifying typical
types of aerosols and clouds from lidar measurements is proposed, and a flow chart of the
proposed method is shown in Fig. 10. After correction of the lidar data, we first distinguished
clouds from aerosols using a combination of the CR and ABC at 532 nm. Then, subtypes of
clouds and aerosols are identified based on the ratio of VDRs at 532 nm and 355 nm.
Fig. 10. Flow chart of the proposed method for classifying atmospheric aerosols and clouds
from dual-polarization lidar measurements in this study.
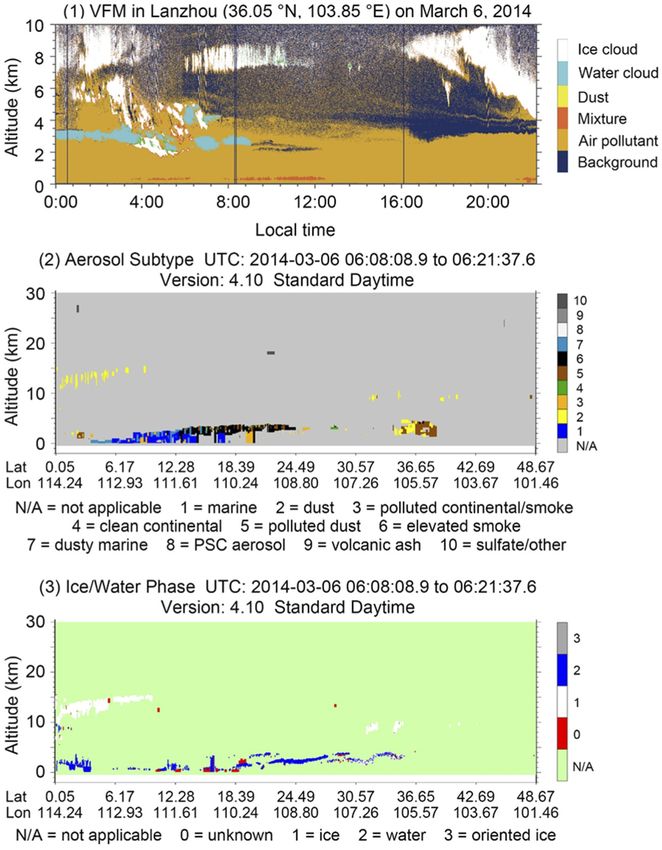
We applied the proposed method to lidar measurements on March 6, and the vertical feature
mask (VFM) of atmospheric aerosols and clouds could be obtained, as shown in Fig. 11. Ice
cloud layers and water clouds on March 6 were successfully identified. For aerosols, we not only
separated dust-dominated aerosols and air pollutants but also identified their mixture. The results
of the classification using the proposed method have been roughly validated by weather records
(dust event records), local in situ ground-based monitoring observation data and CALIPSO
observation results.Research Article Vol. 29, No. 15 / 19 July 2021 / Optics Express 23472 Fig. 11. (1) Vertical feature mask (VFM) of atmospheric aerosols and clouds identified using the proposed method from lidar measurements in Lanzhou on March 6, 2014. (2) and (3): VFM of atmospheric aerosols and clouds identified using CALIPSO.
Research Article                                              Vol. 29, No. 15 / 19 July 2021 / Optics Express 23473

4.   Conclusions
In this study, we developed a ground-based dual-polarization lidar system that can simultaneously
detect polarization measurements at wavelengths of 355 nm and 532 nm. The developed lidar
was used to observe the vertical distribution of atmospheric aerosols and clouds over Northwest
China in the spring 2014. Our results show that VDRs at 355 nm and 532 nm markedly differ for
typical types of aerosols and clouds. For ice clouds and dust-dominated particles, the VDRs
at 532 nm are larger than those at 355 nm. However, for water clouds and air pollutants, the
VDRs at 532 nm are smaller than those at 355 nm. The ratio of VDRs at 532 nm and 355 nm
are 2.87 ± 1.35 for ice clouds and 1.51 ± 0.29for dust-dominated particles, but these values are
0.43 ± 0.26 for water clouds and 0.56 ± 0.05 for air pollutants. Moreover, we proposed a simple
reliable method for identifying atmospheric aerosols and clouds based on the spectral VDRs,
CR and ABC at 532 nm. The proposed method first distinguishes clouds from aerosols using a
combination of the CR and ABC at 532 nm. Then, subtypes of clouds and aerosols are identified
based on the ratio of VDRs at 532 nm and 355 nm. The results showed that dual-polarization
lidar measurements can remarkably improve the classification of atmospheric aerosols and clouds.
It is proven that more information on atmospheric aerosols and clouds can be obtained from
polarization lidar measurements at multiple wavelengths. This study encourages the laser remote
sensing community to make lidar systems that can detect spectral VDRs for the study of aerosols
and clouds in the atmosphere.
Funding. National Natural Science Foundation of China (41521004, 41627807, 41875029); Higher Education
Discipline Innovation Project – 111 Project (B 13045).
Acknowledgments. Foundation of Key Laboratory for Semi-Arid Climate Change of the Ministry of Education in
Lanzhou University.
Disclosures. The authors declare no conflicts of interest.
Data availability. Data underlying the results presented in this paper are not publicly available at this time but may
be obtained from the authors upon reasonable request.

References
1. J. Huang, T. Wang, W. Wang, Z. Li, and H. Yan, “Climate effects of dust aerosols over East Asian arid and semiarid
    regions,” J. Geophys. Res. Atmos. 119(19), 11,398–11,416 (2014).
2. J. Bi, J. Huang, Z. Hu, B. N. Holben, and Z. Guo, “Investigating the aerosol optical and radiative characteristics of
    heavy haze episodes in Beijing during January of 2013,” J. Geophys. Res. Atmos. 119(16), 9884–9900 (2014).
3. Q. Fu, T. J. Thorsen, J. Su, J. M. Ge, and J. P. Huang, “Test of Mie-based single-scattering properties of non-spherical
    dust aerosols in radiative flux calculations,” J. Quant. Spectrosc. Radiat. Transf. 110(14-16), 1640–1653 (2009).
4. J. Bi, J. Huang, B. Holben, and G. Zhang, “Comparison of key absorption and optical properties between pure and
    transported anthropogenic dust over East and Central Asia,” Atmos. Chem. Phys. 16(24), 15501–15516 (2016).
5. T. Wang, Y. Han, J. Huang, M. Sun, B. Jian, Z. Huang, and H. Yan, “Climatology of dust-forced radiative heating
    over the Tibetan Plateau and its surroundings,” J. Geophys. Res. Atmos. 125, e2020JD032942 (2020).
6. V. Forster and P. and Ramaswamy, “Changes in Atmospheric Constituents and in Radiative Forcing, Climate Change
    2007,” Phys. Sci. Basis 129–234 (2007).
7. V. Ramanathan, P. J. Crutzen, J. T. Kiehl, and D. Rosenfeld, “Aerosols, Climate, and the Hydrological Cycle,”
    Science 294(5549), 2119–2124 (2001).
8. S. Liu, M. Chen, and Q. Zhuang, “Aerosol effects on global land surface energy fluxes during 2003-2010,” Geophys.
    Res. Lett. 41(22), 7875–7881 (2014).
9. U. Lohmann and J. Feichter, “Global indirect aerosol effects: a review,” Atmos. Chem. Phys. 5(3), 715–737 (2005).
10. W. Wang, J. Huang, P. Minnis, Y. Hu, J. Li, Z. Huang, J. K. Ayers, and T. Wang, “Dusty cloud properties and radiative
    forcing over dust source and downwind regions derived from A-Train data during the Pacific Dust Experiment,” J.
    Geophys. Res. Atmos. 115(24), 1–17 (2010).
11. H. Yan and T. Wang, “Ten Years of Aerosol Effects on Single-Layer Overcast Clouds over the US Southern Great
    Plains and the China Loess Plateau,” Adv. Meteorol. 2020, 6719160 (2020).
12. J. Li, J. Huang, K. Stamnes, T. Wang, Q. Lv, and H. Jin, “A global survey of cloud overlap based on CALIPSO and
    CloudSat measurements,” Atmos. Chem. Phys. 15(1), 519–536 (2015).
13. Z. Li, Y. Wang, J. Guo, C. Zhao, M. C. Cribb, X. Dong, J. Fan, D. Gong, J. Huang, M. Jiang, Y. Jiang, S. S. Lee, H.
    Li, J. Li, J. Liu, Y. Qian, D. Rosenfeld, S. Shan, Y. Sun, H. Wang, J. Xin, X. Yan, X. Yang, X. qun Yang, F. Zhang,
    and Y. Zheng, “East Asian Study of Tropospheric Aerosols and their Impact on Regional Clouds, Precipitation, and
    Climate (EAST-AIRCPC),” J. Geophys. Res. Atmos. 124(23), 13026–13054 (2019).
Research Article Vol. 29, No. 15 / 19 July 2021 / Optics Express 23474
14. J. L. Brenguier, H. Pawlowska, L. Schüller, R. Preusker, J. Fischer, and Y. Fouquart, “Radiative properties of boundary
layer clouds: Droplet effective radius versus number concentration,” J. Atmos. Sci. 57(6), 803–821 (2000).
15. E. Berry and G. G. Mace, “Cloud properties and radiative effects of the Asian summer monsoon derived from A-Train
data,” J. Geophys. Res. Atmos. 119(15), 9492–9508 (2014).
16. T. J. Garrett and C. Zhao, “Increased Arctic cloud longwave emissivity associated with pollution from mid-latitudes,”
Nature 440(7085), 787–789 (2006).
17. S. Twomey, “The Influence of Pollution on the Shortwave Albedo of Clouds,” J. Atmos. Sci. 34(7), 1149–1152
(1977).
18. S. Sherwood and Q. Fu, “A drier future?” Science. 343(6172), 737–739 (2014).
19. S. Lolli, W. Y. Khor, M. Z. Matjafri, and H. S. Lim, “Monsoon season quantitative assessment of biomass burning
clear-sky aerosol radiative effect at surface by ground-based lidar observations in pulau pinang, Malaysia in 2014,”
Remote Sens. 11(22), 2660 (2019).
20. T. Zhang, H. Che, Z. Gong, Y. Wang, J. Wang, Y. Yang, K. Gui, and B. Guo, “The two-way feedback effect between
aerosol pollution and planetary boundary layer structure on the explosive rise of PM2.5 after the “Ten Statements of
Atmosphere” in Beijing,” Sci. Total Environ. 709, 136259 (2020).
21. Y. S. Koo, H. Y. Yun, D. R. Choi, J. S. Han, J. B. Lee, and Y. J. Lim, “An analysis of chemical and meteorological
characteristics of haze events in the Seoul metropolitan area during January 12–18, 2013,” Atmos. Environ. 178(2018),
87–100 (2018).
22. T. Sun, H. Che, B. Qi, Y. Wang, Y. Dong, X. Xia, H. Wang, K. Gui, Y. Zheng, H. Zhao, Q. Ma, R. Du, and X. Zhang,
“Aerosol optical characteristics and their vertical distributions under enhanced haze pollution events: Effect of the
regional transport of different aerosol types over eastern China,” Atmos. Chem. Phys. 18(4), 2949–2971 (2018).
23. J. Chen, Z. Li, M. Lv, Y. Wang, W. Wang, Y. Zhang, H. Wang, X. Yan, Y. Sun, and M. Cribb, “Aerosol hygroscopic
growth, contributing factors, and impact on haze events in a severely polluted region in northern China,” Atmos.
Chem. Phys. 19(2), 1327–1342 (2019).
24. J. R. Campbell, D. L. Hlavka, E. J. Welton, C. J. Flynn, D. D. Turner, J. D. Spinhirne, S. Stanley, and I. H.
Hwang, “Full-time, eye-safe cloud and aerosol lidar observation at atmospheric radiation measurement program sites:
Instruments and data processing,” J. Atmos. Ocean. Technol. 19(4), 431–442 (2002).
25. D. Müller, K. H. Lee, J. Gasteiger, M. Tesche, B. Weinzierl, K. Kandler, T. Müller, C. Toledano, S. Otto, D. Althausen,
and A. Ansmann, “Comparison of optical and microphysical properties of pure Saharan mineral dust observed with
AERONET Sun photometer, Raman lidar, and in situ instruments during SAMUM 2006,” J. Geophys. Res. Atmos.
117(7), (2012).
26. N. Sugimoto, I. Matsui, A. Shimizu, I. Uno, K. Asai, T. Endoh, and T. Nakajima, “Observation of dust and
anthropogenic aerosol plumes in the Northwest Pacific with a two-wavelength polarization lidar on board the research
vessel Mirai,” Geophys. Res. Lett. 29(19), 7-1–7-4 (2002).
27. N. Sugimoto and Z. Huang, “Lidar methods for observing mineral dust,” J. Meteorol. Res. 28(2), 173–184 (2014).
28. J. Huang, P. Minnis, B. Chen, Z. Huang, Z. Liu, Q. Zhao, Y. Yi, and J. K. Ayers, “Long-range transport and vertical
structure of Asian dust from CALIPSO and surface measurements during PACDEX,” J. Geophys. Res. Atmos.
113(23), 1–13 (2008).
29. J. P. Huang, J. J. Liu, B. Chen, and S. L. Nasiri, “Detection of anthropogenic dust using CALIPSO lidar measurements,”
Atmos. Chem. Phys. 15(20), 11653–11665 (2015).
30. T. Nishizawa, N. Sugimoto, I. Matsui, A. Shimizu, Y. Hara, U. Itsushi, K. Yasunaga, R. Kudo, and S. W. Kim,
“Ground-based network observation using Mie–Raman lidars and multi-wavelength Raman lidars and algorithm to
retrieve distributions of aerosol components,” J. Quant. Spectrosc. Radiat. Transf. 188, 79–93 (2017).
31. J. Reichardt, U. Wandinger, V. Klein, I. Mattis, B. Hilber, and R. Begbie, “RAMSES: German meteorological
service autonomous Raman Iidar for water vapor, temperature, aerosol, and cloud measurements,” Appl. Opt. 51(34),
8111–8131 (2012).
32. J. M. Intrieri, M. D. Shupe, T. Uttal, and B. J. McCarty, “An annual cycle of Arctic cloud characteristics observed by
radar and lidar at SHEBA,” J. Geophys. Res. Ocean. 107(10), SHE 5-1–SHE 5-15 (2002).
33. J. Li, B. Jian, J. Huang, Y. Hu, C. Zhao, K. Kawamoto, S. Liao, and M. Wu, “Long-term variation of cloud droplet
number concentrations from space-based Lidar,” Remote Sens. Environ. 213(1), 144–161 (2018).
34. J. E. Yorks, D. L. Hlavka, W. D. Hart, and M. J. Mcgill, “Statistics of cloud optical properties from airborne lidar
measurements,” J. Atmos. Ocean. Technol. 28(7), 869–883 (2011).
35. A. Ansmann, F. Wagner, D. Müller, D. Althausen, A. Herber, W. Von Hoyningen-Huene, and U. Wandinger,
“European pollution outbreaks during ACE 2: Optical particle properties inferred from multiwavelength lidar and
star-Sun photometry,” J. Geophys. Res. Atmos. 107(15), AAC 8-1–AAC 8-14 (2002).
36. M. Tesche, A. Ansmann, D. Müller, D. Althausen, I. Mattis, B. Heese, V. Freudenthaler, M. Wiegner, M. Esselborn,
G. Pisani, and P. Knippertz, “Vertical profiling of Saharan dust with Raman lidars and airborne HSRL in southern
Morocco during SAMUM,” Tellus, Ser. B Chem. Phys. Meteorol. 61(1), 144–164 (2009).
37. T. Zhou, H. Xie, J. Bi, Z. Huang, J. Huang, J. Shi, B. Zhang, and W. Zhang, “Lidar measurements of dust aerosols
during three field campaigns in 2010, 2011 and 2012 over northwestern China,” Atmosphere (Basel). 9(5), 173
(2018).
38. L. Fang, S. Wang, T. Yu, X. Gu, X. Zhang, W. Wang, and S. Ren, “Changes in aerosol optical and micro-physical
properties over Northeast Asia from a severe dust storm in April 2014,” Remote Sens. 8(5), 394 (2016).Research Article Vol. 29, No. 15 / 19 July 2021 / Optics Express 23475
39. R. J. Park, M. J. Kim, J. I. Jeong, D. Youn, and S. Kim, “A contribution of brown carbon aerosol to the aerosol light
absorption and its radiative forcing in East Asia,” Atmos. Environ. 44(11), 1414–1421 (2010).
40. Z. Huang, J. Huang, J. Bi, G. Wang, W. Wang, Q. Fu, Z. Li, S.-C. Tsay, and J. Shi, “Dust aerosol vertical structure
measurements using three MPL lidars during 2008 China-U.S. joint dust field experiment,” J. Geophys. Res. 115(13),
1299–1303 (2010).
41. J. Bi, J. Huang, J. Shi, Z. Hu, T. Zhou, G. Zhang, Z. Huang, X. Wang, and H. Jin, “Measurement of scattering and
absorption properties of dust aerosol in a Gobi farmland region of northwestern China - A potential anthropogenic
influence,” Atmos. Chem. Phys. 17(12), 7775–7792 (2017).
42. Z. Huang, J. Huang, T. Hayasaka, S. Wang, T. Zhou, and H. Jin, “Short-cut transport path for Asian dust directly to
the Arctic: A case study,” Environ. Res. Lett. 10(11), 114018 (2015).
43. Z. Huang, J. B. Nee, C. W. Chiang, S. Zhang, H. Jin, W. Wang, and T. Zhou, “Real-time observations of dust-cloud
interactions based on polarization and Raman lidar measurements,” Remote Sens. 10(7), 1–14 (2018).
44. T. Wang, Y. Chen, Z. Gan, Y. Han, J. Li, and J. Huang, “Assessment of dominating aerosol properties and their
long-term trend in the Pan-Third Pole region: A study with 10-year multi-sensor measurements,” Atmos. Environ.
239, 117738 (2020).
45. Q. Hu, H. Wang, P. Goloub, Z. Li, I. Veselovskii, T. Podvin, K. Li, and M. Korenskiy, “The characterization of
Taklamakan dust properties using a multiwavelength Raman polarization lidar in Kashi, China,” Atmos. Chem. Phys.
20(22), 13817–13834 (2020).
46. N. Sugimoto, Z. Huang, T. Nishizawa, I. Matsui, and B. Tatarov, “Fluorescence from atmospheric aerosols observed
with a multi-channel lidar spectrometer,” Opt. Express 20(19), 20800 (2012).
47. Z. Liu, A. Omar, M. Vaughan, J. Hair, C. Kittaka, Y. Hu, K. Powell, C. Trepte, D. Winker, C. Hostetler, R. Ferrare,
and R. Pierce, “CALIPSO lidar observations of the optical properties of Saharan dust: A case study of long-range
transport,” J. Geophys. Res. Atmos. 113, D07207 (2008).
48. A. Kumar, N. Singh, R. Anshumali, and Solanki, “Evaluation and utilization of MODIS and CALIPSO aerosol
retrievals over a complex terrain in Himalaya,” Remote Sens. Environ. 206(2018), 139–155 (2018).
49. J. Huang, P. Minnis, Y. Yi, Q. Tang, X. Wang, Y. Hu, Z. Liu, K. Ayers, C. Trepte, and D. Winker, “Summer dust
aerosols detected from CALIPSO over the Tibetan Plateau,” Geophys. Res. Lett. 34(18), L18805 (2007).
50. A. Devasthale, M. Tjernström, and A. H. Omar, ““The vertical distribution of thin features over the Arctic analysed
from CALIPSO observations: Part II: Aerosols,” Tellus,” Ser. B Chem. Phys. Meteorol. 63(1), 86–95 (2011).
51. F. Cairo, G. Di Donfrancesco, A. Adriani, L. Pulvirenti, and F. Fierli, “Comparison of various linear depolarization
parameters measured by lidar,” Appl. Opt. 38(21), 4425 (1999).
52. J. Hofer, D. Althausen, S. F. Abdullaev, A. N. Makhmudov, B. I. Nazarov, G. Schettler, R. Engelmann, H. Baars, K.
W. Fomba, K. Müller, B. Heinold, K. Kandler, and A. Ansmann, “Long-term profiling of mineral dust and pollution
aerosol with multiwavelength polarization Raman lidar at the Central Asian site of Dushanbe, Tajikistan: Case
studies,” Atmos. Chem. Phys. 17(23), 14559–14577 (2017).
53. D. Mamali, E. Marinou, J. Sciare, M. Pikridas, P. Kokkalis, M. Kottas, I. Binietoglou, A. Tsekeri, C. Keleshis, R.
Engelmann, H. Baars, A. Ansmann, V. Amiridis, H. Russchenberg, and G. Biskos, “Vertical profiles of aerosol mass
concentration derived by unmanned airborne in situ and remote sensing instruments during dust events,” Atmos.
Meas. Tech. 11(5), 2897–2910 (2018).
54. C. Böckmann, U. Wandinger, A. Ansmann, J. Bo, V. Amiridis, A. Boselli, A. Delaval, F. De Tomasi, M. Frioud, I. V.
Grigorov, A. Hågård, M. Horvat, M. Iarlori, L. Komguem, S. Kreipl, G. Larcheve, V. Matthias, A. Papayannis, G.
Pappalardo, F. Rocadenbosch, J. Schneider, V. Shcherbakov, and C. Universitario, “Aerosol lidar intercomparison in
the framework of the EARLINET project. 2. Aerosol backscatter algorithms,” Appl. Opt. 43(4), 977–989 (2004).
55. A. Ansmann, U. Wandinger, M. Riebesell, C. Weitkamp, and W. Michaelis, “Independent measurement of extinction
and backscatter profiles in cirrus clouds by using a combined Raman elastic-backscatter lidar,” Appl. Opt. 31(33),
7113 (1992).
56. M. McGill, D. Hlavka, W. Hart, V. S. Scott, J. Spinhirne, and B. Schmid, “Cloud Physics Lidar: instrument description
and initial measurement results,” Appl. Opt. 41(18), 3725 (2002).
57. N. Papagiannopoulos, L. Mona, A. Amodeo, G. D’Amico, P. Gumà Claramunt, G. Pappalardo, L. Alados-Arboledas,
J. Luís Guerrero-Rascado, V. Amiridis, P. Kokkalis, A. Apituley, H. Baars, A. Schwarz, U. Wandinger, I. Binietoglou,
D. Nicolae, D. Bortoli, A. Comerón, A. Rodríguez-Gómez, M. Sicard, A. Papayannis, and M. Wiegner, “An automatic
observation-based aerosol typing method for EARLINET,” Atmos. Chem. Phys. 18(21), 15879–15901 (2018).
58. K. Ohneiser, A. Ansmann, H. Baars, P. Seifert, B. Barja, C. Jimenez, M. Radenz, A. Teisseire, A. Floutsi, M. Haarig,
R. Engelmann, F. Zamorano, J. Bühl, and U. Wandinger, “Smoke of extreme Australian bushfires observed in the
stratosphere over Punta Arenas, Chile, in January 2020: optical thickness, lidar ratios, and depolarization ratios at
355 and 532 nm,” Atmos. Chem. Phys. Discuss. (January), 1–16 (2020).
59. S. P. Burton, R. A. Ferrare, C. A. Hostetler, J. W. Hair, R. R. Rogers, M. D. Obland, C. F. Butler, A. L. Cook, D.
B. Harper, and K. D. Froyd, “Aerosol classification using airborne High Spectral Resolution Lidar measurements-
methodology and examples,” Atmos. Meas. Tech. 5(1), 73–98 (2012).
60. L. Mona, A. Amodeo, G. D’Amico, A. Giunta, F. Madonna, and G. Pappalardo, “Multi-wavelength Raman
lidar observations of the Eyjafjallajökull volcanic cloud over Potenza, southern Italy,” Atmos. Chem. Phys. 12(4),
2229–2244 (2012).Research Article Vol. 29, No. 15 / 19 July 2021 / Optics Express 23476
61. D. Müller, K. Franke, F. Wagner, D. Althausen, A. Ansmann, and J. Heintzenberg, “Vertical profiling of optical and
physical particle properties over the tropical Indian Ocean with six-wavelength lidar 1. Seasonal cycle,” J. Geophys.
Res. Atmos. 106(D22), 28567–28575 (2001).
62. V. Noel and H. Chepfer, “A global view of horizontally oriented crystals in ice clouds from Cloud-Aerosol Lidar and
Infrared Pathfinder Satellite Observation (CALIPSO),” J. Geophys. Res. 115(D4), D00H23 (2010).
63. J. M. Intrieri, G. L. Stephens, W. L. Eberhard, and T. Uttal, “A method for determining cirrus cloud particle sizes
using lidar and radar backscatter technique,” J. Appl. Meteorol. 32(6), 1074–1082 (1993).
64. H.-M. Cho, P. Yang, G. W. Kattawar, S. L. Nasiri, Y. Hu, P. Minnis, C. Trepte, and D. Winker, “Depolarization
ratio and attenuated backscatter for nine cloud types: analyses based on collocated CALIPSO lidar and MODIS
measurements,” Opt. Express 16(6), 3931–3948 (2008).
65. K. Sassen, “The polarization lidar technique for cloud research: a review and current assessment,” Bull. - Am.
Meteorol. Soc. 72(12), 1848–1866 (1991).
66. Z. Liu, M. A. Vaughan, D. M. Winker, C. A. Hostetler, L. R. Poole, D. Hlavka, W. Hart, and M. McGill, “Use of
probability distribution functions for discriminating between clouds and aerosol in lidar backscatter data,” J. Geophys.
Res. D Atmos. 109(15), 1–13 (2004).
67. Z. Liu, M. Vaughan, D. Winker, C. Kittaka, B. Getzewich, R. Kuehn, A. Omar, K. Powell, C. Trepte, and C. Hostetler,
“The CALIPSO lidar cloud and aerosol discrimination: Version 2 algorithm and initial assessment of performance,”
J. Atmos. Ocean. Technol. 26(7), 1198–1213 (2009).
68. T. Zhou, J. Huang, Z. Huang, J. Liu, W. Wang, and L. Lin, “The depolarization–attenuated backscatter relationship
for dust plumes,” Opt. Express 21(13), 15195 (2013).
69. Z. Wang and K. Sassen, “Cloud type and macrophysical property retrieval using multiple remote sensors,” J. Appl.
Meteorol. 40(10), 1665–1682 (2001).
70. C. Zhao, Y. Wang, Q. Wang, Z. Li, Z. Wang, and D. Liu, “A new cloud and aerosol layer detection method based on
micropulse lidar measurements,” J. Geophys. Res. Atmos. 119(11), 6788–6802 (2014).
71. I. Veselovskii, A. Kolgotin, V. Griaznov, D. Mu, K. Franke, and D. N. Whiteman, “Inversion of multiwavelength
Raman lidar data for retrieval of bimodal aerosol size distribution,” Appl. Opt. 43(5), 1180–1195 (2004).
72. S. Groß, M. Esselborn, F. Abicht, M. Wirth, A. Fix, and A. Minikin, “Airborne high spectral resolution lidar
observation of pollution aerosol during EUCAARI-LONGREX,” Atmos. Chem. Phys. 13(5), 2435–2444 (2013).
73. A. A. Floutsi, H. Baars, M. Radenz, M. Haarig, Z. Yin, P. Seifert, C. Jimenez, A. Ansmann, R. Engelmann, B.
Barja, F. Zamorano, and U. Wandinger, “Advection of biomass burning aerosols towards the southern hemispheric
mid-latitude station of punta arenas as observed with multiwavelength polarization raman lidar,” Remote Sens. 13(1),
138 (2021).
74. S. P. Burton, M. A. Vaughan, R. A. Ferrare, and C. A. Hostetler, “Separating mixtures of aerosol types in airborne
High Spectral Resolution Lidar data,” Atmos. Meas. Tech. 7(2), 419–436 (2014).
75. S. P. Burton, J. W. Hair, M. Kahnert, R. A. Ferrare, C. A. Hostetler, A. L. Cook, D. B. Harper, T. A. Berkoff, S. T.
Seaman, J. E. Collins, M. A. Fenn, and R. R. Rogers, “Observations of the spectral dependence of linear particle
depolarization ratio of aerosols using NASA Langley airborne High Spectral Resolution Lidar,” Atmos. Chem. Phys.
15(23), 13453–13473 (2015).
76. Z. Huang, S. Qi, T. Zhou, Q. Dong, X. Ma, S. Zhang, J. Bi, and J. Shi, “Investigation of aerosol absorption with
dual-polarization lidar observations,” Opt. Express 28(5), 7028 (2020).
77. M. I. Mishchenko, J. M. Dlugach, and L. Liu, “Linear depolarization of lidar returns by aged smoke particles,” Appl.
Opt. 55(35), 9968 (2016).
78. I. Veselovskii, P. Goloub, T. Podvin, D. Tanre, A. Ansmann, M. Korenskiy, A. Borovoi, Q. Hu, and D. N. Whiteman,
“Spectral dependence of backscattering coefficient of mixed phase clouds over West Africa measured with two-
wavelength Raman polarization lidar: Features attributed to ice-crystals corner reflection,” J. Quant. Spectrosc.
Radiat. Transf. 202, 74–80 (2017).You can also read