Climate Services - NERC Open Research Archive
←
→
Page content transcription
If your browser does not render page correctly, please read the page content below
Climate Services 23 (2021) 100246

                                                                  Contents lists available at ScienceDirect

                                                                         Climate Services
                                                         journal homepage: www.elsevier.com/locate/cliser

Using co-production to improve the appropriate use of sub-seasonal
forecasts in Africa
Linda Hirons a, *, Elisabeth Thompson a, Cheikh Dione c, Victor S. Indasi c, Mary Kilavi e,
Elias Nkiaka f, Joshua Talib b, Emma Visman b, Elijah A. Adefisan c, Felipe de Andrade a,
Jesse Ashong g, Jasper Batureine Mwesigwa d, n, Victoria L. Boult a, Tidiane Diédhiou h,
Oumar Konte h, Masilin Gudoshava d, Chris Kiptum e, Richmond Konadu Amoah o,
Benjamin Lamptey f, Kamoru Abiodun Lawal i, j, Richard Muita e, f, Richard Nzekwu l,
Patricia Nying’uro e, Willis Ochieng k, Eniola Olaniyan i, Nana Kofi Opoku g,
Hussen Seid Endris d, Zewdu Segele d, Pascal Moudi Igri m, Emmah Mwangi p, Steve Woolnough a
a
  National Centre of Atmospheric Science (NCAS), University of Reading, United Kingdom
b
  UK Centre for Ecology and Hydrology (UKCEH), Wallingford, United Kingdom
c
  African Centre of Meteorological Applications for Development (ACMAD), Niger
d
  Intergovernmental Authority on Development (IGAD) Climate Prediction & Applications Centre (ICPAC), Kenya
e
  Kenya Meteorological Department (KMD), Kenya
f
  University of Leeds, United Kingdom
g
  Ghana Meteorological Agency (GMet), Ghana
h
  National Agency of Civil Aviation and Meteorology (ANACIM), Senegal
i
  Nigerian Meteorological Agency (NiMet), Abuja, Nigeria
j
  African Climate and Development Initiative, University of Cape Town, Cape Town, South Africa
k
  Kenya Electricity Generating Company PLC (KenGen), Kenya
l
  FGN-International Fund for Agricultural Development, Climate Change Adaptation and Agribusiness Support Programme (FGN-IFAD CASP), Nigeria
m
   Centre d’Application et de Prévision Climatologique de l’Afrique Centrale (CAPC-AC), Douala, Cameroon
n
  Food Security and Nutrition Working Group (FSNWG), Kenya
o
  Ministry of Food and Agriculture, Ghana
p
  Kenya Red Cross Society, Kenya

A R T I C L E I N F O                                    A B S T R A C T

Keywords:                                                Forecasts on sub-seasonal to seasonal (S2S) timescales have huge potential to aid preparedness and disaster risk
Co-production                                            reduction planning decisions in a variety of sectors. However, realising this potential depends on the provision of
Sub-seasonal forecasting                                 reliable information that can be appropriately applied in the decision-making context of users. This study describes
Operational forecasting testbed
                                                         the African SWIFT (Science for Weather Information and Forecasting Techniques) forecasting testbed which brings
Actionbased forecasting
                                                         together researchers, forecast producers and users from a range of African and UK institutions. The forecasting
User-driven forecasting for Africa
                                                         testbed is piloting the provision of real-time, bespoke S2S forecast products to decision-makers in Africa. Drawing on
                                                         data from the kick-off workshop and initial case study examples, this study critically reflects on the co-production
                                                         process. Specifically, having direct access to real-time data has allowed user-guided iterations to the spatial scale,
                                                         timing, visualisation and communication of forecast products to make them more actionable for users. Some key
                                                         lessons for effective co-production are emerging. First, it is critical to ensure there is sufficient resource to support
                                                         co-production, especially in the early co-exploration of needs. Second, all the groups in the co-production process
                                                         require capacity building to effectively work in new knowledge systems. Third, evaluation should be ongoing and
                                                         combine meteorological verification with decision-makers feedback. Ensuring the sustainability of project-initiated
                                                         services within the testbed hinges on integrating the knowledge-exchanges between individuals in the co-production
                                                         process into shaping sustainable pathways for improved operational S2S forecasting within African institutions.

    * Corresponding author.
      E-mail address: l.c.hirons@reading.ac.uk (L. Hirons).

https://doi.org/10.1016/j.cliser.2021.100246
Received 24 November 2020; Received in revised form 2 August 2021; Accepted 5 August 2021
Available online 3 September 2021
2405-8807/© 2021 The Author(s). Published by Elsevier B.V. This is an open access article under the CC BY license (http://creativecommons.org/licenses/by/4.0/).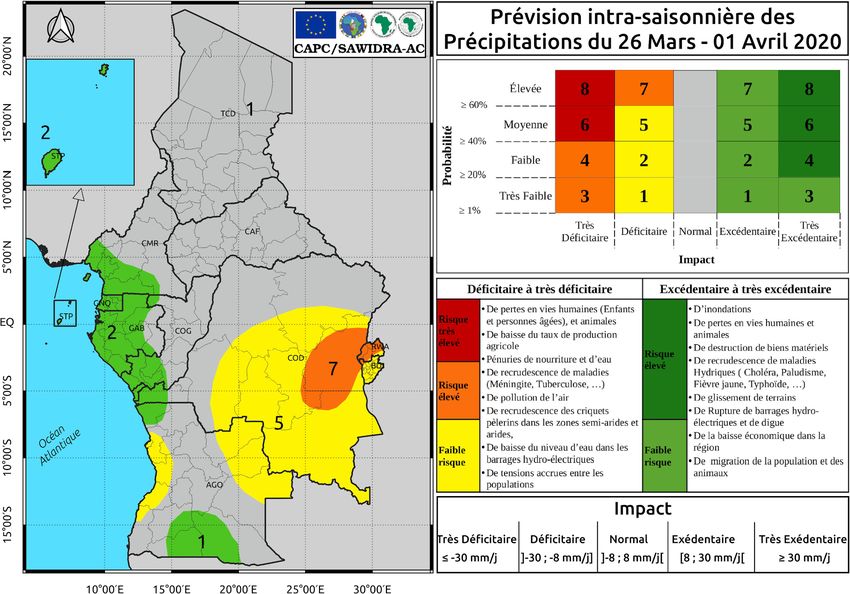
L. Hirons et al. Climate Services 23 (2021) 100246
Organisation S2S project, and that sustainable co-production re
Practical implications quires continued resource allocation from within each institution
to acknowledge and support the project-initiated, decision-led
services.
Reliable and useful sub-seasonal to seasonal (S2S; 2–4 weeks)
forecasts have huge potential to increase people’s resilience to
weather-related extremes. Understanding what drives changes in
weather on these timescales and how well forecast models are able Introduction
to capture them is an active area of research. However, applying
forecasts on these timescales to decision-making contexts, partic
Forecasts on sub-seasonal to seasonal (S2S) timescales (from 2 to 4
ularly across the African continent, remains in its infancy. There is
increasing evidence that effectively implementing such forecasts weeks) bridge the gap between short-range weather forecasts (hours to
requires a collaboration across a range of disciplines and stake days) and longer-term seasonal outlooks (Brunet et al., 2010, Vitart
holders, through a process known as co-production. Co-produc et al., 2012, Robertson et al., 2014). The provision of reliable S2S
tion brings together different knowledge sources, experiences and forecast information has huge potential to support planning decisions
working practices from different disciplines and sectors to jointly and, through early warning, allow for proactive disaster mitigation and
develop new and combined knowledge for addressing societal preparedness (Coughlan de Perez et al., 2016, White et al., 2017). As
problems of shared concern and interest. such, increasing the appropriate use of forecast information on S2S
This study describes an S2S operational forecasting ‘testbed’ timescales, provided it can be reliable and useful (Jones et al., 2015), has
which forms part of the African SWIFT (Science for Weather In the potential to increase people’s resilience to weather extremes and
formation and Forecasting Techniques) project. This S2S testbed is have a transformative impact on livelihoods (Williams et al., 2015,
a two-year forum that brings together researchers, forecast pro Nkiaka et al., 2019). However, there is increased recognition that doing
ducers and users from African and UK institutions, to participate this effectively requires iterative collaboration across a range of disci
in a co-production process using real-time forecasts from state-of- plines and stakeholders (Cash et al., 2003, Vaughan and Dessai, 2014)
the-art forecasting models. Operational groups from across East
through a process known as co-production (Bremer and Meisch, 2017,
and West Africa are working closely together to co-produce new,
user-driven S2S forecast products to aid decision-making in sec Vincent et al., 2018, Visman et al., 2018). Variously defined (e.g.,
tors such as agriculture, food security, energy and disaster risk Bremer and Meisch, 2017, Vincent et al., 2018), co-production of
reduction. In this operational testbed, pilot products are continu weather and climate services can be considered as the process of
ally being used, iterated and evaluated in real time to improve combining knowledge from different actors to jointly develop new
their practical application for decision-making. Specifically, ex products and services addressing issues of shared concern (Visman et al.,
amples of user-guided iterations to the spatial scale, timing, vis 2018). As such, it transforms the role of the user from recipient of in
ualisation and communication of forecast information have been formation to participant in the knowledge generation process (Vincent
shown to make products more actionable. For example, in many et al., 2020). By shifting the focus of forecast development from pro
instances annotating spatial maps by adding county boundaries or
ducers to jointly developing knowledge in the decision-making contexts
the location of large cities was enough to improve interpretation
of users (Vaughan and Dessai, 2014, Vincent et al., 2020), co-production
without inappropriately representing the data.
provides an opportunity to improve the application of S2S forecasts. Co-
In order to ensure the sustainability of project-initiated opera production also facilitates the sharing of knowledge between meteoro
tional services it is crucial to critically reflect and evaluate both logical and climate institutions within-country, within-region and
the new forecast products and the co-production process itself.
internationally.
Some initial, and crucial, lessons are emerging from the S2S test
bed: i) it is critical that there is sufficient resource to support the Despite its huge potential to improve action-based forecasting,
co-production process, especially in the co-exploration of user making predictions on S2S timescales is challenging because it is suffi
needs; ii) all testbed participants require capacity building to ciently long that the impact of the initial conditions has significantly
enable effective co-production since it requires most working reduced; but sufficiently short that slowly varying modes, such as
outside their existing knowledge and working practices; iii) oceanic circulations, are only just starting to influence the forecast
developing evaluation systems which combine measures of fore (Fig. 1; Vitart et al., 2012). There are, however, some phenomena and
cast quality with decision-makers insight is critical to the useful processes in the atmosphere, ocean and land surface which vary on S2S
application of new products. Crucially, the African SWIFT project timescales and provide crucial sources of forecast predictability (Vitart
is supporting the systematic assessment of the meteorological skill
et al., 2015). Some of those most relevant for the African continent are
of the S2S models which is key if they will be used to activate
the Madden-Julian Oscillation (MJO; Zaitchik, 2017, Sossa et al., 2017,
preparedness action in resource-constrained environments.
Kim et al., 2018), which is the major mode of sub-seasonal variability in
To continue to build upon the success of the S2S testbed so far, the tropics, sea surface temperatures (SST) associated with coupled
individual knowledge gained through scientific research and user- seasonal phenomena such as the El Niño Southern Oscillation (ENSO;
engagement needs to be integrated into institutional knowledge
Hudson et al., 2011, Olaniyan et al., 2019) and the Indian Ocean Dipole
within operational forecasting procedures. A key aspect of this is
(IOD; Hirons and Turner, 2018), as well as land surface conditions such
building the cross-institutional partnerships between national
meteorological services and in-country research institutions. as the influence of slowly-varying soil moisture anomalies (Douville
Doing so will create sustainable pathways to continue the co- et al., 2001, Koster et al., 2011).
production of S2S operational products within the African in Producing accurate sub-seasonal forecasts relies on having a model
stitutions involved. Documenting and evidencing the new forecast which can capture the sources or drivers of sub-seasonal predictability
products produced and lessons learnt through the co-production (e.g., MJO; Zaitchik, 2017); as well as the response of local weather to
process will support the generation of new forecast products in such a driver (e.g., modulation of local precipitation by MJO; Berhane
other regions and institutions. and Zaitchik, 2014). For many of the drivers outlined above, and
During the preliminary stages of the testbed it has become evident particularly over Africa, much of this scientific understanding is in its
that co-production is crucial for developing effective, user-focused infancy and the forefront of current knowledge (White et al., 2017,
S2S forecast products, which can play a vital role in improving MacLeod and Palmer, 2018, Vigaud and Giannini, 2019, Moron and
resilience to weather-related extremes. However, it is important to Robertson, 2020, de Andrade et al., 2021, Endris et al., 2021).
note that the generation of these products crucially requires While having a model that is able to capture the drivers of sub-
continued access to real-time data from the World Meteorological
seasonal variability and their local weather response can provide
2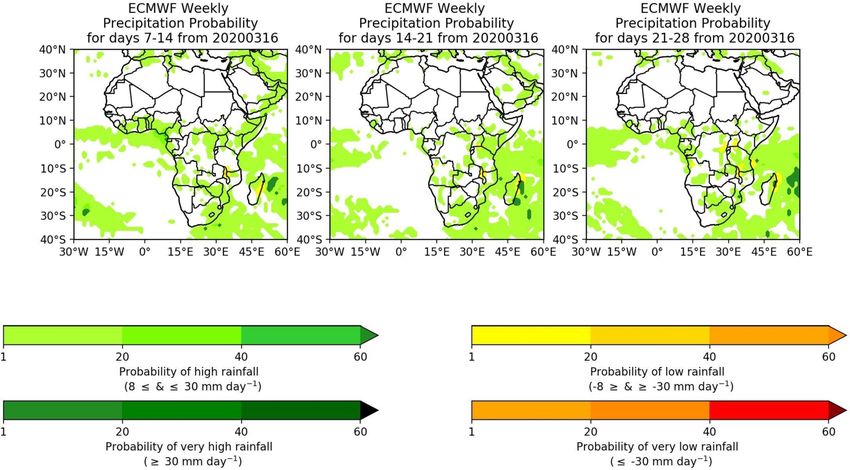
L. Hirons et al. Climate Services 23 (2021) 100246
reliable information, this is not sufficient to develop effective weather information in operational forecasting; (b) what key challenges there are
and climate services on S2S timescales (Cash et al., 2006, Dilling and in making the co-production of project-initiated S2S forecast products
Lemos, 2011, Lemos et al., 2012). In order to improve early warning sustainable; and (c) what lessons have been learnt so far about how co-
systems, reduce weather-related vulnerability and build more resilient production can increase the appropriate use of S2S forecast information,
livelihoods (Williams et al., 2015, Nkiaka et al., 2019), forecast and how they can inform future collaborative efforts.
knowledge and products also need to be useful and actionable in the Given the lack of S2S forecast information currently being used
decision-making contexts of users (Dilling and Lemos, 2011, Lemos operationally in Africa, and the huge potential of reliable S2S informa
et al., 2012). The assessment of forecast skill not only requires a tech tion on action-based forecasting (White et al., 2017), answering these
nical and scientific review of forecasts against observations (Murphy, key questions is crucial to advancing this rapidly developing area of
1993), but also an understanding of users’ perceptions of forecast ac research and meteorological application. This study, and the ongoing
curacy at the geographic and temporal scale relevant for a particular African SWIFT S2S testbed, will form a basis of evidence that the co-
decision-making process. Co-production supports this shift towards production of sub-seasonal forecast products supports potentially ‘use
jointly developing new decision-relevant weather and climate knowl ful’ S2S information to become ‘usable’ and ‘used’ by forecast users
edge (Bremer and Meisch, 2017, Vincent et al., 2018, Visman et al., (Boaz and Hayden, 2002; Lemos et al., 2012).
2018, Bremer et al., 2019, Carter et al., 2019). The data and methodology section outlines details from the kick-off
However, co-production is not merely a consultation with interested workshop and testbed case studies. The results and discussion section
stakeholder groups to find an application of existing science or, in this draws on insights from this data to answer the first two research ques
case, forecast information. Rather, done appropriately, it demands a tions. Finally, the lessons learnt through this co-production process are
new and potentially uncomfortable approach to knowledge creation. Co- drawn together as the main conclusions of the study.
production shifts away from a ‘one-way’ supply of scientific information
towards a ‘two-way’ demand-led iterative process (Kirchhoff et al., Data and methodology
2013, Vincent et al., 2018), with an improved collaborative partnership
between producers and users (Vaughan and Dessai, 2014). Sub-seasonal to seasonal (S2S) data
Historically, the link between developments in meteorological un
derstanding and forecasting and their ‘pull through’ to effective opera The GCRF African SWIFT project has been granted real-time access to
tional forecast products has been weak (Dilling and Lemos, 2011, Lemos the Subseasonal to Seasonal (S2S) Prediction project (Vitart et al., 2017)
et al., 2012). S2S forecasting, in particular, is in its infancy on the Af forecast data for a period of two years starting in November 2019. The
rican continent with many National Meteorological and Hydrological S2S Prediction project is a World Meteorlogical Organization project to
Services (NMHSs) currently producing limited forecasting information promote research into sub-seasonal prediction and prediction systems
on these timescales (White et al., 2017). However, by directly working and increase the uptake of sub-seasonal forecasts in user decision
with specific users in the co-production of weather and climate services, making. As part of this project it has produced a database of operational
a wide range of international, regional and national initiatives, the GCRF sub-seasonal predictions available with a 3 week lag for research pur
(Global Challenges Research Fund) African Science for Weather Infor pose. To demonstrate the social and economic value of S2S forecasts the
mation and Forecasting Techniques (SWIFT) project, are seeking to second phase of the S2S Prediction Project (World Meteorological Or
address these imbalances in access and usability (Hewitt et al., 2012, ganization, 2018) includes a time-limited (2 year) Real-time Pilot
Dinku et al., 2018, Nkiaka et al., 2019). Project which provides real-time access to forecasts in the S2S Project
Drawing on data from the kick-off workshop and initial activities of a database to enable feedback on the value of these forecasts in a real-time
sub-seasonal forecasting testbed – a forum where prototype forecast decision-making context, including aspects such as the timing and
products are co-produced and operationally trialled in real-time – this communication of the forecasts. African SWIFT is one of 16 projects
study considers: a) how co-production can influence the use of S2S taking part in this S2S Real Time Pilot Initiative.
Fig. 1. Schematic showing the sources of predictability and decision-making applications across timescales from weather forecasting (blue) to climate projections
(orange). Subseasonal to seasonal (S2S) timescale shown in grey. (For interpretation of the references to colour in this figure legend, the reader is referred to the web
version of this article.)
3
L. Hirons et al. Climate Services 23 (2021) 100246
The African SWIFT S2S testbed is using real-time forecast data from S2S forecasting testbed: structure, kick-off workshop and case studies
the operational configuration of the ECMWF model at 1.5◦ resolution
(Table 1). Following user feedback, weekly forecast initialisations are African SWIFT is using a two-year forecasting testbed as the context
downloaded on Mondays with the data available on Tuesdays for for co-producing new forecast information on S2S timescales. The S2S
product development. Model forecasts can have systematic biases which testbed is made up of representatives from the African SWIFT partner
need to be considered when interpreting the forecast. These biases can organisations and can be thought of as having 6 “O”perational groups
be estimated by creating a set of “re-forecasts” or “hindcasts” of previous (O1-O6; Table 2). These are comprised of pan-African (ACMAD1; Niger)
years and comparing them to an observed climatology. The hindcasts and regional (ICPAC2; Kenya) climate centres, as well as the NMHSs and
can then be used to provide a good estimate of the bias in the real-time partner Universities in the four partner countries: Ghana (GMet,
forecast. Consistent with the operational procedure at ECMWF, the three KNUST)3, Kenya (KMD, UoN) 4, Nigeria (NiMet, FUTA)5 and Senegal
closest hindcast initialisation dates are used to compute the climatology (ANACIM, UCAD)6. Activities are also supported by the African SWIFT
and subsequent anomalies for the forecasted variables. This gives a UK organisations (NCAS, UKCEH, UoR and UoL) 7. By supporting
larger, more statistically robust ensemble size of 33 for each hindcast operational forecasts through national and international collaborations,
year. and specifically between NMHSs, universities and users in partnering
countries, the African SWIFT testbed is aiming to foster the collaborative
Co-production approach partnerships required for successful co-production (Vaughen and Dessai,
2014).
The approach being followed during the African SWIFT S2S fore
casting testbed is based on the guiding processes and principles outlined Kick-off workshop
in the 2019 Manual: Co-production in African weather and climate A kick-off workshop for the forecasting testbed was held at the ICPAC
services (Carter et al., 2019). Informed by key literature and operational headquarters in Ngong, Kenya. The intense, week-long workshop was
best practice (Vincent et al., 2018; Bremer et al., 2019; Visman et al., held in November 2019 to coincide with the start of two years of access
2018), this manual drew together emerging experiences from across to real-time S2S forecast data. The workshop brought together forecast
regions, sectors and livelihood groups to identify emerging consensus users (10), operational forecast producers (11) and researchers (7) from
about the process and principles that have proved effective in enabling 7 African countries (Cameroon, Ghana, Kenya, Nigeria, Niger, Senegal
co-production of climate services to support specific decision-making and Uganda) across the 6 operational groups in Table 2, as well as re
contexts. Specifically, all the activities within the testbed have been searchers (10) from the UK, totalling 38 attendees. The forecast users
and will continue to be guided by the ten principles identified as un represented the agriculture, food security, energy and disaster risk
derpinning effective co-production: improve transparency of forecast management sectors. All these sectors are recognised in the GFCS as
accuracy and certainty; tailor to context and decision; deliver timely and having huge potential to benefit from improved S2S forecast products in
sustainable service; build trust; embrace diversity and respect differ their decision-making. See Tables S1 and S2 in supplementary material
ences; enhance inclusivity; keep flexible; support conscious facilitation; for details of kick-off workshop participants and affiliations. Following
communicate in accessible ways; and ensure value-add for all involved. the kick-off workshop regular testbed-wide and operational group vir
Furthermore, in order to develop reliable and actionable tools for tual interactions have continued between forecast users (8), operational
decision-making on sub-seasonal timescales, activities in the S2S fore forecast producers (14) and researchers (16).
casting testbed will be structured around the six building blocks of co- Data is drawn from the kick-off (KO) workshop and initial activities
production (Carter et al., 2019). A brief description of the six building described here. Details of each activity are given below, including the
blocks are provided below: main corresponding co-production building block. Activities are
B1. Identify key actors and build partnerships labelled and referred to as KO1-KO8 for clarity of discussion in the re
In order to form an effective basis for co-production, it is essential to sults section.
develop equitable, trust-based relationships. KO1: Pre-kick-off workshop user questionnaires were distributed
B2. Build common ground to the six identified key users from each operational group (Table 2; see
Develop a shared understanding, across actors, of the intention and S3 in supplementary material) to identify how S2S information could
desired outcomes of the co-production process. Consider competing potentially influence decision-making in their sector and specific
priorities, managing expectations and capacity development. decision-making context (B1, B2).
B3. Co-exploring needs KO2: A setting expectations discussion group aimed at co-
Cementing the relationships and understanding between actors. exploring how forecast users (10), forecast producers (11) and re
Creating a space where jointly defined issues can emerge. searchers (17) viewed their own and others’ roles in the co-production
B4. Co-developing solutions process (B2). Individuals were asked to articulate their own expecta
Solutions to the identified issues are developed through collaborative tions of the co-production process within an operational forecasting
knowledge exchanges with contributions from a variety of expertise testbed, as well as reflect on the potential expectations of other actors in
from across the actors. the process.
B5. Co-delivering solutions
Requires agreement about how to communicate the collaborative
outputs to ensure they are accessible; that cultural considerations have
1
been taken into account; and that all contributors are appropriately ACMAD: African Centre of Meteorological Applications for Development.
2
acknowledged. ICPAC: Intergovernmental Authority on Development (IGAD) Climate Pre
B6. Evaluate diction & Applications Centre.
3
Importance of scheduling regular time for reflection and monitoring. GMet: Ghana Meteorology Agency; KNUST: Kwame Nkrumah University of
Science and Technology.
Additionally, each co-production building block should be evaluative to 4
KMD: Kenya Meteorological Department; UoN: University of Nairobi.
enable regular review, ongoing feedback and highlight lessons learnt. 5
NiMet: Nigeria Meteorology Agency; FUTA: The Federal University of
These building blocks have been numbered here for clarity but, by Technology Akure.
design, should not be limited to occurring sequentially in this order. For 6
ANACIM: National Agency of Civil Aviation and Meteorology; UCAD: Uni
example, as stated in B6, each co-production building block should have versité Cheikh Anta Diop de Dakar.
an evaluative element. Furthermore, the entire co-production process is 7
NCAS: National Centre of Atmospheric Science; UKCEH: UK Centre of
iterative so many, if not all, of the blocks will occur more than once. Ecology and Hydrology; UoR: University of Reading; UoL: University of Leeds.
4
L. Hirons et al. Climate Services 23 (2021) 100246
Table 1
Table of specifications for the ECMWF S2S real-time data.
Forecast length Model Horizontal S2S Database Forecast ensemble Frequency Hindcast length Hindcast ensemble
[days] resolution Resolution size size
0–46 ≤day 15 16 km 1.5◦ 51 Bi-Weekly - every Monday and 20 years 11
>day 15 Thursday (2000–2019)
32 km
Table 2
Table of the 6 “O”perational groups (O1-O6).
O1 O2 O3 O4 O5 O6
Operational partner ACMAD ICPAC GMet KMD NiMet ANACIM
Location; Type Niger; pan-Africa Kenya; regional Ghana; NMHS Kenya; NMHS Nigeria; NMHS Senegal; NMHS
Supporting University – – KNUST1 UoN2 FUTA3 UCAD4
Key user organisation CAPC-AC5 FSNWG6 MoFA7 KenGen8 IFAD9 MWG10
Key user sector Disaster risk reduction Food security Agriculture Energy Agriculture Agriculture
1
KNUST: Kwame Nkrumah University of Science and Technology.
2
UoN: University of Nairobi.
3
FUTA: The Federal University of Technology, Akure.
4
UCAD: Université Cheikh Anta Diop de Dakar.
5
CAPC-AC: Centre d’Application et de Prévision Climatologique de l’Afrique Centrale.
6
FSNWG: Food Security and Nutrition Working Group.
7
MoFA: Ministry of Food and Agriculture.
8
KenGen: Kenya Electricity Generating Company PLC.
9
IFAD: International Fund for Agricultural Development.
10
MWG: Multi-disciplinary working group.
KO3: 4 sector-themed discussion groups for Agriculture (4 users, 3 Case studies
producers, 3 researchers), Food Security (1 user, 2 producers, 6 re As well as drawing on data from the kick-off workshop, results from
searchers), Energy (2 users, 2 producers, 4 researchers) and Disaster two case studies are used to support the findings of this study (B4). Case
Risk Reduction (4 users, 3 producers, 4 researchers) to co-explore sector study one is between a pan-Africa climate information producing insti
specific S2S needs (B3). These groups also discussed misunderstood tution (ACMAD) and a central Africa regional climate centre (CAPC-AC;
terminology which they had encountered (B2). O1, Table 2), hereafter referred to as “CS: CAfrClim”. Case study two is
KO4: Timelines of decision-making were developed within each between a national meteorological service (KMD) and a range of sub-
operational group to co-explore the annual context into which S2S in state urban flood risk decision-makers (O4; Table 2), hereafter
formation would be added. These outlined the timing of dry and wet referred to as “CS: KenFloodRisk”. These case studies are named after
seasons, important sector activities, key user decisions, and current their user application and have been purposely chosen to represent the
available forecast information (B3; see S4 in supplementary material for diverse collaborative partnerships that exist in the forecasting testbed.
an example). The pre-testbed status quo and co-developed solutions for each case
KO5: Country-level network maps were produced within the study are described below:
SWIFT partner countries of Kenya, Ghana and Nigeria to co-explore the
organisational governance context into which S2S information would be Case study 1: CS: CAfrClim
communicated (B5; see S5 in supplementary material for an example). Pre-testbed status quo: Forecasters at CAPC-AC provide sub-seasonal
KO6: Bi-annual questionnaires are distributed to forecast pro forecasts to support NMHSs for the Economic Community of the Cen
ducers and forecast users from each of the six operational groups. The tral African States (ECCAS) which comprises of eleven nations including
forecast producer questionnaire aims to understand if and how the new Angola, Burundi, Cameroon, Central African Republic, Chad, Demo
testbed products are being incorporated into operational procedure, as cratic Republic of Congo, Republic of the Congo, Equatorial Guinea,
well as capture how they have been iterated based on user feedback (see Gabon, Rwanda, and Sao Tomé and Principe. Current forecast products
S6 in supplementary material. The forecast user questionnaire aims to used at CAPC-AC include sub-seasonal predictions from National Cen
understand how the new testbed products are being used in the decision- ters for Environmental Prediction (NCEP) Climate Forecast System (CFS)
making context they were designed for (see S7 in supplementary ma version 2 (Saha et al., 2010) and National Oceanic and Atmospheric
terial). Results will be reported from the first round of responses (B6). Administration (NOAA) Subseasonal Experiment (SubX) project (Pegion
KO7: Operational co-production action plans were developed et al., 2019). Alongside predicted precipitation totals, diagnostics used
within each operational group to serve as a memorandum of under to inform forecasters include precipitable water, outgoing longwave
standing formalising the relationships for continued co-production radiation, tropospheric wind shear, and MJO (Zaitchik, 2017) charac
during the two-year testbed. These are based around the iterative co- teristics. The combination of all of these diagnostics from different
production building blocks (B1-B6), and include formalising the re modelling centres are used to produce a forecast of precipitation
sponsibility within the process for maintaining collaboration for product anomalies (Fig. 2). These anomalies are classified into five categories
development, communication, and evaluation (see S8 in supplementary and combined with the likelihood of the precipitation anomaly occur
material for an example). ring. Colours and numbers are used to highlight regions of substantial
KO8: Extensive notetaking by the testbed facilitating team precipitation anomalies. Currently, producing Fig. 2 requires a high
throughout the week’s activities, including making observations of the level of scientific expertise to subjectively combine different information
co-production process and having informal discussions with participants sources.
(B6). Co-developed solution: Within the testbed, a collaborative co-
production partnership has been formed between researchers at
5
L. Hirons et al. Climate Services 23 (2021) 100246
UKCEH and NCAS and forecast producers at ACMAD and CAPC-AC to settlement within Nairobi county. As part of the workshop, participants
jointly identify how access to real-time sub-seasonal forecast data can were shown the same sub-seasonal forecast information presented in
contribute to their weather and climate services. An additional, objec five different forms (A: graphical maps, B: text bulletin, C: line graph, D:
tive bulletin of extreme precipitation events has been added using the bar and whisker plot; E: Fig. 5(a)) and asked to rank them according to
ECMWF 51-member probabilistic forecast. To produce this product, the their level of usefulness (see S9 in supplementary material). The most
number of ensemble members with a weekly-accumulated precipitation useful product identified from this stakeholder workshop was spatial
anomaly within specified thresholds are counted. Figs. 3 and 4 show the maps of weekly precipitation (Figure A in S9), which are already being
iterative versions of the probability of weekly-accumulated precipitation routinely produced. Fig. 5 (a) shows the forecast product ranked second
anomalies in each threshold. most useful by the workshop participants. It shows the expected weekly
total rainfall from historical climatological data (light blue), the
Case study 2: CS: KenFloodRisk observed (dark blue) and forecast (red) weekly rainfall totals, including
Pre-testbed status quo: Prior to the S2S forecasting testbed, partici an indication of the forecast uncertainty (grey line).
pants from the ForPAc project, in collaboration with KMD, conducted a Co-developed solution: Fig. 5 (b) – (d) show the iterative versions of
stakeholder workshop in Nairobi County to identify the format of sub- expected weekly rainfall totals compared with observations for Nairobi
seasonal forecast products that users find most useful for their (36.5◦ E, 1.5◦ S). Fig. 5 (b) shows forecasted weekly (Sat-Fri) rainfall from
decision-making contexts. The one-day workshop had 18 in attendance; 4th April – 1st May 2020, initialised on 30th March (red), the hindcast
16 (13 forecast users and 3 forecast producers) participants and 2 fa ensemble average weekly rainfall climatology for the past 20 years
cilitators. The focus of the stakeholder workshop was flood risk forecasts (orange) and the forecast uncertainty (0th – 100th percentile within all
for Nairobi county with users drawn from the Nairobi city county gov forecast ensemble members; grey lines). Fig. 5 (c) incorporates TAMSAT
ernment sectors (Disaster risk management & coordination; roads, (Tropical Applications of Meteorology using SATellite data and ground-
transport & infrastructure), humanitarian sector (Kenya Red cross Nai based observations) satellite rainfall observations (Tarnavsky et al.,
robi branch), the media and community leaders from an informal 2014, Maidment et al., 2014) in the form of the historical climatology
Fig. 2. CAPC-AC sub-seasonal early warning information based on precipitation forecast for week commencing 26th March 2020, issued on 19th March 2020 (7-day
lead time). Weekly precipitation forecasts are given in mm/day. Colours indicate the level of risk based on the risk matrix of Impact (rainfall thresholds) versus
probability (expert judgement). Numbers from 1 to 10 indicate the probability associated with each threshold. Red indicates very high risk of well below normal
precipitation (e.g., loss of life and animals, food and water shortages); orange indicates high risk of below to well below normal precipitation (e.g., increase risk of
disease, air pollution and locusts); yellow indicates low risk of below normal precipitation (e.g., reduced dam water levels, increased tensions in the population); grey
indicates normal precipitation; green indicates above normal precipitation (e.g., economic losses, migration of people and animals); and dark green indicates a very
high risk of well above normal precipitation (e.g., flooding & landslides, loss of life and animals, increase risk of disease). (For interpretation of the references to
colour in this figure legend, the reader is referred to the web version of this article.)
6
L. Hirons et al. Climate Services 23 (2021) 100246
Fig. 3. Initial attempt of new forecast product displaying probabilities of anomalous weekly-accumulated precipitation in 51 ECMWF ensemble members. The
forecast product, initialised on 16th March 2020, shows probabilities on weekly-accumulated anomalous precipitation during weeks (left to right): 23–03-2020 to
30–03-2020 (7-day lead); 30–03-2020 to 06–04-2020 (14-day lead); and 06–04-2020 to 13–04-2020 (21-day lead).
Fig. 4. Current version of forecast product displaying probabilities of anomalous weekly-accumulated precipitation in 51 ECMWF ensemble members. The forecast
product, initialised on 16th March 2020, shows probabilities on weekly-accumulated anomalous precipitation during weeks (left to right): 23–03-2020 to 30–03-
2020 (7-day lead); 30–03-2020 to 06–04-2020 (14-day lead); and 06–04-2020 to 13–04-2020 (21-day lead). Grey shading denotes land regions with a zero prob
ability of extreme precipitation events.
7L. Hirons et al. Climate Services 23 (2021) 100246
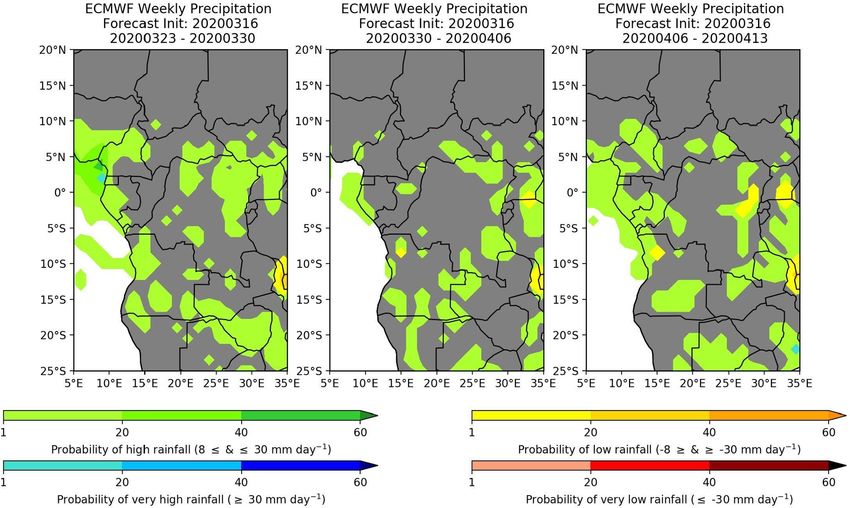
Fig. 5. The four major iterations in the development process for Nairobi weekly rainfall: from the initial user-guided KMD concept (a); the first production of a
weekly forecast bar chart (b); the amalgamation of the forecast, hindcast and observation data (c); and the latest iteration which includes the bias corrected weekly
forecast and observation data (d). Iterations (b), (c) and (d) are all for the Nairobi 1.5◦ grid box (centred at 36.5◦ E 1.5◦ S), with weekly ECMWF sub-seasonal forecasts
initialised 30th March 2020, with a 5 day lead, valid from Saturday 4th April to Friday 1st May 2020.
(2000–2019; light blue) and current years observations (dark blue). In plants” (O4). While the disaster risk reduction and food security sectors
Fig. 5 (d) a multiplicative scaling method has been applied to bias cor highlighted its potential for improving longer-term strategic planning
rect the forecast (red), it divides the observed climatology by the model (O1, O2; KO1). This supports the notion that improved access to S2S
hindcast climatology and multiplies the forecast by the result (Sperna weather information has huge potential to improve early warning sys
Weiland et al., 2010, Watanabe et al., 2012). tems, reduce weather-related vulnerability and build more resilient
livelihoods (Williams et al., 2015; Fig. 1). However, to realise this po
Results and discussion tential, it is recognised that forecast products have to be both reliable and
actionable (White et al., 2017) in the decision-making context of users
Co-producing sub-seasonal forecast products with forecast users, (Dilling and Lemos, 2011, Lemos et al., 2012).
forecast producers and researchers is an ongoing iterative process. It is For a forecast to be reliable it needs to exhibit meteorological skill.
time-consuming and involves many actors working in a way or context Researchers in the testbed have conducted a thorough assessment of the
which is (potentially) novel to them. Whilst the forecasting testbed is pan-African skill of S2S models (de Andrade et al., 2021, Endris et al.,
ongoing, this section draws on data collected from the kick-off work 2021) and shown that the ECMWF forecast system has the highest skill
shop, insights from extensive notetaking of the co-production process in predicting precipitation in weeks 1–2. While skill was lower for weeks
itself and case study examples to answer the first two research questions. 3 and 4, probabilistic forecasts were shown to have reasonable skill in
The third question on lessons learnt from the co-production process will wet regions during particular rainy seasons (e.g., East Africa; March -
be addressed in the conclusions. May rains). Furthermore, a reduction in forecast quality was observed
when the influence of large-scale drivers such as the MJO, Indian Ocean
Co-production within an S2S context Dipole (IOD) and El Niño Southern Oscillation (ENSO) were removed
(de Andrade et al., 2021). Therefore, we know that there is predictability
(a) How co-production can influence the use of S2S information in in the ECMWF forecasting system at these timescales, but the fact that
operational forecasting the skill can be dependent on the model (Endris et al., 2021), driven by
Co-production has the potential to increase the use and uptake of S2S the large-scale environment, and not geographically or temporally
information in operational forecasting. An emerging theme from the uniform (de Andrade et al., 2021), provides a significant meteorological
pre-kick-off forecast user questionnaires was the desire for improved communication challenge. Particularly because users highlighted terms
sub-seasonal forecast information on dry and wet spells within a rainy such as “large-scale driver”, “probabilistic” and “predictability” as all
season. Specifically, having access to such forecast information could requiring further explanation. To address this forecast producers moved
influence the “timing of planting, crop choices and varieties” as well as away from terms like “predictability” and “large-scale drivers” and
“prevent wastage” in the agriculture sector (O3, O5, O6). In the energy instead talked about their confidence in the forecast (KO3). Effectively
sector S2S information on dry and wet spells has potential to allow for communicating probabilistic forecasts, which still have reasonable skill
“appropriate scheduling of our [power] generation from the hydropower out to week 3 and 4 in some regions, remains an ongoing challenge.
8L. Hirons et al. Climate Services 23 (2021) 100246
Specifically, more research is required to understand the implications of decision-making identified potential gaps in existing forecast provi
that times and regions of lower forecast skill have on the co-production sion. Such decision-making calendars have been used in previous studies
process and products. to identify key entry points where seasonal information with a longer
Communicating the technical information in the forecast is not the lead time can support existing drought early warning systems (Mwangi
only challenge, the source or legitimacy of the information was also and Visman, 2020, Audia et al., 2021). In this context, the real-time S2S
deemed crucial for it to be reliable from a user’s perspective. Users data allowed the provision of weekly updates to complement existing
rightfully challenging “can I trust it?” and “is it better than what I already monthly and seasonal forecasts (O2; KO4, KO7).
know? when receiving new forecast products (KO3, KO8). As a project A third theme of user-guided iteration to improve application was in
piloting the use of real-time sub-seasonal information in operational the visualisation of forecast products. For example, in CS: CAfrClim the
forecasting these are very legitimate questions which will take careful use of grey shading for land regions with zero probability of substantial
monitoring, evaluation and learning (see Key challenges section) and rainfall anomalies was applied based on feedback to improve the clarity
can be more thoroughly answered in future studies which synthesise the of the product. Furthermore, during the stakeholder workshop in CS:
forecasting testbed results and experiences over the entire two years. KenFloodRisk users were shown the same sub-seasonal forecast infor
For a forecast to be actionable it needs to be relevant to the decision a mation in five different forms. Interestingly, a box and whisker plot,
user is trying to make. Drawing on data from the kick-off workshop and which is often favoured by researchers for displaying probabilistic in
the co-developed solutions outlined in CS: CAfrClim and CS: Ken formation, was ranked lowest by users for usefulness (Figure D in S9).
FloodRisk, there are many examples of user-guided iterations which Ranked highest were spatial maps (Figure A in S9) and bar graphs
have made testbed forecast products more actionable. Firstly, related to (Figure E in S9) of weekly precipitation. The former is already being
the spatial scale of the forecast product. Many users communicated in routinely produced as part of the testbed and the user-guided iterations
terest to access forecast products on a different spatial scale to those they of the latter are shown in Fig. 5. These findings show visualisation is a
first received (KO3). For example, in CS: CAfrClim there was a request to key factor influencing user interpretation, a finding common with the
reduce the domain size and focus on the central African nations relevant representation of longer-term climate information (Daron et al., 2021).
for the users’ decisions (Fig. 3 to Fig. 4). In CS: KenFloodRisk, for rele It also re-emphasised the need for the co-production of forecast products
vance to local flood risk forecasting, the request was for a location with users, rather than individual groups perpetuating the status quo.
specific forecast for Nairobi city as opposed to an area averaged version. A final, related, theme for making forecast products more actionable
To do this the closest model gridbox for Nairobi was chosen for analysis is their communication. For example, how a plot is labelled does not
(36.5◦ E, 1.5◦ S; Fig. 5). Feedback from forecast users has also revealed always make it clear to all groups what it shows. Nuances in terminology
that information from new forecast products is used “to further downscale such as ‘validation date’, ‘forecast date’ or ‘initialisation date’ created
the forecast to usable and farmer friendly formats” to improve their confusion (KO8) and highlighted the need for clarification and better
interpretation (KO6). These requests for scale-related adaptations have communication of existing and new forecast products. Communication
been implemented, however, it is important to identify the appropriate improvements can be very specific to a particular product, for example
scale for skilful sub-seasonal forecasting and the potential limitations in in CS: CAfrClim the thresholds used in Fig. 4 are user-defined and
further downscaling the forecast information (Young et al., 2020). In designed, for consistency and clear communication, to match the
many instances annotating spatial maps by adding county boundaries or existing bulletin (Fig. 2). Or, in CS: KenFloodRisk the difference between
the location of large cities was enough to address these issues without the model hindcast and the observations (Fig. 5(c)) caused confusion
inappropriately representing the information (KO8). and mis-interpretation of the information so showing a bias corrected
Secondly, a forecast can only be actionable if the product arrives in version (Fig. 5(d)) improved clarity considerably for users. In the case of
time. The ECMWF data is available on Mondays and Thursdays, with CS: KenFloodRisk having direct access to the real-time data allowed the
download and analysis time factored in this would mean forecast provision of a bias-corrected forecast, which took account of any sys
products becoming available on Tuesdays or Fridays. Following tematic biases in the model, and enabled users to directly compare the
consultation with the key testbed users (KO3, KO4), it was agreed that forecast with local observed rainfall. The requirement for bias-
weekly forecasts, rather than bi-weekly, were sufficient to avoid “in correcting or calibrating a forecast model is a complex communication
formation overload” (KO8), and that Tuesdays would leave more challenge in itself and takes considerable resource to apply in individual
‘working days’ to make and implement decisions. Therefore, weekly product applications.
forecast initialisations were continued on Mondays. Subsequent feed As well as the specific information shown in the product, commu
back from forecast users has reinforced that the forecasts were delivered nication challenges also relate to the context into which the forecast
with “perfect timing” for their decision-making purposes (KO6). That products will be delivered. This was explored through a country-level
said, changes can be made in the analysis stage to improve the appro network mapping exercise (KO5; see S5 in supplementary material for
priate application in a specific context. For example, in CS: CAfrClim the an example). One observation from this exercise was that in Kenya,
analysis of weekly precipitation probabilities were chosen to begin on following devolution, there are Directors of Meteorological Services
the Monday of each week to enable better integration of the product into appointed for each County that play a key role in supporting county
existing forecasting practices. This is important because it avoids government decision-making including through downscaling of weather
confusion and contradiction when users are faced with different forecast information and development of services to support county-specific
information from different sources. Further exploring the timing of the livelihood priorities. This is not currently the case in Ghana and
rainy seasons in different countries and the relevant sector-specific de Nigeria where forecast information is shared at a national level with the
cisions which would need to be made provided a framework for when sector ministry (e.g., Ministry of Food and Agriculture; MOFA) which
the important parts of the calendar year were in different regions and then disseminates to a regional level through MOFA. The advantages of
sectors (KO4, KO7; S4; Kenya Red Cross, 2019). For example, agricul the Kenyan model of County-level meteorological experts was recog
tural and food security forecast users explained the importance of nised and the potential for implementing a similar structure elsewhere
“acquisition of inputs (crop types, seeds etc) and land preparation” decisions was discussed (KO5). Investigating the impact of these organisational
ahead of the main rainy season (February in O2 in eastern Africa; March structures on the uptake of S2S forecast information should be a focus of
and April in O3 in southern and northern Ghana, respectively; K04). future research.
Later feedback from forecast users revealed that new S2S forecast The kick-off workshop activities and case study examples given in
products were indeed “helpful as [an] advisory service to farmers on setting this study highlight that co-production can be used to increase the
dates/times for land preparation activities, including procurement of inputs appropriate use of S2S information in operational forecasting in Africa,
such as manures, seeds, fertilizers etc” (KO6). Furthermore, these timelines provided they are reliable and actionable. Specifically, it has been
9L. Hirons et al. Climate Services 23 (2021) 100246
shown that forecasts can be made more actionable when users are subset of key users rather than a larger group in which the equitable,
included in discussions of scale, timing, visualisation, communication trust-based relationships required would be harder to build. Whilst the
and evaluation of products. Table 3 provides a summary of activities and small number of, largely technical, forecast users was a function of the
findings, across the building blocks of co-production, during the African initial S2S testbed design, it does present limitations in scaling up test
SWIFT testbed kick-off workshop. bed approaches and outputs to further their impact in wider and more
Collaboratively co-producing forecasts in this way may increase their remote regions. To address this issue, operational best practices and
appropriateness and uptake, however, it comes at a cost. It is time lessons learnt from the co-production process will be documented so
consuming and requires more personal commitment from individuals they can inform future research agendas and operational procedures.
within institutions than other modes of knowledge production (KO8;
Lemos et al., 2014). To account for this the S2S testbed identified a small Key challenges
(b) What key challenges there are in making the co-production of project-
Table 3 initiated S2S forecast products sustainable
Summary of initial testbed, and kick-off workshop, activities under each co- Many key challenges have already been encountered during the co-
production building block. production process within the African SWIFT S2S testbed. These are
Building block Summary of activities Summary of findings discussed below along the three emerging themes of process, sustain
B1: Identify key Pre-kick-off forecast user > Forecast users identified the ability and evaluation.
actors and questionnaires exploring importance of dry and wet
build the role of weather in user spells within a season. Process
partnership decision-making (KO1). > Timing of forecast delivery
It has been a considerable challenge incorporating widely differing
is crucial to its usefulness for
preparedness action.
views of co-production in the context of a real-time, operational testbed.
B2: Build Making explicit and > Misunderstandings in These differing views were clear at the outset of the S2S testbed (KO2).
common agreeing respective terminology should be Expectations of the users focused on the tailoring of products and the
ground expectations (KO2). challenged at the outset. improved timing of forecast delivery. Meanwhile, expectations of fore
> Highlighted differences in
cast producers and researchers centered around the examination of
expectations: forecast users
focused on timing and forecast skill, as well as the improvement of trust and use of their sci
communication; forecast ence. All actors had the expectation that the co-production process
producers and researchers would increase the use and uptake of S2S forecasts. This discussion
focused on skill. revealed that some testbed participants take a descriptive view (Bremer
B3: Co-exploring Sector-themed discussions > For users forecast reliability
needs (KO3). is strongly linked to legitimacy
et al., 2017) - that co-production embeds the existing power structures,
Timelines of sector-specific and trust. even after collaborative interactions between researchers, forecast pro
decision making (KO4). > Potential for improving ducers and users. This was particularly apparent in the comments of one
products by using user- forecast producer who suggested that users would be consulted, but not
defined, sector- and location-
co-conceptualise new products: “our intention is to come up with [our
specific thresholds.
own] working tools. I think that [the users’] contributions could only guide
> Weekly updates to forecast us to tailor our deliverables to something similar [to what we originally
information bridges a gap in conceived].” This view of co-production does involve user interaction,
existing operational forecast but only within the existing power structures and not with joint
products.
> Tailoring forecasts is far
ownership of the process (KO2, KO8). Other participants take the
more resource intensive than normative view (Bremer et al., 2017) - that co-production is a deliberate
producing generic products. aim of the participating actors to engage in a process which, by including
B4: Co- CS: CAfrClim > User-guided iterations to the new perspectives, increases knowledge for use in decision making. This
developing spatial scale, timing,
view was held by many users who expressed an expectation to have a
solutions CS: KenFloodRisk visualisation and
communication of information better understanding and ability to communicate the forecast products,
in forecast products can make through their involvement in the co-production process (KO2). In light
them more actionable. of these differing views, it was important to formalise the respective
> User-engagement can be roles of forecast producers and users in an operational co-production
more consultative at this stage
of the process.
action plan which served as a memorandum of understanding between
B5: Co- Network mapping of > Structural differences in groups involved (KO7, S8).
delivering communication structures communication networks While all groups had expectations to increase the uptake of S2S
solutions (KO5) across different regions forecast information (KO2), both descriptive and normative views of co-
influences the uptake of S2S
production were envisaged as pathways to do so. Understanding these
forecast information.
B6: Evaluate Evaluation of forecast skill ( > All groups should be different views of co-production, and the existing power structures in
de Andrade et al., 2021, included in ongoing which they are held (Daly and Dilling, 2019, Turnhout et al., 2020), will
Endris et al., 2021). monitoring, evaluation and help in addressing some of the barriers, at both individual and institu
Evaluation of learning in the co-production tional levels, to the uptake of forecast information and provide insight
communication through bi- process.
annual forecast producer > Iterative feedback process
into how it actually works in practice (Lemos et al., 2018). Specifically,
and user questionnaires more effective when sufficient Daly and Dilling (2019) argue a normative approach to co-production
(KO7) and diary keeping resource has been invested in can only be transformative if the inequalities in partnerships are
(KO8) relationship-building. addressed and all actors, particularly scientists, reflect on their own
> Need for strengthening users
practices to improve their productive engagement with other knowledge
understanding of probabilistic
information. systems; a process which will take considerable time and personal
> Need for strengthening commitment (Lemos et al., 2014).
producers’ and researchers’
ability to communicate Sustainability
technical concepts.
A major challenge within the S2S testbed is ensuring resources to
10You can also read