Clinico-radiological phenotyping and diagnostic pathways in childhood neurometabolic disorders-a practical introductory guide
←
→
Page content transcription
If your browser does not render page correctly, please read the page content below
Review Article on Pediatric Neuroradiology for Trainees and Fellows: An Updated Practical Guide

Clinico-radiological phenotyping and diagnostic pathways in
childhood neurometabolic disorders—a practical introductory guide
Asthik Biswas1,2, Mukul Malhotra3, Kshitij Mankad4, Olivia Carney4, Felice D’Arco4, Karthik Muthusamy3,
Sniya Valsa Sudhakar4
1
    Department of Diagnostic Imaging, The Hospital for Sick Children, Toronto, Ontario, Canada; 2Department of Medical Imaging, University of
Toronto, Toronto, Ontario, Canada; 3Department of Neurology, Christian Medical College, Vellore, India; 4Neuroradiology Unit, Great Ormond
Street Hospital NHS Foundation Trust, London, UK
Contributions: (I) Conception and design: A Biswas, K Muthusamy, SV Sudhakar; (II) Administrative support: K Muthusamy, SV Sudhakar;
(III) Provision of study materials or patients: A Biswas, K Muthusamy, SV Sudhakar; (IV) Collection and assembly of data: A Biswas, M Malhotra, K
Muthusamy, SV Sudhakar; (V) Data analysis and interpretation: A Biswas, M Malhotra, K Muthusamy, SV Sudhakar; (VI) Manuscript writing: All
authors; (VII) Final approval of manuscript: All authors.
Correspondence to: Sniya Valsa Sudhakar. Neuroradiology Unit, Great Ormond Street Hospital NHS Foundation Trust, London, UK.
Email: sniya.sudhakar@gmail.com.

                  Abstract: Inborn errors of metabolism (IEM) although individually rare, together constitute a significant
                  proportion of childhood neurological disorders. Majority of these disorders occur due to deficiency of an
                  enzyme in a specific metabolic pathway, leading to damage by accumulation of a toxic substrate or deficiency
                  of an essential metabolite. Early diagnosis is crucial in many of these conditions to prevent or minimise brain
                  damage. Whilst many of the neuroimaging features are nonspecific, certain disorders demonstrate specific
                  patterns due to selective vulnerability of different structures to different insults. Along with clinical and
                  biochemical profile, neuroimaging thus plays a pivotal role in differentiating metabolic disorders from other
                  causes, in providing a differential diagnosis or suggesting a metabolic pathway derangement, and on occasion
                  also helps make a specific diagnosis. This allows initiation of targeted metabolic and genetic work up and
                  treatment. Familiarity with the clinical features, relevant biochemical features and neuroimaging findings of
                  common metabolic disorders to facilitate a prompt diagnosis cannot thus be overemphasized. In this article,
                  we describe the latest classification scheme, the clinical and biochemical clues and common radiological
                  patterns. The diagnostic algorithm followed in daily practice after clinico-radiological phenotyping is alluded
                  to and illustrated by clinical vignettes. Focused sections on neonatal metabolic disorders and mitochondrial
                  disorders are also provided. The purpose of this article is to provide a brief overview and serve as a practical
                  primer to clinical and radiological phenotypes and diagnostic aspects of IEM.

                  Keywords: Inborn errors of metabolism (IEM); childhood; neuroimaging; brain; magnetic resonance imaging
                  (MRI)

                  Submitted Nov 02, 2020. Accepted for publication Jan 18, 2021.
                  doi: 10.21037/tp-20-335
                  View this article at: http://dx.doi.org/10.21037/tp-20-335

Introduction                                                                   partial enzyme deficiencies, or defects in transporters, which
                                                                               lead to clinical manifestations from either accumulation of
Disorders of inborn errors of metabolism (IEM), though                         toxic products or lack of an essential end product. Clinical
individually rare, account for a large number of children                      manifestations are heterogeneous and often non-specific,
presenting with a spectrum of neurological manifestations                      and can result from the involvement of multiple organ
in clinical practice. IEMs are usually caused by complete or                   systems.

© Translational Pediatrics. All rights reserved.                         Transl Pediatr 2021;10(4):1201-1230 | http://dx.doi.org/10.21037/tp-20-335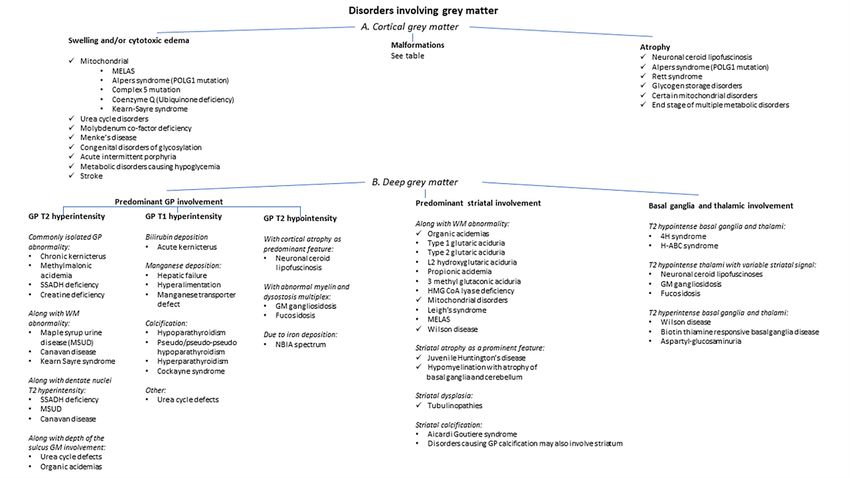
1202                                                     Biswas et al. Clinico-radiological phenotyping of neurometabolic disorders

   Even as increasing data from genomics, metabolomics                Classification
and transcriptomics evolve, the clinico-radiologic
                                                                      Small molecule disorders
phenotyping continues to hold a pivotal role in integration
                                                                      Disorders of small molecules in IEMs involve small,
and accurate interpretation of the data. The role of
                                                                      diffusible and water soluble molecules. Abnormal
neuroimaging is manifold, and includes raising the
                                                                      metabolites in this group of disorders can be easily
possibility of a metabolic disease process, narrowing down
                                                                      measured in various body fluids. Most of these disorders
the differential diagnoses based on pattern recognition,
                                                                      are amenable to treatment and are divided into two major
and occasionally providing a specific diagnosis. Imaging
                                                                      subcategories.
also has a role in prognostication and follow-up. The
                                                                      (I) Accumulation of small molecules
implications are widespread, encompassing diagnosis and
                                                                      Accumulation of small molecules causes acute or
timely management of the metabolic derangement thereby
                                                                      progressive symptoms resulting from the accumulation
minimising permanent neurological damage, facilitation
                                                                      of the metabolites proximal to the block. Manifestations
of targeted testing and therapy, and initiation of genetic
counselling. Role of imaging as a biomarker should also be            occur after a varying symptom-free period and are often
emphasised as we enter the era of treatment and precision             precipitated by intercurrent illness, food intake or fasting.
medicine for these disorders.                                         This group of disorders generally do not hamper fetal
   There are a number of ways to approach a suspected case            development. Most disorders are treatable by reducing the
of neurometabolic disorder. Pioneering work on pattern                toxic metabolites using special formulae, scavengers, and
recognition and radiological approach has been performed              supplementation of cofactors. Classic IEMs such as amino-
by van der Knaap and Valk (1), and Barkovich (2) in this              acidurias, organic acidurias and urea cycle defects belong to
regard. In this article we provide a comprehensive initial            this category.
approach to categorize, and summarize the most clinically             (II) Deficiency of small molecules
and radiologically relevant aspects of this group of diseases.        Deficiency of small molecules may occur due to defective
We also provide a focused review of antenatal and neonatal            synthesis of compounds distal to the metabolic block, or by
onset group of disorders, and mitochondrial cytopathies.              defects in transport mechanisms. Disorders in this subgroup
                                                                      primarily affect neurodevelopment and may present with
                                                                      developmental malformations and birth defects. This group
Definition and classification                                         of disorders share many attributes in common with complex
Revolution in molecular diagnostics has led to a paradigm             molecule disorders and also mimic chronic genetic non-
shift in our approach and definition of IEM. Any disorder             metabolic encephalopathies. Defective transport of essential
with impairment of specific enzymes or biochemical                    molecules through cellular membranes, inborn errors
pathways intrinsic to the pathomechanism can be labelled              of non-essential amino acid and fatty acid synthesis, and
as an IEM, and the need for detection of an abnormal                  neurotransmitter deficiency disorders are included in this
metabolite is no longer necessary (3).                                group.
   Symptoms of neuro-metabolic disorders usually relate
to decreased or abnormal formation of a protein that                  Complex molecule disorders
interferes with the normal function of the brain, either              Disorders of complex molecules occur due to defective
directly or indirectly. The deficiency or accumulation of             metabolism of water insoluble and non-diffusible large
these metabolites, or their specific role in signalling, energy       complex molecules. This group of disorders can be
metabolism or brain development contributes to disease                subcategorized into three groups as follows.
phenotype.                                                            (I) Accumulation of complex molecules
   To translate the daunting complexity and increasing                Defective breakdown of complex molecules leads to storage
number of IEMs and increase the bedside clinical                      of the material proximal to the block in lysosomes or in
usability, a classification based on clinical, diagnostic and         the cytoplasm leading to clinical manifestations. Clinically,
pathophysiological approach has been put forward by                   these present as progressive disorders with late onset
Saudubray et al. (4). It classifies IEM into the following            neurodegeneration with or without signs of storage disease.
groups.                                                               Antenatal manifestations are rare, though hydrops and

© Translational Pediatrics. All rights reserved.                  Transl Pediatr 2021;10(4):1201-1230 | http://dx.doi.org/10.21037/tp-20-335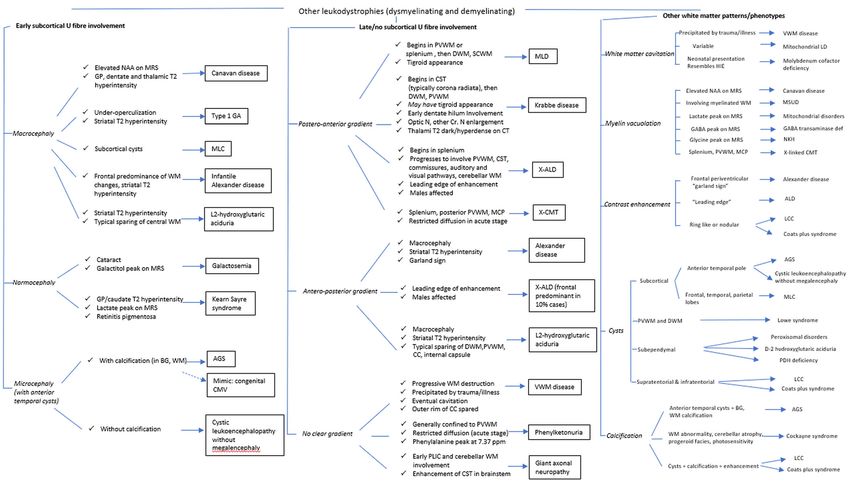
Translational Pediatrics, Vol 10, No 4 April 2021                                                                                              1203

malformations may be seen in severe forms. Lysosomal                           pathway that is compromised. Although neurological
storage disorders are amongst the disorders in this group.                     symptoms comprise the predominant manifestation, these
(II) Deficiency of complex molecules                                           are rarely isolated and there are exceptions. Moreover,
These disorders occur due to defective synthesis of                            findings are usually across the spectrum in both severity
complex molecules. Neurodevelopmental abnormalities                            and the systems involved. Age at presentation further
and neuroregression are usually seen and antenatal                             limits the repertoire of clinical manifestation. Other factors
malformations are common. Most common disorders in this                        which influence the clinical presentation include baseline
group include cholesterol and bile acid synthesis defects,                     nutritional status, magnitude of the precipitating factors
glycogen depletion syndromes, fatty acid synthesis disorders                   including intercurrent illness, diet change, supportive
and certain peroxisomal disorders.                                             therapy, and genetic modifiers. Clinical manifestations
(III) Cellular trafficking and processing disorders                            range from antenatal onset disorders with malformations,
This rapidly expanding group of disorders include defective                    fulminant neonatal encephalopathy, to later onset and milder
post-translational modifications, defective trafficking,                       phenotypes. Clinical course may also vary with intermittent
processing of complex molecules, and synaptic vesicle                          decompensations returning to normalcy, step ladder
disorders. Congenital disorders of glycosylation (CDG)                         pattern of worsening, chronic progressive recruitment of
comprise the most common disorder in this subgroup.                            symptoms, and also spontaneous improvement of various
                                                                               clinical manifestations. Differentiating primary neurological
Disorders of energy metabolism                                                 involvement versus neurological involvement as an
Deficiency in energy production or utilization in various                      endpoint of various other system involvements is the key
tissues leads to this important group of inherited metabolic                   factor in approach and management. Neurological and non-
disorders. Typically, recurrent episodes of metabolic                          neurological clinical clues are listed in Tables 1 and 2.
crisis are triggered by catabolic states. Embryological
development is rarely affected. This group is further divided
                                                                               Biochemical testing
into three subgroups.
(I) Membrane carriers of energetic molecules                                   Most IEMs have measurable abnormal metabolites in
This includes defective transport of various precursors of                     body fluids that can be detected through specialized
energy like glucose, lactate, pyruvate and ketone bodies (e.g.,                biochemical laboratories. Collection of critical samples
GLUT1 and MCT1 defects).                                                       and transportation to the laboratory under appropriate
(II) Cytoplasmic energy defects                                                conditions is important for meaningful interpretation
D e f ec t s in g lyc o lys i s , g l u c o neo g enes i s , g l y cogen       of results. The magnitude of abnormalities may vary
metabolism, pentose phosphate pathway and disorders of                         depending on time of sampling, nutritional status, dietary
creatine metabolism constitute this subgroup.                                  supplements, treatment received and the genotype.
(III) Mitochondrial defects                                                    Initial work-up performed emergently for children with
Mitochondrial disorders are the most common form of                            suspected IEM include blood counts, electrolytes, glucose,
inherited metabolic disorders and have a wide spectrum                         acid base status, ketones, liver and renal function tests,
of clinical presentation. These typically involve multiple                     lactate, ammonia, uric acid, urine ketones and reducing
organ systems, predominantly those with high energy                            substances (5). Empiric treatment based on these labs
requirements such as the brain, visual and auditory function,                  should be instituted urgently to ameliorate neurologic
skeletal muscles, liver and heart. Congenital lactic acidosis,                 sequelae and prevent death. Further focused testing which
respiratory chain defects, fatty acid oxidation disorders and                  help guide ongoing clinical management are plasma
defective mitochondrial maintenance and expression are                         aminoacidogram, urine organic acid analysis, carnitine
common disorders in this group. Schematic representation                       and acyl carnitine profile, transferrin isoelectric focusing,
of this classification with examples of the disorders are                      lysosomal enzymes, very long chain fatty acids, pyruvate,
depicted in detail in Figure 1.                                                urine mucopolysaccharides and oligosaccharides, porphyria
                                                                               metabolites, guanidinoacetate, cerebrospinal fluid (CSF)
                                                                               glucose and neurotransmitters, and urine cholesterol
Clinical phenotyping
                                                                               metabolites. High anion gap acidosis and mildly elevated
Clinical symptoms depend on the particular metabolic                           ammonia suggest organic acidemias which can be further

© Translational Pediatrics. All rights reserved.                           Transl Pediatr 2021;10(4):1201-1230 | http://dx.doi.org/10.21037/tp-20-335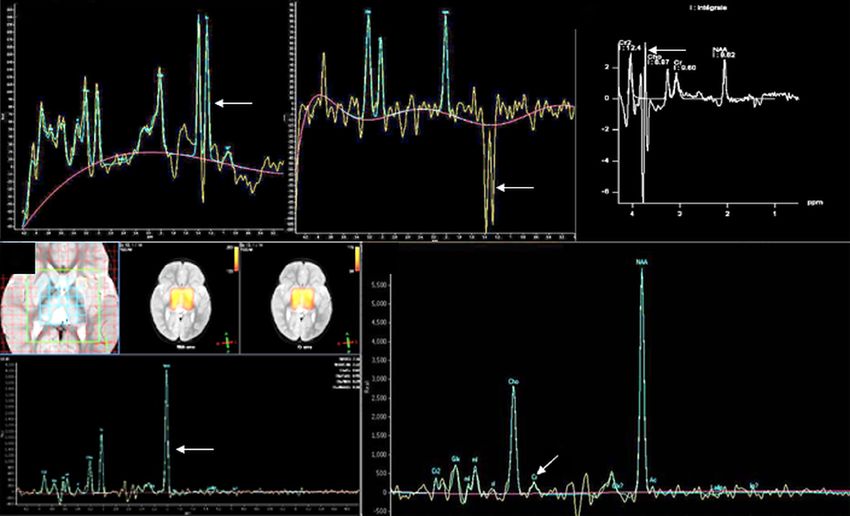
1204 Biswas et al. Clinico-radiological phenotyping of neurometabolic disorders
Small molecules Complex molecules Energy Depletion
Accumulation Deficiency Accumulation Deficiency Cell processing Cytoplasmic Mitochondrial Membrane carriers of
& trafficking energy defects defects energetic molecules
Disorders of amino acid Serine synthesis defects Glycogenoses Peroxisomal Congenital GLUT 1 defect Glycolysis, Congenital lactic acidosis
catabolism: disorders disorders of glycogen • Pyruvate transporter
Glutamine synthetase defect Lafora disease Cerebral
• Phenylketonuria glycosylation (CDG) metabolism and deficiency
• Maple syrup urine Plasmalogen creatine
Asparagine synthetase deficiency Peroxisomal disorders: • Disorders of gluconeogenesis • Pyruvate dehydrogenase
disease synthesis defects deficiency
• X-ALD N-glycosylation, defects system, and Krebs cycle
• Homocystinuria Lysinuric protein intolerance syndromes
• Refsum disease Fatty acid synthesis O-Glycosylation, lipid defects
Urea cycle defects Hartnup disease Pentose
• Zeliweger syndrome and remodelling glycosylation Monocarboxylic
Organic acidurias: phosphate Other mitochondrial
• Methylmalonic acidemia Neurotransmitters defects: defect • GPI anchor acid transporter
Mucopolysaccharidosis pathway defects disorders
• Propionic academia • Phenylalanine and biopterin deficiency 1 defect
Smith-Lemli-Opitz • Mitochondrial
Niemann-Pick disease Cerebral creatine
• Isovaleric acidemia defects • Dolichol related
syndrome respiratory-chain disorders
• Glutaric aciduria type 1 • GABA related disorders Wolman disease deficiency
disorders
Catabolic disorders of Cerebrotendinous • Mitochondrial transporters
• Non-ketotic hyperglycinemia syndromes
purines and pyrimidines Sphingolipidosis xanthomatosis Ribosomopathies of energetic and other
and salvage pathway Purine and pyrimidine synthesis indispensable molecules
Neuronal ceroid Squalene synthase Aminoacyl tRNA
defects defects • Coenzyme Q biosynthesis
lipofuscinosis deficiency synthetase
Metal accumulation:
Manganese transporter • Defect in mitochondrial
• Wilson disease Oligosaccharidosis deficiencies
Glycosaminoglycans assembly factors and
• NBIA syndromes deficiency syndrome
Sialidosis synthesis disorders DNA repair and electron carriers
• Hypermanganesemia Copper deficiency syndromes:
methylation defects • Defects in mtDNA
Disorders of vitamins and • Menkes disease, Mucolipidoses
cofactors: • MEDNIK syndrome Congenital maintenance and expression
• Intracellular cobalamin disorders of • Mitochondrial aminoacyl
defects Thiamine and riboflavin
autophagy tRNA synthetase defects
• Pyridoxine dependent transporter defects
epilepsy Synaptic vesicle Fatty acid oxidation defect
Galactosemia recycle disorders Ketogenesis and Ketolysis
Metabolite repair defects:
defects
• D2/L2 hydroxy-glutaric
aciduria Thiamine and Biotin
Porphyrias metabolism defects
Nitrogen containing compounds
Metal
Vitamin
Carbohydrate
Tetrapyrrole
Storage
Peroxisomal
Lipids
Congenital disorders of glycosylation
Mitochondrial disorders of energy metabolism
Figure 1 Schematic representation of classification with examples of disorders.
confirmed by urine organic acid analysis. Hypoglycemia are identified only during acute crises and there are several
without ketosis points to a fatty acid oxidation defect which disorders with low excretors irrespective of clinical status.
can be further categorized based on plasma carnitine and In these scenarios, molecular testing helps in establishing
acyl carnitine profile. Persistently elevated lactate with the diagnosis.
normal perfusion points to a mitochondrial disorder. Highly
elevated ammonia suggests urea cycle disorder which Radiological phenotyping
may be further delineated by aminoacidogram. Further
advanced testing includes functional assays from fibroblast The concept of selective vulnerability and utilization of
cultures, estimation of mitochondrial complexes, expanded pattern recognition
metabolomics, lipidomics, glycomics and proteomics. Selective vulnerability refers to the susceptibility of certain
Molecular diagnosis is eventually needed in most cases to anatomic structures to particular toxic stimuli. The pattern
confirm the diagnostic suspicion, to predict prognosis and of involvement in the brain therefore offers clues to the
treatment response, estimate risk of recurrence, and for pre- possible underlying metabolic derangement; some of which
implantation diagnosis for future pregnancies in the family. are pathognomonic, some suggestive, and others non-
Several disorders demonstrate abnormal metabolites which specific. The pattern of involvement depends on the stage
© Translational Pediatrics. All rights reserved. Transl Pediatr 2021;10(4):1201-1230 | http://dx.doi.org/10.21037/tp-20-335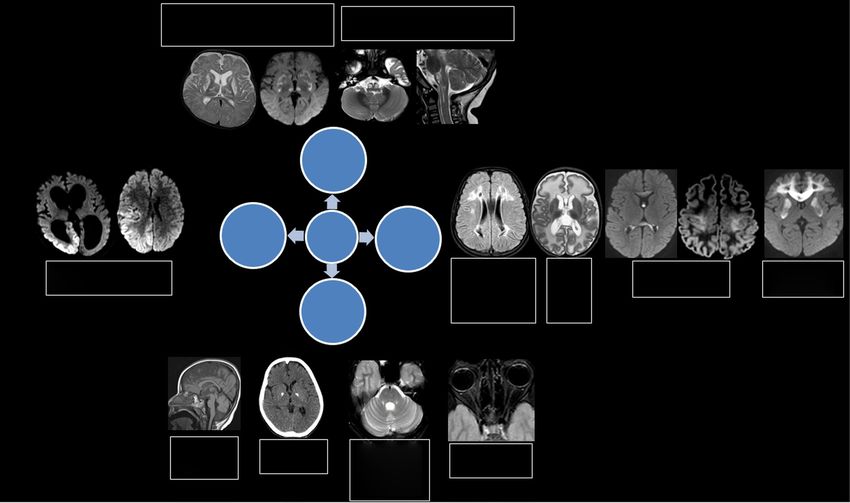
Translational Pediatrics, Vol 10, No 4 April 2021                                                                                         1205

 Table 1 Neurological symptoms and clues in IEMs
 Clinical manifestations     Disorders

 Acute encephalopathy        Organic acidurias

                             Amino acidurias

                             Urea cycle defects

                             Fatty acid oxidation defects

                             Primary lactic acidosis (pyruvate dehydrogenase deficiency, pyruvate carboxylase deficiency, mitochondrial
                             respiratory chain defects)

                             Non-ketotic hyperglycinemia

                             Molybdenum cofactor deficiency

                             Sulfite oxidase deficiency

 Progressive                 Lysosomal (Niemann-Pick disease, Gaucher disease, NCL, Krabbe disease, metachromatic leukodystrophy,
 neurodegeneration           GM1 and GM2 gangliosidosis)

                             Mitochondrial (MELAS, MERRF, mitochondrial DNA depletion syndromes)

                             NBIA

                             ALD

                             MEGDEL

                             Metal accumulation disorders

 Epilepsy                    GLUT-1 deficiency

                             Pyridoxine dependent epilepsy

                             Pyridoxal-5-phosphate responsive epilepsies

                             Folinic acid responsive epilepsy

                             Serine synthesis defects

                             Non-ketotic hyperglycinemia

                             Peroxisomal disorders

                             Sulfite oxidase deficiency

                             Molybdenum cofactor deficiency

                             Respiratory chain disorders

                             Menkes disease

                             Mitochondrial disorders (POLG, MERRF)

                             NCL

                             Metal accumulation defects

                             CDG syndromes

                             Cerebral creatine deficiency syndromes

 Stroke                      Homocystinuria

                             Fabry disease

                             AGS

 Table 1 (continued)

© Translational Pediatrics. All rights reserved.                      Transl Pediatr 2021;10(4):1201-1230 | http://dx.doi.org/10.21037/tp-20-335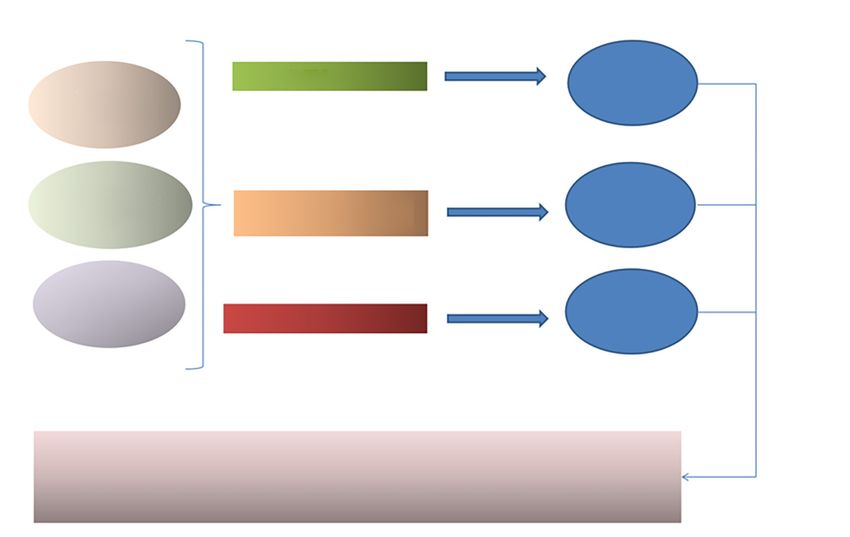
1206                                                           Biswas et al. Clinico-radiological phenotyping of neurometabolic disorders

 Table 1 (continued)

 Clinical manifestations     Disorders

 Stroke like episodes        Urea cycle disorder

                             CDG

                             MELAS

                             Methylmalonic acidemia

                             Propionic acidemia

                             Isovaleric acidemia

 Hypotonia                   Congenital lactic acidosis

                             Peroxisomal disorders

                             Non-ketotic hyperglycinemia

                             Urea cycle defects

                             Sulfite oxidase deficiency

                             Lowe syndrome

                             Pompe disease

                             Primary carnitine deficiency

                             Fatty acid oxidation defects

                             Primary coenzyme Q10 deficiency

                             CDG syndromes with congenital myasthenic syndrome

 Spasticity                  Sulfite oxidase deficiency

                             Hyperornithinemia, hyperammonemia, homocitrullinuria

                             Arginase deficiency

                             Homocysteine remethylation defects

                             ALD

                             Krabbe disease

                             Canavan disease

                             Metachromatic leukodystrophy

                             Complex lipid defects

 Table 1 (continued)

© Translational Pediatrics. All rights reserved.                      Transl Pediatr 2021;10(4):1201-1230 | http://dx.doi.org/10.21037/tp-20-335
Translational Pediatrics, Vol 10, No 4 April 2021 1207
Table 1 (continued)
Clinical manifestations Disorders
Dystonia-Parkinsonism Neurotransmitter defects
and other movement
Cerebral creatine deficiency syndromes
disorders
Leigh disease
Lesch-Nyhan syndrome
Glutaric aciduria type 1
Biotin thiamine responsive basal ganglia disease
Cerebral folate deficiency
GLUT 1 deficiency
Wilson disease
Manganese transporter deficiency
NBIA
Late onset GM1 gangliosidosis
Ataxia Ataxia with vitamin E deficiency
Refsum disease
CDG syndromes
Niemann-Pick disease
Complex lipid defects
Cerebrotendinous xanthomatosis
Mitochondrial disorders
Hartnup disease
Abetalipoproteinemia
Primary coenzyme Q10 deficiency
Intermittent forms of MSUD
NCL
GLUT-1 deficiency
Lafora disease
Table 1 (continued)
© Translational Pediatrics. All rights reserved. Transl Pediatr 2021;10(4):1201-1230 | http://dx.doi.org/10.21037/tp-20-3351208 Biswas et al. Clinico-radiological phenotyping of neurometabolic disorders
Table 1 (continued)
Clinical manifestations Disorders
Neuropathy Peroxisomal disorders
Homocysteine remethylation defects
Complex lipid defects
LCHAD
Krabbe disease
MLD
Cockayne syndrome
CDG
Mitochondrial disorders
Riboflavin transporter disorders
Porphyria
Sorbitol dehydrogenase deficiency
Myopathy Muscle glycogenoses
Disorders of long chain fatty acid and carnitine metabolism
Lipin-1 deficiency
Mitochondrial disorders
Myoadenylate deaminase deficiency
CDG
Microcephaly NCL
Alpers syndrome (POLG1 mutation)
Sulfite oxidase deficiency
Molybdenum cofactor deficiency
Chondrodysplasia punctata
Multiple sulfatase deficiency
Dihydropyrimidine dehydrogenase deficiency
Trichothiodystrophy
Amino acid synthesis disorders: serine, asparagine, and glutamine synthetase deficiencies
Methylene tetrahydrofolate reductase deficiency
GLUT 1 deficiency
Menkes disease
Macrocephaly Alexander disease
Canavan disease
Glutaric aciduria type 1
L2-hydroxyglutaric aciduria
Megalencephalic leukoencephalopathy with subcortical cysts
Table 1 (continued)
© Translational Pediatrics. All rights reserved. Transl Pediatr 2021;10(4):1201-1230 | http://dx.doi.org/10.21037/tp-20-335Translational Pediatrics, Vol 10, No 4 April 2021 1209
Table 1 (continued)
Clinical manifestations Disorders
Eye manifestations External ophthalmoplegia (mitochondrial disorders, biotin thiamine responsive basal ganglia disease)
Gaze palsy (Niemann-Pick disease, Gaucher disease)
Behavioral/psychiatric Urea cycle disorder
manifestations
Homocystinuria
Hartnup disease
SSADH deficiency
Smith-Lemli-Opitz syndrome
Cerebral creatine deficiency syndromes
Porphyrias
Lesch-Nyhan syndrome
Adenylosuccinate lyase deficiency
Phenylketonuria
Sanfilippo syndrome
Wilson disease
Niemann-Pick type C disease
Juvenile/adult onset metachromatic leukodystrophy
Cobalamin C disease
Late onset GM2 gangliosidosis
AGS, Aicardi Goutieres syndrome; ALD, adrenoleukodystrophy; CDG, congenital disorders of glycosylation; LCHAD, long-chain
3-hydroxyacyl-CoA dehydrogenase deficiency; MEGDEL, 3-methylglutaconic aciduria, deafness, encephalopathy, and Leigh-like
disease; MELAS, mitochondrial encephalopathy lactic acidosis and stroke like episodes; MLD, metachromatic leukodystrophy; NBIA,
neurodegeneration with brain iron accumulation; NCL, neuronal ceroid lipofuscinosis; POLG, DNA polymerase subunit gamma deficiency;
SSADH, succinic semialdehyde dehydrogenase deficiency.
Table 2 Non-neurological clues in IEMs
Predominant system involvement Associated disorders
Abnormal odours Glutaric acidemia (type II): sweaty feet, acrid
Hawkinsinuria: swimming pool
3-Hydroxy-3-methylglutaric aciduria: cat urine
Isovaleric acidemia: sweaty feet, acrid
Maple syrup urine disease: maple syrup
Hypermethioninemia: boiled cabbage
Multiple carboxylase deficiency: tomcat urine
Phenylketonuria: mousy or musty
Tyrosinemia: boiled cabbage, rancid butter
Table 2 (continued)
© Translational Pediatrics. All rights reserved. Transl Pediatr 2021;10(4):1201-1230 | http://dx.doi.org/10.21037/tp-20-3351210 Biswas et al. Clinico-radiological phenotyping of neurometabolic disorders
Table 2 (continued)
Clinical manifestations Disorders
Metabolic acidosis With ketosis: organic acidurias, MSUD, MCD, pyruvate carboxylase deficiency, respiratory chain de-
fects, ketolysis defects, MCT, gluconeogenesis defects
Without ketosis: pyruvate dehydrogenase deficiency, Ketogenesis defects, Fatty acid oxidation
disorder, fructose 1-6 diphosphatase
With hyperammonemia: urea cycle defects, HHH syndrome, LPI
With hypoglycemia: gluconeogenesis defects, MSUD, HMG-CoA lyase, FAO
Respiratory alkalosis With hypoglycemia: FAO (MCAD), HMG-CoA lyase
Dysmorphic features Smith-Lemli-Opitz syndrome, peroxisomal disorders, mucopolysaccharidosis, oligosaccharidosis,
sialidosis, CDG
Skin/connective tissue Ichthyosis: peroxisomal disorders, complex lipid defects (MEDNIK, CEDNIK, Sjogren-Larsson
syndrome), CDG
Hair signs: Menkes, LPI, argininosuccinic aciduria, argininemia, biotin responsive multiple carboxylase
deficiency (MCD)
Bone dysplasia: peroxisomal disorders, MPS, mucolipidosis, cholesterol synthesis defects, complex
lipid defects, O-CDG
Eye Retinopathy: mitochondrial, peroxisomal, CDG, LSD (GM1, NCL), complex lipid defects, Vit E, LCHAD
Cataracts: galactosemia, LPI, peroxisomal, complex lipid defects (Lowe, ELOV4, Chanarin-Dorfman,
Sjogren-Larsson, CTX, Sengers)
Ectopia lentis: homocystinuria, sulfite oxidase deficiency
Optic atrophy: energy disorders (mitochondrial disorders, OA, PDH, MCD), LSD, NCL, Canavan,
Pelizaeus Merzbacher, CDG, complex lipid defects, ATP1A3 (CAPOS)
Visceral: liver, spleen, lungs Lysosomal storage disorders: Gaucher, Niemann-Pick, MPS, GM1 gangliosidosis
CDG syndromes
Peroxisomal disorders
Complex lipid defects: Chanarin-Dorfman, Mevalonate kinase
Muscle/heart Mitochondrial
CDG
Organic acidurias
Fatty acid oxidation: LCHAD, trifunctional protein
Complex lipid defects: Lipin1, Sengers, choline kinase
Coagulopathies Homocystinurias
CDG, congenital disorder of glycosylation; CTX, cerebrotendinous xanthomatosis; CAPOS, cerebellar ataxia, areflexia, pes cavus, optic
atrophy and sensorineural hearing loss; CEDNIK ,Cerebral dysgenesis, neuropathy, ichthyosis and keratoderma; NCL, neuronal ceroid
lipofuscinosis; FAO, fatty acid oxidation; HHH, hyperornithinemia, hyperammonaemia, homocitrullinuria; HMG-CoA, 3-hydroxy-3-
methylglutaryl coenzyme A; LCHAD, long-chain 3-hydroxyacyl-CoA dehydrogenase; LPI, lysinuric protein intolerance; LSD, lysosomal
storage disorders; MCD, multiple carboxylase deficiency; MCT, monocarboxylic acid transporter; MCAD, medium-chain acyl-CoA
dehydrogenase; MEDNIK, Mental retardation, Enteropathy, Deafness, peripheral Neuropathy, Ichthyosis, Keratodermia; MSUD, maple
syrup urine disease; MPS, mucopolysaccharidoses; OA, organic acidurias; PDH, pyruvate dehydrogenase.
© Translational Pediatrics. All rights reserved. Transl Pediatr 2021;10(4):1201-1230 | http://dx.doi.org/10.21037/tp-20-335Translational Pediatrics, Vol 10, No 4 April 2021 1211
A B C D E
Figure 2 Axial DWI (A,B) shows left occipitotemporal and frontal cortical restricted diffusion (arrows) in a child with MELAS. Axial T2 weighted
image (C) shows preservation of cortical ribbon signal. DWI images (D,E) in another child with POLG mutation shows typical distribution of parieto-
occipital and thalamic restriction as well as perirolandic changes (arrows). DWI, diffusion weighted imaging; POLG, polymerase gamma.
of brain development and myelin maturation, receptor disorders such as CDG, Menkes disease, and acute
and neurotransmitter distribution, cell and region specific intermittent porphyria present with cortical swelling and
variability in molecular composition, energy requirements restricted diffusion. Vascular stroke is associated with classic
and affinity to certain toxins (1). homocystinuria and can present with arterial ischemic or
venous infarction (lenticular dislocation if identified on
Cortical grey matter involvement imaging can be an important clue here).
Two patterns of cortical involvement are recognised: (II) Atrophy
(I) Swelling and cytotoxic edema Atrophy is a nonspecific feature seen in many IEMs, and
These are usually hallmarks of different mitochondrial is commonly seen in storage disorders and mitochondrial
cytopathies, especially with pathogenic variants in cytopathies (7). Exemplary is neuronal ceroid lipofuscinosis
mitochondrial DNA (mt DNA), the prototype being MELAS (NCL) (Figure 3) which typically shows variable degrees of
disease. In the acute stage, there is cortical swelling and cerebral and cerebellar atrophy, T2 hypointense thalami,
restricted diffusion occurring in a nonvascular distribution and T2/FLAIR white matter hyperintensity which typically
with predilection to the primary visual, somatosensory, begins in the periventricular region but can involve deep
and auditory cortices. Temporal evolution involves cortical and subcortical white matter as well as the brainstem with
laminar necrosis, subsequent volume loss or, less commonly, progression of disease (8,9).
complete resolution. Although classically described Alpers disease is a mitochondrial disorder and is part
as asymmetric, symmetric involvement is increasingly of the POLG1-related spectrum. There is generalized
recognised (6). Other mitochondrial diseases that show atrophy which may be posterior predominant. Other clues
cortical restricted diffusion include polymerase gamma to diagnosis include hepatic dysfunction [with or without
(POLG1) related disorders (with unilateral or bilateral hepatic encephalopathy which may be evident on magnetic
parieto-occipital or perirolandic and thalamic involvement), resonance imaging (MRI)], as well as deep grey matter
ubiquinone deficiency (commonly with cerebellar involvement (10,11).
involvement), complex V deficiency, and Kearns Sayre The glycogen storage diseases typically show T2
syndrome. Lactate can be commonly identified on magnetic hypointense thalami, abnormal myelin, cortical atrophy,
resonance spectroscopy (MRS) from both involved and coarse facies and dysostosis multiplex (2).
“normal appearing” parenchyma. Typical clinical presentation
is with stroke like symptoms (“metabolic stroke”) Figure 2. Deep grey matter involvement
Imaging differentials include ischemic lesions (ischemic The major deep grey nuclei consist of the basal ganglia [globi
stroke), encephalitis (infection associated and autoimmune) pallidi (GP), putamen, caudate nuclei] and the thalami.
and post-ictal change. Less commonly, other metabolic The putamen and caudate nuclei are collectively termed as
© Translational Pediatrics. All rights reserved. Transl Pediatr 2021;10(4):1201-1230 | http://dx.doi.org/10.21037/tp-20-3351212 Biswas et al. Clinico-radiological phenotyping of neurometabolic disorders
A B C
Figure 3 Atrophy in IEM. Axial T2 weighted images (A,B) in a 5-year-old child with neuronal ceroid lipofuscinosis shows remarkable
cerebellar (arrow, A) and diffuse cerebral volume loss. Note thalamic T2 hypointensity (arrow, B). Axial T2 image (C) in another 7-year-old
child with mitochondrial cytopathy shows diffuse cerebral volume loss (arrow). IEM, inborn errors of metabolism.
A B C D
E F G H
Figure 4 Pallidal changes in IEM. Axial DWI (A) in methylmalonic acidemia shows bilateral GP diffusion restriction (arrow) with corresponding
hyperintensity on T2 weighted images (arrow, B). Axial T2 weighted image (C) shows symmetric hyperintensity involving anterior aspects of GP
(arrow), with calcification on CT (arrow, D) in a case of MELAS. SWI shows GP hypointensity with laminar sparing in a case of MPAN (arrow, E)
and anteromedial GP in PKAN (arrow, F). Coronal T1 weighted images showing GP (arrow, G) and anterior pituitary gland hyperintensity (arrow,
H) in a case of manganese transporter deficiency. IEM, inborn errors of metabolism; DWI, diffusion weighted imaging; GP, globi pallidi; PKAN,
pantothenate kinase-associated neurodegeneration; MPAN, mitochondrial membrane protein-associated neurodegeneration.
the “corpus striatum” or “striate nuclei”. Metabolic disease (I) GP
affecting these structures may show selective involvement of Bilateral GP T2/FLAIR hyperintensity are typically caused
one or more of these structures (Figures 4-6). by toxic and metabolic etiologies. If the abnormality is
© Translational Pediatrics. All rights reserved. Transl Pediatr 2021;10(4):1201-1230 | http://dx.doi.org/10.21037/tp-20-335Translational Pediatrics, Vol 10, No 4 April 2021 1213
A B C D E
Figure 5 Striatal changes in IEM. Axial DWI image (A) shows bilateral putaminal diffusion restriction (arrow) in organic acidemia. Axial T2
weighted image (B) shows bilateral striatal, thalamic and midbrain changes in mitochondrial disease (arrows). Axial T2 weighted image (C)
shows bilateral T2 hyperintensity of striatum, medial thalamus and subcortical white matter (arrows) in biotin thiamine responsive basal ganglia
disease. Axial T2 weighted image (D) shows widened opercula and symmetric striatal hyperintensity in type 1 glutaric aciduria (arrows). Axial T2
weighted image (E) shows diffuse white matter hyperintensity along with symmetric striatal swelling and hyperintensity in GM1 gangliosidosis
(arrows). Small and heterogeneously dark thalami is also evident. IEM, inborn errors of metabolism; DWI, diffusion weighted imaging.
A B C
D E F
Figure 6 Thalamic involvement in IEM and mimics. Axial T2 weighted image (A) shows bilateral symmetric thalamic (arrow) and putaminal
involvement in a case of mitochondrial disease. Axial T2 weighted image (B) shows extensive white matter hyperintensity along with globi
pallidal and thalamic hyperintensities (arrow) in a case of Canavan disease—note characteristic sparing of striate nuclei. Axial T2 weighted
image (C) shows dark thalami (arrow) of neuronal ceroid lipofuscinosis- notice also significant cerebral volume loss for age. Axial FLAIR (D)
and sagittal T1 weighted image (E) depicts straight sinus thrombosis with bilateral thalamic swelling and hyperintensity (arrow). Axial DWI
(F) shows bilateral symmetric medial thalamic diffusion restriction (arrow) in a case of artery of Percheron stroke. IEM, inborn errors of
metabolism; DWI, diffusion weighted imaging.
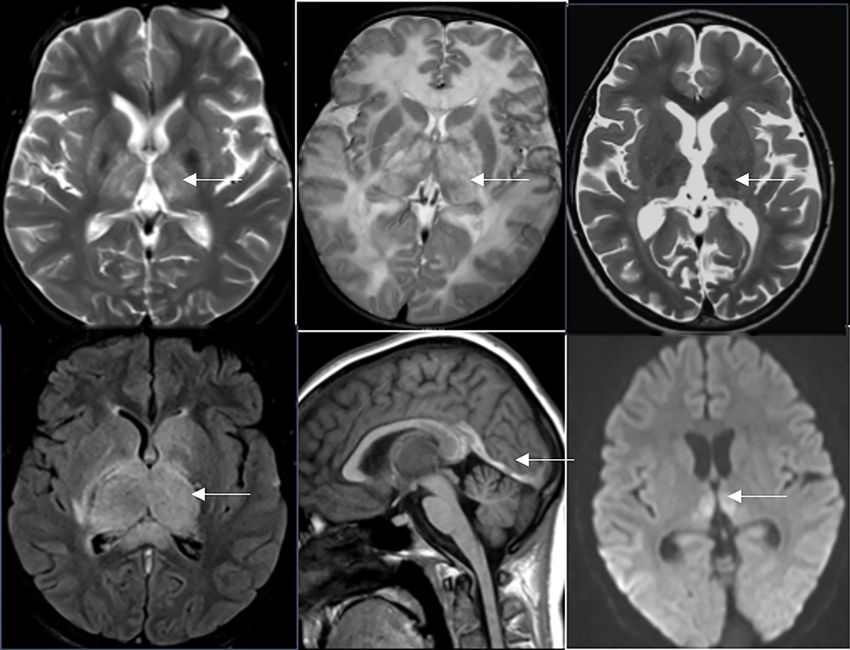
© Translational Pediatrics. All rights reserved. Transl Pediatr 2021;10(4):1201-1230 | http://dx.doi.org/10.21037/tp-20-3351214 Biswas et al. Clinico-radiological phenotyping of neurometabolic disorders confined to the GP, late onset methylmalonic acidemia glial neoplasms can be symmetric and pose diagnostic (MMA), cerebral creatine deficiency syndromes and challenges. certain subtypes of pyruvate dehydrogenase deficiency (III) Thalami (PDH) need consideration (once toxic causes such as carbon Neurometabolic causes with isolated thalamic involvement monoxide poisoning and kernicterus are excluded). Late is uncommon. Thalamic T2 hypointensity is seen in onset MMA may show other nonspecific findings such as storage disorders such as GM gangliosidosis, neuronal white matter T2/FLAIR hyperintensity and cortical atrophy, ceroid lipofuscinosis, Krabbe disease, fucosidoses whilst cerebral creatine deficiency syndromes typically show and aspartylglucosaminuria (2,7,15). Corresponding reduced or absent creatine peak on MR spectroscopy (7). T2/ hyperdensity on CT is typically seen in Krabbe disease FLAIR hyperintensity involving the GP as well as cerebellar and GM gangliosidosis. T2 hyperintense thalami is seen in dentate nuclei may be seen in succinate semialdehyde Wilson disease, many mitochondrial cytopathies, Canavan dehydrogenase (SSADH) deficiency, Canavan disease, disease and MSUD. propionic acidemia, maple syrup urine disease (MSUD), Many non-metabolic diseases can present with isolated and mitochondrial cytopathies (2). or predominant thalamic involvement, and need to be Bilateral GP T1 hyperintensity is uncommon, and considered in the appropriate setting. Acute necrotizing therefore when seen should prompt a relatively narrow encephalopathy of childhood (ANEC) with or without differential diagnosis. Molecules that are hyperintense underlying RANBP2 mutation occur following triggers on T1 include haemorrhage, calcification, bilirubin and such as influenza, adenovirus and rotavirus infection. manganese. Therefore, once HIE, kernicterus, carbon Thalamic involvement is typical in ANEC, with trilaminar monoxide poisoning are excluded, one must consider pattern on ADC and multiple microhemorrhages on MPGR disorders of manganese metabolism (hepatic failure, or SWI (16). Diffuse glial neoplasms, Japanese encephalitis, hyperalimentation and manganese transporter defect) deep venous thrombosis and Wernicke disease also show (12-14). Indeed, any metabolic disorder which causes predominant thalamic changes. micro-haemorrhage and/or hypoxic injury with astrogliosis In addition to the above, the deep grey nuclei may show may also result in this picture. secondary involvement in response to cortical or white Bilateral GP T2 hypointensity may occur due to iron, matter injury, with atrophy being a common endpoint of calcium or hemosiderin deposition. It is important to many neurometabolic disease processes. perform susceptibility weighted imaging (SWI) or gradient An algorithmic approach to grey matter involvement in recalled echo (GRE) imaging that enables depiction of IEM is presented in Figure 7. paramagnetic properties of these substances, manifesting as “signal drop-out”. When isolated to the GP, or with GP and White matter involvement dentate involvement, the spectrum of neurodegeneration According to the latest definition by van der Knaap et al. (17), with brain iron accumulation (NBIA) needs consideration (7). leukodystrophy includes “all genetically determined disorders When there is both GP and thalamic T2 hypointensity, with selective and primary involvement of CNS white matter, storage disorders such as neuronal ceroid lipofuscinosis, irrespective of the structural white matter component involved GM gangliosidosis, aspartylglucosaminuria and fucosidosis and molecular process affected”. need consideration. A large number of IEMs present as leukodystrophies. (II) Striate nuclei Pattern and distribution of white matter abnormalities and Bilateral striatal T2 hyperintensity has a vast number of associated findings help in specific diagnosis or narrowing causes. Again, symmetric involvement generally suggests the differential in a many of these disorders. But an equal or a toxic or metabolic process, although exceptions exist. even larger number of disorders show nonspecific patterns. Etiologies include organic acidemias such as propionic Heterogeneous appearance of the same disease, overlapping acidemia, types 1 and 2 glutaric aciduria and L2- features of different disorders and evolution of findings add hydroxyglutaric aciduria, mitochondrial disorders such as to challenges in interpretation. those causing Leigh’s syndrome, Wilson’s disease and biotin A systematic pattern-based approach with disorders thiamine responsive basal ganglia disease (2). categorized under each pattern is given in Figure 8. Less commonly infectious, para-infectious or The first step is to identify features of hypomyelination autoimmune inflammatory processes and diffuse infiltrating as these form the largest subgroup of leukodystrophies. © Translational Pediatrics. All rights reserved. Transl Pediatr 2021;10(4):1201-1230 | http://dx.doi.org/10.21037/tp-20-335
Translational Pediatrics, Vol 10, No 4 April 2021                                                                                    1215

Figure 7 Algorithmic approach to grey matter involvement in IEMs. IEM, inborn errors of metabolism.

A diffuse reduction in expected myelin for age with T2               white matter should raise the possibility of metachromatic
hyperintensity and variable T1 hypointensity may be                  leukodystrophy. This appearance is due to relative sparing
seen (18). If the first MRI is performed in infancy, a repeat        of some myelin and lipid containing glial cells (23). This is,
MRI following a minimum period of 6 months is required               however, not specific to metachromatic leukodystrophy and
to confirm hypomyelination (as opposed to delayed myelin             can also be seen in Krabbe disease and GM gangliosidosis.
maturation). Hypomyelinating leukodystrophies (HLDs)                    X-linked adrenoleukodystrophy usually has a posterior-
show no significant interval progression of myelination.             anterior gradient, with the middle of the callosal splenium
Further imaging-based differentiation is possible in many            and/or hippocampal commissure being the first region to
HLDs.                                                                be involved. This then extends to involve the deep white
   Other leukodystrophies show more striking T2                      matter of the parietal and occipital regions, with subsequent
hyperintensity and T1 hypointensity of involved white                involvement of the internal and external capsules, Meyer’s
matter when compared to HLDs. Disorders which involve                loop, geniculate bodies and brainstem. A zonal pattern
the periventricular and deep white matter early with relative        of involvement is characteristic on MRI, with a central
sparing of the subcortical U-fibers are plentiful. A useful          burnt-out zone, an inflammatory zone and a zone of active
approach is to then look for thalamic involvement. Presence          demyelination (24).
of thalamic T2 hypointensity suggests Krabbe disease or                 If the subcortical white matter is affected early, it is
GM gangliosidosis. Krabbe disease generally has additional           especially important to note the head circumference.
features such as corticospinal tract involvement, dentate            Early subcortical U-fiber involvement with macrocephaly
nucleus T2 hyperintensity, thickening of the optic and/or            are seen in infantile Alexander disease, Canavan disease,
spinal nerves (19,20), whilst GM gangliosidosis additional           L2-hydroxyglutaric aciduria and megalencephalic
features include striatal signal changes, dysmorphic facies,         leukoencephalopathy with subcortical cysts. Infantile
dysostosis multiplex and cerebellar atrophy (21,22). Lack of         Alexander disease has a typical anteroposterior gradient,
thalamic involvement and a tigroid appearance of involved            involves striate nuclei (head of caudate nuclei in particular),

© Translational Pediatrics. All rights reserved.                 Transl Pediatr 2021;10(4):1201-1230 | http://dx.doi.org/10.21037/tp-20-335
1216                                                    Biswas et al. Clinico-radiological phenotyping of neurometabolic disorders

A

B

Figure 8 Algorithmic approach to white matter involvement in IEMs. (A) Depicting hypomyelinating disorders and (B) depicting other
leukodystrophies. IEM, inborn errors of metabolism.

© Translational Pediatrics. All rights reserved.               Transl Pediatr 2021;10(4):1201-1230 | http://dx.doi.org/10.21037/tp-20-335
Translational Pediatrics, Vol 10, No 4 April 2021                                                                                  1217

diencephalic structures and brainstem, and may show                distribution of cysts. The latter two have microcephaly and
a characteristic periventricular T2 hypointensity (25).            predominantly anterior temporal pole cysts. Periventricular
Canavan disease has additional involvement of the GP,              and deep white matter cysts are seen in oculocerebrorenal
thalami, dentate nuclei and brainstem, typically spares the        (Lowe) syndrome (35). Corpus callosal “cysts” (presumably
striate nuclei and corpus callosum; and shows characteristic       perivascular spaces) are seen in the mucopolysaccharidoses.
elevated N-acetylaspartate (NAA) peak on MRS (7,26).               Subependymal (germinolytic) cysts are a feature of
Megalencephalic leukoencephalopathy with subcortical cysts         peroxisomal disorders (particularly Zellweger syndrome),
shows diffuse white matter involvement with subcortical            D-2 hydroxyglutaric aciduria, pyruvate dehydrogenase E1-
cysts (27). L2-hydroxyglutaric aciduria has characteristic         alpha deficiency, and complex mitochondrial dysfunction
imaging findings which include early subcortical U-fiber           with pontocerebellar hypoplasia and glutaric aciduria
involvement, antero-posterior gradient, involvement of the         type 1 (2). In addition, there can be cystic cavitation of
striate and dentate nuclei; and typical sparing of thalami,        lesions in MMA and Leigh’s syndrome. Cystic rarefaction of
deep and periventricular white matter, corpus callosum             involved white matter is characteristically seen in vanishing
and internal capsules (28). A peculiar feature of L2-              white matter disease. Temporal cysts have also been described
hydroxyglutaric aciduria is its carcinogenic nature (29).          in galactosemia. Examples are depicted in Figure 10.
   Early subcortical U-fiber involvement with normal head          Calcification
size is seen in galactosemia and Kearns Sayre syndrome.            Basal ganglia calcification has been reported in
Galactosemia can be diagnosed by eliciting galactitol peak         mitochondrial disorders such as Kearns Sayre syndrome (36)
on MRS (30). Kearns Sayre syndrome is a mitochondrial              and myoclonic epilepsy with ragged red fibers (37),
disorder with frequent globi pallidal and/or caudate               GM1 gangliosidosis (38), and biotinidase deficiency (39).
involvement, along with retinitis pigmentosa (31).                 Calcifications confined to the GP have been reported
   Finally, early subcortical U fiber involvement with             in MMA (40) and pantothenate kinase–associated
progressive microcephaly is a feature of Aicardi-Goutieres         neuropathy (41). Cerebellar white matter calcification is
syndrome and cystic leukoencephalopathy without                    seen in cerebrotendinous xanthomatosis (2). Dystrophic
megalencephaly—these are further described below.                  calcifications may also be seen in the parieto-occipital
   Subtle diffuse white matter changes can be seen secondary       regions at the chronic or “burnt out” stage of X-ALD (1).
to neuroaxonal loss. Whilst this can potentially mimic             Hyperdensity on CT along the corticospinal tracts and
hypomyelination on imaging, early appearance of significant        other involved white matter of Krabbe may be partially
diffuse parenchymal atrophy is a clue to differentiation.          attributed to calcification.
   Intra-myelinic edema is another pattern of white matter            Other conditions associated with calcification include
involvement seen in many IEMs, with MSUD being                     AGS (42) with predominant basal ganglia and white matter
the prototypical example. In MSUD, there is symmetric              distribution (Figure 10F), Cockayne syndrome (43) which
restricted diffusion involving the myelinated white matter         shows globus pallidus, dentate, striatal and parenchymal
(32,33); imaging of MSUD is further discussed in the               distribution, Fahr’s disease and disorders of parathormone
focused neonatal section. Intramyelinic edema is also              metabolism (44).
the likely mechanism underlying altered white matter
diffusivity in non-ketotic hyperglycinemia (NKH),                  Malformations
chloride channel 2 (ClC2) related disease, megalencephalic         Certain subgroups of IEMs affect different stages of
leukoencephalopathy with subcortical cysts (MLC),                  neurodevelopment including neuronal proliferation,
and leukoencephalopathy with thalamus and brainstem                migration, myelination, and synapse formation. Common
abnormalities and lactate elevation (LTBL) (34).                   malformations associated with IEMs are listed in Table 3.
   Some examples of patterns are illustrated in Figure 9.
                                                                   Posterior fossa involvement
Cysts                                                              Although there are robust pattern recognition features
Subcortical cysts are seen in megalencephalic                      involving supratentorial structures, on occasion, specific
leukoencephalopathy, Aicardi Goutiere syndrome (AGS)               patterns of posterior fossa involvement help clinch the
and cystic leukoencephalopathy without megalencephaly.             diagnosis. Furthermore, certain disorders have prominent
The former shows temporal, frontal or parietal                     posterior fossa manifestations in early stages which also aids

© Translational Pediatrics. All rights reserved.               Transl Pediatr 2021;10(4):1201-1230 | http://dx.doi.org/10.21037/tp-20-335
1218 Biswas et al. Clinico-radiological phenotyping of neurometabolic disorders A B C D E Figure 9 White matter patterns in IEM. Axial T2 weighted image (A) in Alexander disease shows anterior predominant white matter involvement (arrow). Axial T2 weighted image (B) in metachromatic leukodystrophy shows symmetric confluent deep white matter hyperintensity with tigroid pattern (arrow). Axial T2 weighted image (C) and sagittal T1 weighted image (D) in Krabbe disease shows hyperintensities along corticospinal tracts and thickened prechiasmatic optic nerve (arrows). Axial T2 weighted image (E) shows typical posterior predominant changes (arrow) with splenial involvement in X-linked adrenoleukodystrophy. IEM, inborn errors of metabolism. A B C D E F Figure 10 Cysts and calcifications in IEM. Axial T2 weighted image (A) in leukoencephalopathy with calcifications and cysts (LCC) shows asymmetric white matter hyperintensity, left thalamic cysts (arrow) and right thalamic calcification. Axial T2 weighted image (B) in Zellweger syndrome shows subependymal cysts and polymicrogyria (arrows). Axial T2 weighted image (C) shows temporal polar white matter cysts (arrow) in galactosemia. Axial T2 weighted (D) and coronal FLAIR images (E) in vanishing white matter disease shows confluent white matter hyperintensity with cystic changes (arrows). Axial CT (F) in Aicardi Goutieres syndrome shows bilateral basal ganglia calcifications (arrow). IEM, inborn errors of metabolism. in diagnosis. of metabolic and neurogenetic disorders including Presence of dentate nucleus involvement along with mitochondrial disorders, storage disorders, Marinesco- subcortical white matter involvement allows a confident Sjögren syndrome, PLA2G6-associated neurodegeneration diagnosis of L-2-OH glutaric aciduria. Dorsal columns (PLAN), and CDG. and lateral corticospinal tracts of the spinal cord, pyramids Lower cranial nerve and cauda equina enhancement and/or decussation of the medial lemniscus in the medulla can be seen in MLD and Krabbe disease. The latter also oblongata and intraparenchymal trigeminal involvement are demonstrates cerebellar white matter involvement and diagnostic of DARS2 related LBSL. Alexander disease can corticospinal tract involvement early in the course of the occasionally present with multifocal enhancing brainstem disease. lesions without classic supratentorial involvement (45), often mimicking neoplastic lesions. The role of diffusion weighted imaging (DWI) Isolated cerebellar atrophy with or without parenchymal DWI is key to identifying regions of cytotoxic edema T2/FLAIR hyperintensity is seen in a wide spectrum and myelin splitting (intramyelinic) edema, and in © Translational Pediatrics. All rights reserved. Transl Pediatr 2021;10(4):1201-1230 | http://dx.doi.org/10.21037/tp-20-335
Translational Pediatrics, Vol 10, No 4 April 2021                                                                                          1219

 Table 3 Common malformations associated with IEMs (2,5)
                                                                            Table 3 (continued)
 Malformation                 Disorders
                                                                            Malformation               Disorders
 Corpus callosal              Pyruvate dehydrogenase deficiency
                                                                            Pachygyria                 3-hydroxyisobutyric aciduria
 abnormality
                              Congenital disorders of glycosylation
 (agenesis/dysgenesis)                                                                                 Pyruvate dehydrogenase deficiency
                              Non-ketotic hyperglycinemia
                                                                                                       Glutaric aciduria type 2
                              Smith-Lemli-Opitz syndrome
                                                                                                       Smith-Lemli-Opitz syndrome
                              Fumarase deficiency
                                                                                                       SNAP29 (CEDNIK syndrome)
                              Glutaric aciduria type 2
                                                                            Cerebellar abnormalities Congenital disorders of glycosylation
                              3-hydroxyisobutyric aciduria                  (hypoplasia/dysplasia/
                                                                                                     Non-ketotic hyperglycinemia
                                                                            abnormal sulcation)
                              Infantile Refsum disease
                                                                                                     Smith-Lemli-Opitz syndrome
                              Menke’s disease
                                                                                                       3-hydroxyisobutyric aciduria
                              Zellweger syndrome
                                                                                                       Infantile Refsum disease
                              Maternal phenylketonuria
                                                                                                       Menke’s disease
                              SNAP29 (CEDNIK syndrome)
                                                                                                       Zellweger syndrome
 Microcephaly                 Serine defects
                                                                                                       DHA transporter defect
                              Mitochondrial disorders
                                                                                                       Dolichol synthesis defects
                              NSDHL (X-linked) hemizygous males
                                                                                                       Fumarase deficiency
                              Dolichol synthesis defects
                                                                                                       Glutaric aciduria type 2
                              Aerobic glucose oxidation defects
                                                                                                       Bifunctional enzyme deficiency
 Lissencephaly                Serine defects
                                                                            Lobar hypoplasias          Frontal
                              Mitochondrial TPP depletion
                                                                                                       Smith-Lemli-Opitz syndrome
                              3-hydroxyisobutyric aciduria
                                                                                                       Fronto-temporal
 Polymicrogyria               Peroxisomal disorders
                                                                                                       Glutaric aciduria type 1
                              Fumarase deficiency
                                                                            Simplified gyration        Glutaric aciduria type 1
                              Smith-Lemli-Opitz syndrome
                                                                                                       Asparagine synthetase deficiency
                              SNAP29 (CEDNIK syndrome)
                                                                            Heterotopias               Peroxisomal disorders
 Table 3 (continued)
                                                                                                       Pyruvate dehydrogenase deficiency

                                                                                                       Fumarase deficiency

                                                                                                       Aerobic glucose oxidation defects
differentiating these from regions of vasogenic edema.
Many metabolic disorders demonstrate restricted diffusion                                              Menkes disease
in the acute stage, or at times of acute decompensation.                    Data from Barkovich and Raybaud (2) and Saudubray et al. (5).
These may imply “metabolic stroke” due to energy failure
at the cellular level or a process that leads to intramyelinic
edema. Patterns of restricted diffusion are extremely                     acutely with restricted diffusion variably in the deep grey
useful in approaching a suspected neurometabolic                          nuclei, brainstem, cerebellar dentate nuclei, and cortices.
syndrome. Neonatal onset MSUD, neonatal onset MMA                         DWI also helps in assessment of disease activity, while
and NKH typically show restricted diffusion involving                     diffusion tensor imaging plays a role in identification
the myelinated white matter (15). Urea cycle disorders                    and quantitative analysis of myelin damage, even in
may show “ribbon like” restricted diffusion at the depth                  the subclinical phase. Some examples are depicted in
of the sulci (46). Many mitochondrial disorders present                   Figure 11.

© Translational Pediatrics. All rights reserved.                      Transl Pediatr 2021;10(4):1201-1230 | http://dx.doi.org/10.21037/tp-20-335
1220 Biswas et al. Clinico-radiological phenotyping of neurometabolic disorders
A B C D E
Figure 11 Diffusion changes in IEM. Axial DWI (A) in POLG1 pathogenic mutation related mitochondrial cytopathy shows symmetric
perirolandic diffusion restriction (arrow). Axial T2 weighted image (B) in maple syrup urine disease shows brain stem swelling and
hyperintensity (arrow) along with cerebellar white matter and optic chiasm involvement. Corresponding DWI shows extensive diffusion
restriction (arrow). Note “4 dots” in the brainstem. Axial DWI (C,D) and ADC (E) in non-ketotic hyperglycinemia showing confluent
white matter diffusion restriction including posterior limb of internal capsule (arrows). IEM, inborn errors of metabolism; DWI, diffusion
weighted imaging; POLG, polymerase gamma; ADC, apparent diffusion coefficient.
Contrast enhancement are depicted in Figure 13.
Presence of enhancement is characteristic of certain conditions Certain important caveats need to be considered while
such as X-ALD (enhancement along Schaumburg zone interpreting MRS. Lactate elevation is not exclusive to
2-region of active inflammatory demyelination). Garland-like mitochondrial disorders and can be seen in any disorder
frontal periventricular enhancement is a hallmark of Alexander that results in anaerobic glycolysis such as ischemic
disease. Alexander disease can also present with nodular lesions and in children who are critically ill due to any
brainstem enhancement mimicking demyelinating disorders cause. Small lactate peaks are also known to occur in
and low grade gliomas (45). Nonspecific enhancement may normal neonatal brains. Technical factors that can affect
occur in Krabbe disease and certain mitochondrial disorders. the appearance of peaks should also be kept in mind.
Cranial and spinal nerve enhancement are known to occur in Reduced or absent signal of lactate at 144 TE in higher
MLD and Krabbe disease (Figure 12). field strength magnets due to J modulation is a good
example (48).
Role of MR spectroscopy
MR spectroscopy is invaluable in the work up of
neurometabolic diseases. Indeed, it may be the only Focused section
abnormality identified in creatine deficiency (absent or The devastating metabolic diseases of the newborn
reduced creatine peak at 3.03 ppm) and in mitochondrial
disorders (lactate at 1.3 ppm). It also helps in confirming Majority of the classically described small molecule
the diagnosis in NKH (elevated glycine peak at 3.55 ppm category of IEM present in the neonatal period. As a rule
which persists on long TE), MSUD (branched chain amino of thumb, clinical manifestations of these disorders depend
acid peak at 0.9 ppm), Canavan disease (very high NAA on the degree of residual enzyme activity and the rapidity
peak at 2.01 ppm), galactosemia (galactitol peak at 3.7 ppm) in accumulation of toxic intermediates, energy or substrate
and phenylketonuria (phenylalanine peak at 7.3 ppm, using deficiency. Whilst these classic disorders generally present
very short TE); and is a marker for hyperammonemia in following a lag period (during which there is exposure to
urea cycle defects (elevated glutamate/glutamine peak the dietary substrates), many small molecule and energy
between 2.2 and 2.4 ppm) (2,7,15,46,47). MRS can also deficiency disorders present antenatally or at the time of
predict disease progression (NAA/choline ratio below 5) birth with various congenital anomalies, dysmorphism and
in otherwise normal appearing parenchyma in X-ALD. malformations. Though the degree of residual enzyme
Furthermore, it can be used to monitor therapy in creatine activity and genotype phenotype correlation holds true in
deficiency syndromes and phenylketonuria. Some examples the majority of cases, there are exceptions with late onset
© Translational Pediatrics. All rights reserved. Transl Pediatr 2021;10(4):1201-1230 | http://dx.doi.org/10.21037/tp-20-335You can also read