COAL PHASE OUT AND ENERGY TRANSITION PATHWAYS - FOR ASIA AND THE PACIFIC - Climate Analytics
←
→
Page content transcription
If your browser does not render page correctly, please read the page content below
COAL PHASE OUT
AND ENERGY TRANSITION PATHWAYS
FOR ASIA AND THE PACIFIC
The shaded areas of the map indicate ESCAP members and associate members.*

The Economic and Social Commission for Asia and the Pacific (ESCAP) serves
as the United Nations’ regional hub, promoting cooperation among countries
to achieve inclusive and sustainable development.

The largest regional intergovernmental platform with 53 member States and
9 associate members, ESCAP has emerged as a strong regional think-tank
offering countries sound analytical products that shed insight into the evolving
economic, social and environmental dynamics of the region. The Commission’s
strategic focus is to deliver on the 2030 Agenda for Sustainable Development,
which it does by reinforcing and deepening regional cooperation and integration
to advance connectivity, financial cooperation and market integration. The
research and analysis undertaken by ESCAP, coupled with its policy advisory
services, capacity building and technical assistance to governments aims to
support countries’ sustainable and inclusive development ambitions.

*The designations employed and the presentation of material on this map do not imply the
expression of any opinion whatsoever on the part of the Secretariat of the United Nations
concerning the legal status of any country, territory, city or area or of its authorities, or
concerning the delimitation of its frontiers or boundaries.
COAL PHASE OUT
                               AND ENERGY TRANSITION PATHWAYS
                               FOR ASIA AND THE PACIFIC

                               United Nations publication
                               Copyright @ United Nations 2021
                               All rights reserved
                               ST/ESCAP/2936

                               This publication may be reproduced in whole or in part
                               for educational or non-profit purposes without special
                               permission from the copyright holder, provided that the
                               source is acknowledged. The ESCAP Publications Office
                               would appreciate receiving a copy of any publication
                               that uses this publication as a source.

                               Use may not be made of this publication for resale or
                               any other commercial purpose whatsoever without
                               prior permission. Applications for such permission,
                               with a statement of the purpose and extent of
                               reproduction, should be addressed to the Secretary of
Photo credits                  the Publications Board, United Nations, New York.

Cover                          The designations employed and the presentation of the
Neuwieser/Flickr.com           material in this publication do not imply the expression
Istock.com photo #586163548    of any opinion on the part of the United Nations
                               concerning the legal status of any country, territory,
page 16                        city or area, or of its authorities, or concerning the
Istock.com photo #1192528175   delimitation of its frontier or boundaries.

page 26                        References to dollars ($) are to United States dollars
Istock.com photo # 586073426   unless otherwise stated.
COAL PHASE OUT AND ENERGY TRANSITION PATHWAYS
FOR ASIA AND THE PACIFIC

Contents

      Acknowledgementv
      Executive summary                                                                                  vi
      Introduction1

Chapter 1       Current situation, trends and expansion plans                                            3

      1.1 Current role of coal for power generation in the Asia-Pacific region                           3
      1.2 Planned coal fired power generation                                                            6
      1.3 Emissions from coal power generation not consistent with the Paris Agreement                  14
      1.4 Impact of COVID-19 crisis on policies for phasing out of coal in the South-East Asia subregion 19

Chapter 2       Drivers of coal expansion in the region                                                  21

      2.1 Asian countries are joining the global trend away from coal                                   21
      2.2 Drivers of coal expansion in Asia and the Pacific                                             22

Chapter 3       How can trends be reversed – pathways for a transition to clean energy                  27

      3.1 Paris Agreement compatible energy transition                                                  27
      3.2 Renewable energy potential                                                                    35
      3.3 Comparison of costs for renewable energy and storage vs. fossil fuel technologies             37
      3.4 Integration to maximise benefits from renewable energy potential                              40

Chapter 4       Benefits of a transition from coal towards renewable-based efficient energy system       41

      4.1 Access to clean and affordable energy                                                         41
      4.2 Employment                                                                                    42
      4.3 Health, reduced air and water pollution, and impact on water scarcity                         42
      4.4 Avoided risk of stranded investments                                                          43
      4.5 Energy security and independence                                                              43
      4.6 Environmental degradation                                                                     43
      4.7 Land use                                                                                      44
      4.8 Shifting investment – opportunities for a green COVID-19 recovery                             45
      4.9 Economic impacts of climate change                                                            46

Chapter 5       Conclusion and recommendations                                                           51

      References59
      Annexes64
            Annex 1     Asia-Pacific coal fleet pipeline                                                64
            Annex 2     Climate change impacts                                                          65

ii
List of boxes

Box 1 \        The additional burden of COVID-19                                                         44

List of figures

Figure    1\   CO2 emissions from coal by sector                                                          3
Figure    2\   Coal generation as percentage of national electricity generation in 2019                   4
Figure    3\   Current coal fleet and pipeline in Asia-Pacific region by status and technology            8
Figure    4\   Current coal fleet and pipeline (left) and age distribution (right) in the North and
               Central Asia (NCA) subregion by status and technology                                     10
Figure    5 \ Current coal fleet and pipeline in countries in the East and North-East subregion (ENEA)
               with stable or contracting coal capacity, by status and combustion technology             11
Figure    6 \ Current coal fleet and pipeline in China, by status and combustion technology              12
Figure    7 \ Coal capacity by status and technology, in countries in the South and South-West Asia
               (SSWA) subregion with high expansion plans compared to current capacity                   12
Figure    8 \ Current coal fleet and pipeline in India by status and technology                          13
Figure    9 \ Coal capacity by status and technology, (left) and age distribution (right) for countries
               in the South-East Asian (SEA) subregion (all categories)                                  13
Figure    10 \ Estimated emissions over time resulting from current coal-fired power generation
               capacity in the Asia-Pacific region                                                       14
Figure    11 \ Estimated emissions over time resulting from current coal-fired power generation
               capacity in the North and Central Asia subregion                                          15
Figure    12 \ Estimated emissions over time resulting from current coal-fired power generation
               capacity in the countries of the East and North-East Asia subregion with stable
               or contracting coal capacity                                                              17
Figure    13 \ Estimated emissions over time resulting from current coal-fired power generation
               capacity in the China                                                                     17
Figure    14 \ Estimated emissions over time resulting from current coal-fired power generation
               capacity in India                                                                         18
Figure    15 \ Estimated emissions over time resulting from current coal-fired power generation
               capacity in the countries of the South and South-West Asia subregion with high
               capacity expansion plans (Turkey, Pakistan, Bangladesh and Sri Lanka)                     18
Figure    16 \ Estimated emissions over time resulting from current coal-fired power generation
               capacity in the countries of the South-East Asia subregion                                19
Figure    17 \ Potential coal generation in Non-OECD Asia against Paris Agreement benchmarks             28
Figure    18 \ Levelized cost of electricity – a comparison between fossil fuels and renewable
               sources, 2019                                                                             37
Figure    19 \ Shift in energy investments from current policy to a 1.5 pathway                          45
Figure    20 \ Projected changes in GDP per capita in subregions due to changes in global mean
               annual temperature                                                                        48
Figure    21 \ Projected GDP per capita gains from limiting 1.5°C versus 2°C warming by subregion        49
Figure    22 \ Projected changes in climate extremes over five Asia-Pacific subregions                   67

                                                                                                          iii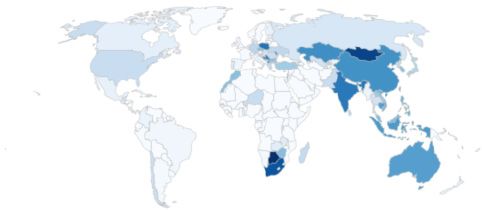
COAL PHASE OUT AND ENERGY TRANSITION PATHWAYS
FOR ASIA AND THE PACIFIC

List of tables

Table   1\     Share of coal in power generation and capacity in the Asia-Pacific region by economy        5
Table   2\     The coal pipeline in the Asia-Pacific region: Current expansion plans and recent changes    7
Table   3\     Country groupings by Asia-Pacific subregion and coal capacity expansion categories          9
Table   4\     Providers and recipients of the highest amount of G20 international public finance
               for coal, 2016-2017, annual average (million United States dollars)                        24
Table   5\     Share of unabated coal-fired power in the electricity sector for 1.5°C compatible
               pathways at global, regional and national levels                                           33
Table   6\     Benchmarks for the share of renewable energy for power generation for 1.5°C
               Paris Agreement compatible pathways at the global, regional and national levels            34
Table   7\     Global and regional Weighted Average LCOE (2019 $/MWh): Selected countries
               and regions                                                                                39
Table   8\     Coal fleet capacity pipeline in Asia-Pacific by combustion technology and fuel type        64
Table   9\     Climate impact indicators                                                                  66
Table   10 \   Extreme indicator for specific ESCAP member States                                         68

iv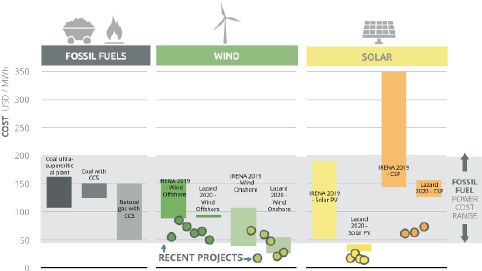
Acknowledgement

This report was developed by the Energy Division of ESCAP in partnership with Climate
Analytics under the overall direction and guidance of Hongpeng Liu, Director of the
Energy Division, and Michael Williamson Section Chief of the Energy Division.

Kaveh Zahedi, Deputy Executive Secretary provided overall review and guidance to
finalize the report.

The principal authors from Climate Analytics were Anna Chapman, Ursula Fuentes,
Gaurav Ganti, Bill Hare, Katharina Lehmann-Uschner, Fahad Saeed and Jessie Ruth
Schleypen.

The main contributors from the Energy Division include Michael Williamson and David
Ferrari.

Peer review and valuable suggestions were provided by Matthew Gidden and Deborah
Ramalope and Xunpeng Shi.

Robert Oliver edited the manuscript. The cover and design layout were created by
Lowil Espada. Prachakporn Sophon coordinated layout design and proof reading.

Mitchell Hsieh, Katie Elles, Kavita Sukanandan, Christophe Manshoven, Sompot
Suphutthamongkhon and Chavalit Boonthanom of the ESCAP Communications and
Knowledge Management Section, coordinated the dissemination of the report.

                                                                                        v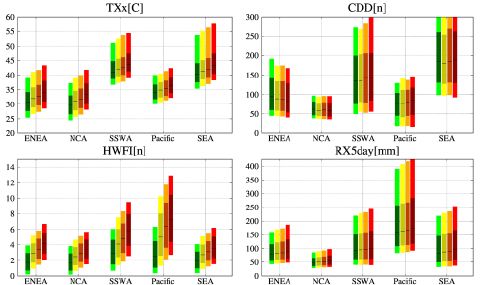
COAL PHASE OUT AND ENERGY TRANSITION PATHWAYS
FOR ASIA AND THE PACIFIC

Executive summary

The Asia-Pacific region, more than any other global region, is highly reliant on fossil fuels. How it
transitions away from fossil fuels will be a pivotal issue for Asia-Pacific and the world in the coming years,
in light of the current and future climate impacts and the sustainable development benefits possible
through an energy transition.

This paper aims to provide insights into how the region can transition away from coal to a renewable-
based efficient energy system compatible with the Paris Agreement and Sustainable Development Goals
(SDGs). The study brings together a systematic review of literature and data to provide a background
on the current situation as well as drivers of coal expansion in the region, options for a clean energy
transition and the benefits of a transition, to highlight policy options. The paper reviews the data on
coal’s share in the Asia-Pacific region’s power generation and capacity, and assesses the benefits of
a transition away from coal. It presents an analysis on the impact of greenhouse gas emissions at the
regional level as well as regional impacts of global warming, illustrating the importance for the region
of achieving the Paris Agreement goals. The paper concludes with a review of proven policies based on
existing literature, evaluating their potential application in the region to provide recommendations for
Governments to adopt best practices.

Coal generation is still expanding in Asia-Pacific – against the trend in other regions

The Asia-Pacific region has a very large share of current global coal capacity and generation as well as
expansion plans. A total of 27 countries in the Asia-Pacific region account for about 76 per cent of current
global coal generation capacity and for almost the entire (94 per cent) global pipeline1 of coal-fired
power plants under construction, planned or announced. The countries in the South and South West
Asia subregion with coal capacity at present are all expanding their capacity, most of them have very
high expansion plans compared with their current capacity, reflecting their fast-growing energy supply
particularly electricity demand. The group of countries in South and South-West Asia with high expansion
plans (Turkey, Pakistan and Bangladesh) include only 2 per cent of current coal capacity within the Asia-
Pacific region, but 13 per cent of the expansion pipeline within this region. While India still relies strongly
on coal for power generation, coal-fired power generation has decreased and the pipeline is shrinking.
With strong policies to enhance renewable energy uptake, there is potential for India to move away from
coal faster.

South-East Asia is characterised by particularly high growth of demand in energy, and in particular
electricity demand, and is dominated by countries with expansion plans. It includes 5 per cent of the
Asian and Pacific coal capacity, but 16 per cent of its coal pipeline. Most of the subregion’s countries that
have expansion plans already have high capacity (Indonesia, the Philippines, Thailand and Viet Nam), two
have expansion pipelines larger than the current capacity (Viet Nam and the Philippines) and several have
currently low capacity but large expansion plans (Cambodia and the Lao People’s Democratic Republic).

1    “Pipeline” refers to coal fired power plants under construction, planned or announced., planned coal capacity includes those that
     are in different stages of pre-permit development or have received all necessary approvals but not yet begun construction.

vi
Executive summary
Even without counting the additional capacity that is in the pipeline, emissions from coal-fired power
generation in the Asia-Pacific region would continue at a very high level until after 2040, and would only
be phased out by around 2060. This is in stark contrast to the needs of the Paris Agreement Long-term
temperature goal which will require the global phase-out of unabated coal by 2040 and the achievement
of peak coal-fired power generation by 2020 before quickly reducing afterwards to 80 per cent below 2010
levels by 2030. Existing coal plant assets are at risk of becoming stranded assets. Any new capacity will
be exposed to even greater risk, threatening to unnecessarily increase the cost of the energy transition
and placing a higher burden on the emerging economies that are less able to afford it. At the subregional
level, this risk is particularly high in the subregions with relatively new coal capacity and large expansion
plans, such as in South and South-West Asia and South-East Asia.
The global trend of declining coal capacity, now expected to be accelerated by the COVID-19 pandemic, is
dominated by trends outside of the Asia-Pacific region, particular by record retirements in the European
Union and the United States. The picture in the Asia-Pacific region is different, with an overall net increase
of coal capacity by 10 GW in the first half of 2020 that was mainly driven by China (9.6 GW). Outside of
China, net retirements in the Republic of Korea, the Russian Federation and India have been almost
cancelled out by a net increase in capacity in Japan, Viet Nam, Bangladesh and Indonesia.
Looking forward, the sharp reduction in cost of solar and wind power as well as storage technologies –
particularly solar photovoltaics (PV) – together with policies against air pollution, increasing adoption
of climate change policies as well as awareness of the need to phase out coal to deliver the aims of the
Paris Agreement, is leading to an increasing move to phase out coal for power generation at the national
or subnational level. There are also clear signs of an increasing aversion towards financing new coal-fired
power plants among many government and investors, given these trends and the increasing awareness of
the risk of stranded assets.
Drivers in the Asia-Pacific region of support for coal and expansion of coal-fired power
generation
Contrary to the global drivers retarding the use of coal, there are factors that are still driving support for
coal and expansion of coal-fired power generation within many countries in the Asia-Pacific region. These
include: high demand growth in South and South-East Asia; the presence of a large share (more than
60 per cent) of global coal reserves in the region; and a high dependency on income from coal exports
in some of the countries in the region whose Governments support coal mining and coal-fired power
generation, including through subsidies and public finance.
Support for coal in the Asia-Pacific region is driven by the geopolitical influence of four countries – China,
Japan, the Republic of Korea and India – that have historically relied on coal and are large coal importers.
Governments, government-owned financial institutions or government-owned utilities in those four
countries are strongly supporting coal expansion in the region. The main recipients of this support are
countries in South and South-East Asia – Bangladesh, Indonesia, Pakistan and Viet Nam. International
support in the region and the large influence of the coal industry on national policy and decision-making
has supported the continuing prevalence of the narrative of supposedly cheap coal and the need to
provide “baseload power” to address the growing energy demand. This narrative is kept alive by vested
interests largely favouring coal. Together with inconsistent policy signals and uncertainty regarding
long-term goals as well as complex energy policy responsibilities within Governments with the strong
influence of state-owned sources has led to investors holding back more than in other regions. It has also
resulted in a delay in the development of policies and energy plans needed to overcome barriers to faster
expansion and integration of larger shares of renewable energy, especially wind and solar.
viiCOAL PHASE OUT AND ENERGY TRANSITION PATHWAYS FOR ASIA AND THE PACIFIC Benchmarks and benefits – pathways to 100 per cent renewable energy in line with the Paris Agreement and Sustainable Development Goals Based on multiple lines of evidence, a range of benchmarks for the power sector have been developed through an in-depth analysis of modelling studies, with between 50 to 80/85 per cent of renewable energy share achievable by 2030 in South and South-East Asia by 2030, on a pathway towards 100% renewable electricity generation by 2050. Utilization of solar and wind could satisfy the needs of almost all South and South-East Asian countries many times over. Renewable energy costs have rapidly fallen during the past 10 years due to technology improvements, economies of scale, competition in renewable energy supply chains and advancing industry experience. Solar PV is now the cheapest source of new electricity generation in most parts of the world, including countries in South and even South-East Asia, which had shown higher costs in the past. Feasible cost reductions of 40-50 per cent in solar PV in Indonesia, Thailand and Viet Nam as well as 15-45 per cent for onshore wind – resulting mainly from industrial learning curves throughout the world – show that there is potential for continued cost reduction. The regional integration of power grids offers numerous further advantages for renewable energy resource sharing and cost reduction, with larger grid integration and transmission providing more flexibility and less need for additional storage. An emerging option in addition to larger regional grid integration is trade of green hydrogen produced from renewable electricity, where countries with strong renewable full load hours provide cost-efficient green hydrogen. The Asia-Pacific region has countries that are extremely vulnerable to climate change, making it the most disaster-prone region globally. However, substantial avoidance of severity of future climate extremes can be achieved if the global temperature increase is kept to the Paris Agreement’s 1.5°C limit, compared to either 2oC warming or the likely result from the NDCs – an increase of 3°C. This emphasizes the need of early and substantive efforts to curb greenhouse gas emissions, and reinforces the urgency of transformative change in the energy system of countries, regionally as well as on the global scale. Three-quarters of all people affected by natural disasters worldwide are living in the Asia-Pacific region. The average annual economic loss from natural disasters is now estimated to be 2.4 per cent of GDP, with an expected clear upward trend when temperatures continue to rise. Increased global warming is projected to lead to substantial changes in GDP per capita. Almost half of the Asia-Pacific countries considered in this analysis are projected to experience GDP losses between 30 and 41 per cent by the end of the century compared to the baseline scenario. Clear gains in GDP per capita of up to 12 per cent in mid-century and up to 18.3 per cent by the end of the century are expected for countries in the Pacific, South-East Asia, and South and South West Asia in achieving 1.5°C rise instead of 2°C. The largest gains are expected in Thailand, Cambodia, Bangladesh, the Lao People’s Democratic Republic and Viet Nam. Renewable energy provides a large range of benefits for sustainable development: వవ Renewable energy can be deployed rapidly, and in areas that are not connected to the grid, important for a region where not all of the population has access to electricity; వవ Installation of renewable energy can replace fossil imports creating security and also avoid price fluctuations of fossil fuel imports; వవ Renewable energy provides employment opportunities, and employment is crucial for post-COVID-19 recovery; వవ Phasing out coal reduces air, water and soil pollution as well as negative impacts on water quality and water scarcity. viii
Executive summary

Policy recommendations for key actors in the Asia-Pacific region

Drawing from the analysis of current trends and drivers in the Asia-Pacific region, the gap with Paris
Agreement benchmarks for phasing out coal and accelerating the transition to clean energy, as well as the
overview of policy areas including best practice examples in other regions, this study has formulated the
following recommendations for key actors in the Asia-Pacific region to accelerate phasing out coal in line
with the Paris Agreement benchmarks:

 1
      National Governments: Adopt best practice policies – phase out fossil fuel subsidies, carbon
      pricing, renewable energy support, encourage and push shifts in investment through green
      recovery

Phasing out fossil fuel subsidies, combined with the development of carbon pricing and targeted
adoption of key best practice policies to enhance the share of variable renewable energy and accelerate
investment – particularly in wind and solar – through market design, demand-side management,
transmission and distribution system enhancements, grid interconnections and support for energy
storage are crucial. Green recovery needs to be at the heart of economic stimulus packages developed
by Governments. This needs a focus to be placed on directing public funding and incentivising private
investments towards renewable energy and related technology and infrastructure development, such as
storage and transmission grids, as well as on electrification of end-use sectors and further measures to
improve energy efficiency across end-use sectors.

 2
      National Governments: Move to transformational policies, targets and long-term planning

The need to ratchet up NDC targets and develop long-term low carbon development strategies in the
context of the Paris Agreement is an important step, as these goals were due in 2020 and are expected no
later than 2021. Developing coal phase-out plans by 2040 is the single most important step that needs to
be included in these targets to ensure consistency with the Paris Agreement and SDGs. This needs to be
combined with a process of planning and managing the transition that is developed with stakeholders
from the regions affected, particularly those that currently depend on employment and income from coal
mining and coal-fired power generation.

 3
      Clear pathways to enable anticipation of change and avoidance of more stranded assets

An important element in elaborating NDC targets and long-term strategies in line with the Paris
agreement is the development of scenarios and analysis, involving and informing stakeholders and
supporting a dialogue about benefits at the sectoral level. A key gap in leading the development of both
national and regional strategies, plans and policies is the need to develop a range of scenarios for the
energy system that are in line with the Paris Agreement and SDGs, and to aim for 100 per cent renewable
energy.

 4
      Financial support and capacity-building

Countries in the Asia-Pacific region that are in the position to do so, need to focus their financial and
other development support on shifting investments and energy system transformation towards clean
energy. This holds true for Australia, Japan, the Republic of Korea, China and India, which currently play a
strong role in cementing dependency on fossil fuels in poorer countries in the region, particularly in the
South and South-East Asian subregions. Coordination of Government donors with philanthropy by the
private sector can be an important strategy. This approach has started with a focus on South-East Asia,
but it also needs to be applied to other countries in the Asia-Pacific region, particularly where investment
in new coal or gas-powered generation is only just starting.

                                                                                                         ix
COAL PHASE OUT AND ENERGY TRANSITION PATHWAYS
FOR ASIA AND THE PACIFIC
5
Regional and international cooperation – alignment with Paris Agreement Goals, engaging
stakeholders, the private sector and civil society
Regional and international cooperation in the Asia-Pacific region can play an important role. Countries
in the region can either join existing initiatives such as the Powering Past Coal Alliance. This and other
recent initiatives in the area of energy system transformation are often successful when they include
Governments at both the national and subnational levels as well as the private sector, research
organisations and civil society in order to be effective in mobilising stakeholder engagement and
supporting a shift in narrative and perception. An initiative at the regional level could also focus on
joining efforts to overcome barriers to shifting away from coal production and dependency on coal
exports among countries or by subnational legislation in the region.
6
Trans-boundary grid transmission and integration
An important area for enhanced regional cooperation is grid transmission and trans-boundary grid
integration. This can build on existing examples and initiatives, and needs to be further developed
with the objective of achieving 100 per cent renewable energy systems. Existing initiatives can be built
on, or similar initiatives can be applied to other subregions. With some of the world’s best renewable
energy potentials in some subregions – for example, the Pacific (Australia), parts of South and South-East
Asia, and Central and East Asia – such cooperation provides huge opportunities for faster transition to
100 per cent renewable energy. This includes countries that have lower potential or higher demand, e.g.,
with high population density.
7
Financial institutions – cooperation in sustainable finance, clear policies and transparency
More countries in the Asia-Pacific region are joining initiatives such as the Climate Investment Platform
or the recently launched International Platform of Sustainable Finance that now has 14 members
including China, India, Indonesia and New Zealand. This can be an opportunity to benefit from scaling
up the mobilisation of private capital towards environmentally sustainable investments dialogue
between policymakers that are in charge of developing sustainable finance regulatory measures, thereby
potentially moving towards alignment of best practices.
8
Private sector engagement
The private sector can play an important role in accelerating investment in renewable energy as it is an
important source of growing demand as well as by joining private-public partnerships and initiatives
to finance large-scale renewable energy projects. Initiatives in the private sector have also started to
develop benchmarks for decisions at the sectoral level. Incorporating climate risk is an important element
in providing the right information to the private sector, and public finance institutions should set an
example. ESCAP could support this effort by encouraging the development of clear benchmarks at the
regional level.
xIntroduction
T
h e A s i a - Pa c i f i c re g i o n 2 co n t r i b u t e s
significantly to the increasing global
greenhouse gas emissions, particularly
through its high reliance on fossil fuels
– especially coal – for power generation
as well as its dynamic growth that is increasing
demand for energy, particularly electricity, to meet
development needs. A key issue for the region is
how to reverse the fossil fuel trend, particularly in
view of the current and future climate impacts and
the benefits of sustainable development that are
possible through energy transition as well as
the unprecedented circumstances of the global
COVID-19 pandemic. This report provides
insights into how the region can transition
away from coal to a renewable-based
efficient energy system that is compatible
with the Paris Agreement and SDGs.
The Asia-Pacific region dominates
both current use of coal for power
generation and the global expansion
o f coal-f i re d p o w e r ge n e ra t i o n ,
Introduction with 76 per cent of current global
coal capacity and 94 per cent of
global planned new coal capacity
for power generation. The region
also dominates coal production and
consumption overall, accounting for
80 per cent of global coal production
as well as of global consumption. Asia
and the Pacific is therefore a crucial
region in efforts to achieve the global
benchmark to phase out coal-fired
power generation globally by 2040
as a key step to achieving the Paris
Agreement’s long-term temperature goal.
With an increasing awareness of the need
to halt further expansion of coal-fired power
generation and transition away from coal, it is
important for the Asia-Pacific region to tackle this
challenge. Understanding what is driving current
developments and how to join a growing global
momentum against coal is essential if countries are
to be able to respond to the call by the United Nations
Secretary-General for a moratorium on new unabated coal-
fired power generation. The growth of the Powering Past Coal
2 For the purposes of this report, the “Asia-Pacific region” is defined as comprising the 53
member States of ESCAP.
1COAL PHASE OUT AND ENERGY TRANSITION PATHWAYS
FOR ASIA AND THE PACIFIC
Alliance, established in 2017, now has a total of pandemic, and implications of coal expansion
110 members, including 34 national Governments plans for regional greenhouse gas emissions.
and 33 subnational government authorities, is an
indication of this increasing momentum. Chapter 2 identifies the drivers of coal expansion
in the region, contextualised in contrast to the
Given the important role of the Asia-Pacific global trends away from coal. These drivers need
countries in coal-fired power generation, to be identified in order for Chapter 3 to delve
understanding how countries in this region into the question of how the region’s trends
can benefit from joining in and accelerating a towards fossil fuels can be reversed, and to
transition away from coal and towards renewable assess the options for a clean energy transition.
energy is more important than ever. While coal
is also used in other parts of the energy system Chapter 3 offers a systematic literature review
such as industrial and residential heat, and steel of published global, regional and subregional
production, the focus in this study is on coal-fired scenario pathways for renewable energy in
power generation as a key benchmark for the electricity generation. This chapter develops
overall phasing out of coal. To reach a pathway key regional benchmarks of Paris Agreement
consistent with the Paris Agreement, existing compatible pathways for coal and renewable
coal fired capacity would need to be shuttered or energy in power generation, building on an
operated less before the end of asset lifetimes. analysis in Climate Action Tracker (2020), and
Hence, each additional coal development the feasibility of 100 per cent renewable energy
increases the risk of stranded assets. The region systems. Chapter 3 also explores the feasibility of
can benefit from falling costs for renewable a renewable energy transition, assessing the large
energy and storage technologies, providing an untapped potential for renewable energy across
alternative pathway towards affordable, reliable the region, and provides available information
and clean energy access. on cost at the regional level, with a focus on wind
and solar.
This report brings together a systematic review of
literature and data to provide a background on Chapter 4 highlights the benefits of transitioning
the current situation, drivers of coal expansion, away from fossil fuels towards a renewable
options for a clean energy transition and the based efficient energy system, particularly with
benefits of a transition to inform policy options. reference to meeting the Paris Agreement and
It extracts data on coal share in power generation SDGs, and a green economic recovery from
and capacity in the Asia Pacific region, and details the COVID-19 pandemic impacts. It provides
its own analysis of the impact on greenhouse an assessment of proven policies that need
gas emissions at the regional level as well as the expansion and acceleration across the region,
regional economic impacts of global warming. focusing on whole-of-the-economy approaches,
The report also conducts a policy review to and the research and development needed for
assess the proven policies in the region based on decarbonisation
existing literature, to suggest recommendations
for Governments to adopt best practices. Chapter 5 concludes by offering possible
solutions to decarbonising the region with
Chapter 1 provides an understanding of the b e s t p ra c t i c e p o l i c i e s a n d p l a n n i n g f o r
current situation by exploring the current national Governments as well as regional and
regional energy trends, coal expansion plans, international cooperation.
recent trends including the impact of the
2Chapter 1
Current situation, trends
and expansion plans
1.1 Current role of coal for power generation the Asia-Pacific region and consumption peaked
in the Asia-Pacific region in 2014. More than 50 per cent of demand is
in China, where coal usage peaked in 2013 (BP,
Global coal consumption peaked in 2013, with 2020). Two-thirds of coal consumed globally
a rebound in 2017 and 2018 due to increased is for electricity generation (IEA, 2020d); coal
demand for power generation; however, it has consumption for this purpose was increasing
been decreasing since 2007 in OECD countries. until 2019.
About 80 per cent of global coal is consumed in
Figure 1\
CO2 emissions from coal by sector
10
8
GtCO2
6
4
2
0
1990 1995 2000 2005 2010 2015 2017
Year
Electricity and heat Manufacturing Industry Transport
Source: Global Carbon Project, IEA 2019.
3COAL PHASE OUT AND ENERGY TRANSITION PATHWAYS
FOR ASIA AND THE PACIFIC
Carbon dioxide emissions from coal combustion approximately 60 per cent of non-electricity, non-
for electricity generation and heating accounted iron/steel-based demand coming from cement
for 67 per cent of the total global emissions production in 2017 (International Energy Agency,
from coal combustion in 2017 (figure 1). The 2019; and World Coal Association, 2020). China
remaining emissions stemmed primarily from dwarfed all other countries in cement production
iron, steel and cement production (Peters et al., in 2019, producing an estimated seven times
2020). In 2017, global consumption from iron and more cement than second-placed India, and
steel production constituted 16 per cent of total again accounted for more than half of total global
demand, and 47 per cent of all non-electricity production (Curry, 2020). Viet Nam, a country
and heat-related energy demand (International with a considerable network of coal-fired power
Energy Agency, 2019). stations, was estimated to be the world’s third-
largest producer of cement in 2019.
A profound shift in the source of global iron
and steel production occurred during recent While these trends point to a need for discussion
decades, with 83 per cent of global production on transition away from coal use across the
coming from non-OECD countries, compared energy system, it is important to note that
with 45 per cent in 1978. This is primarily due to phasing out coal use in the power sector is a
a steep rise in Chinese production, with China relatively low-hanging fruit. The technological
accounting for more than half of total global steel alternatives to fossil fuels in the electricity sector
production in 2018 compared with just 15 per cent are mature and ready to deploy if there is an
in 2000 (World Steel Association, 2020). enabling policy environment, and it is for this
reason this report focuses on coal use in the Asia-
A large proportion of the remaining global coal Pacific electricity sector.
consumption is by the cement industry, with
Figure 2\
Coal generation as percentage of national electricity generation in
2019
100% coal 80% 60% 40% 20% 0%
Source: Ember, 2020
Note: The boundaries shown and the designations used on this map do not imply official endorsement or acceptance by the United Nations.
4Chapter 1 \ Current situation, trendsand expansion plans
The Asia-Pacific region holds a very large share factors driving electricity demand in the Asia-
of current global coal capacity and power Pacific region. The region includes many countries
generation as well as expansion plans. A total that are still working on providing access to
of 27 countries in the region have coal capacity electricity, which together with economic and
larger than 30 MW (Global Energy Monitor, 2020) population growth, and urbanization, is one
and account for about 75 per cent of current of the driving factors for the high growth in
global coal generation capacity (approximately electricity demand. Figure 2 shows the percentage
1,500 GW). Many ESCAP member States hold of coal generation in electricity production
a high share of coal-fired power generation. globally.
The Asia-Pacific region is out of step with
the trend of decreasing coal use that is seen Table 1 shows the share of coal in both power
elsewhere, particularly in the European Union generation and capacity for the Asia-Pacific
and the United States. Efforts to reduce coal use countries arranged in order of highest to lowest
elsewhere are being offset by an expansion of coal capacity. The top eight (China, India,
coal consumption in the Asia-Pacific region, and Japan, Russian Federation, Republic of Korea,
the rapidly increasing share of global coal use Indonesia, Australia, Viet Nam) account for about
correspondingly implies the growing importance 70 per cent per cent of global coal capacity –
of local efforts to phase out its use. China and India account for 61 per cent. The Asia-
Pacific region, as a whole, accounts for 76 per cent
There is great diversity regarding socioeconomic of global coal capacity.
development, access to electricity and other
Table 1\
Share of coal in power generation and capacity in the Asia-Pacific
region by economy
Economy Share of coal fired Total current coal Share of global Net Capacity Retired
power in national power capacity (MW) coal capacity (%) Change: Jan 2020 (2017-
generation (%) (2018) to July 2020 2020)
China 66.8% 1,022,877 50.0% 9 671 27,684
India 73.5% 228,157 11.1% -300 7,514
Japan 32.3% 48,309 2.4% 1,245 960
Russian Federation 15.9% 44,562 2.2% -1,080 2,535
Republic of Korea 44.1% 36,436 1.8% -1,120 1,845
Indonesia 56.4% 33,135 1.6% 250 0
Australia 60.5% 25,107 1.2% 0 1,840
Viet Nam 47.4% 19,717 1.0% 688 0
Taiwan 47.5% 18,873 0.9% 0 362
Province of China
Turkey 37.2% 17,717 0.9% 57 0
Malaysia 45.3% 13,529 0.7% 0 0
Kazakhstan 69.6% 12,704 0.6% 0 0
Philippines 52.4% 9,954 0.5% 0 0
Hong Kong, China 66.5% 6,110 0.3% 0 500
Thailand 20.0% 5,933 0.3% 0 600
Pakistan 7.7% 5,090 0.2% 0 0
5COAL PHASE OUT AND ENERGY TRANSITION PATHWAYS
FOR ASIA AND THE PACIFIC
Economy Share of coal fired Total current coal Share of global Net Capacity Retired
power in national power capacity (MW) coal capacity (%) Change: Jan 2020
generation (%) (2018) to July 2020
Democratic Peoples’ 12.0% 3,700 0.2% 0 0
Republic of Korea
Uzbekistan 3.4% 2,522 0.1% 0 0
Lao Peoples’ 34.9% 1,878 0.1% 0 0
Democratic Republic
Bangladesh 1.9% 1,185 0.1% 660 0
Kyrgyzstan 7.0% 910 0.04% 0 195
Sri Lanka 30.9% 900 0.04% 0 0
Mongolia 88.5% 816 0.04% 0 0
Cambodia 37.4% 505 0.02% 0 0
New Zealand 3.6% 500 0.02% 0 0
Tajikistan 6.8% 400 0.02% 0 0
Brunei Darussalam 0% 220 0.01% 0 0
Myanmar 6.3% 160 0.01% 0 0
Papua New Guinea - 0 0 0 0
Total Asia-Pacific 1,561,906 76.3% 10,071 44,036
Global 39% (2019) 2,047,046 100% -2,930
Source: IEA, 2020d and authors’ calculations based on Global Energy Monitor, 2020.
Note: Note: Countries are listed here in descending order based on their current coal capacity. Countries not included in the table do not have coal
power plants bigger than 30 MW and are not planning new ones.
1.2 Planned coal fired power generation (4 per cent), the Philippines (2 per cent), Japan
(2 per cent), Mongolia (1 per cent) and Pakistan
(1 per cent). Just five countries – China, India,
The Asia-Pacific region accounts for almost the Turkey, Indonesia and Viet Nam account for
entire global coal-fired power development 80 per cent of the global coal pipeline.
pipeline, and a 94 per cent share of all coal-
fired power plants in construction, planned or Figure 3 shows the cumulative capacities in the
announced3 (a total of about 500 GW). different stages of development by technology,
which is relevant to the impact on greenhouse
Table 2 shows the coal pipeline in countries in gas emissions. Subcritical, supercritical and ultra-
the Asia-Pacific region, in different stages of super critical power plants can be differentiated
development. For most countries, it confirms by the pressure of the boiler used in coal power
the tendency of shrinking expansion plans, in plants; the pressure is the lowest in subcritical
particular over the first half of 2020; however, power plants and the highest in the ultra-
China, the Philippines and the Russian Federation supercritical power plants, with efficiency
show a net increase in the coal pipeline. The increasing with the boiler pressure.4 However, the
top 10 countries account for 91 per cent of the likelihood of the pipeline ever being completed
total global coal pipeline – China (48 per cent), is shrinking. For example, the Philippines recently
India (12 per cent), Turkey (6 per cent), Indonesia announced a moratorium, which could take out
(6 per cent), Viet Nam (6 per cent), Bangladesh up to 8 GW to 10 GW of their pipeline (Ahmed and
Brown, 2020; and Department of Energy, 2020).
3 “Announced” refers to proposed plants that have been
described in corporate or government plans but have not
yet taken concrete steps such as applying for permits or 4 For a more detailed overview see https://www.gem.wiki/
acquiring land. Coal_power_technologies
6Chapter 1 \ Current situation, trendsand expansion plans
Table 2\
The coal pipeline in the Asia-Pacific region: Current expansion plans
and recent changes
Economy Total coal Currently Announced Total coal Share of Change in
capacity in Planned coal coal capacity pipeline: in global coal pipeline
construction capacity (MW) construction, pipeline (construction,
(MW) (MW) planned, (in %) planned, announced
announced minus cancelled) Jan
(MW) 2020 to July 2020
China 98,520 105,162 48,564 252,246 48.35 45 275
India 35,205 23,518 6,030 64,753 12.41 -22 998
Japan 7,424 2500 0 9,924 1.9 -247
Russian Federation 656 1000 786 2,442 0.47 195
Republic of Korea 7,260 0 0 7,260 1.39 0
Indonesia 11,290 10,370 9,660 31,320 6 -5,700
Australia 0 0 2,320 2,320 0.44 -660
Viet Nam 7,420 19,480 2,840 29,740 5.7 -540
Taiwan 0 0 0 0 0 0
Province of China
Turkey 1,610 18,605 13,460 33,675 6.46 -550
Malaysia 0 0 0 0 0 0
Kazakhstan 636 0 0 636 0.12 0
Philippines 1,941 9,240 900 12,081 2.32 1,328
Hong Kong, China 0 0 0 0 0 0
Thailand 0 56 1,255 1,311 0.25 -1,000
Pakistan 1,650 4,260 1,538 7,448 1.43 -220
Democratic People’s 0 0 0 0 0 0
Republic of Korea
Uzbekistan 0 0 150 150 0.03 0
Lao People’s 0 0 2,800 2,800 0.54 -700
Democratic
Republic
Bangladesh 4,754 3,960 12,290 21,004 4.03 -120
Kyrgyzstan 0 0 0 0 0 0
Sri Lanka 0 0 1,200 1,200 0.23 0
Mongolia 850 5,280 1,400 7,530 1.44 0
Cambodia 150 1,400 265 1,815 0.35 0
New Zealand 0 0 0 0 0 0
Tajikistan 0 0 0 0 0 0
Brunei Darussalam 0 0 0 0 0 0
Myanmar 0 0 0 0 0 -1,090
Papua New Guinea 0 60 0 60 0.01 0
Total Asia-Pacific 179,366 204,891 105,428 489,715 93.9% 12,973
Total global 189,817 217,803 114,698 521,688 100% 2,955
Asia-Pacific 94.5% 94.1% 91.9% 93.9% 93.9% -
share of global
Source: Authors’ calculations based on Global Coal Plant Tracker (information as of July 2020) (Global Energy Monitor, 2020).
Note: The economies are listed here in a descending order based on their current coal capacity. Countries not included in the table do not have coal
power plants bigger than 30 MW and are not planning new ones. Coal capacity in pipeline: In different phases ranging from construction to planned
or announced. Currently planned coal capacity includes plants that are in different stages of pre-permit development or have received all necessary
approvals but not yet begun construction. Announced refers to proposed plants that have been described in corporate or government plans but have
not yet taken concrete steps such as applying for permits or acquiring land.
7COAL PHASE OUT AND ENERGY TRANSITION PATHWAYS
FOR ASIA AND THE PACIFIC
Figure 3\
Current coal fleet and pipeline in Asia-Pacific region by status
and technology
Capacity by status and technology
1,600
1200
Capacity GW
800
400
0
Operating Construction Planned Announced
Year
Ultra super critical Super critical Sub critical Other Unknown
Source: Authors’ calculations based on data from Global Energy Monitor, 2020.
It is also unlikely that the announced or proposed representing 11 per cent of fine dust pollution in
coal-fired power plants in Australia will ever be 2018 (Climate Analytics, 2020b).
built.5
As could be expected, such a large region is
Of the total of about 490 GW of coal capacity highly differentiated across subregions. Here we
in the pipeline, a large share is planned for look more closely into Asia-Pacific subregions
ultra-super critical or super critical (best with the highest expansion plans and group
available) technology, whereas about half of the countries regarding the significance of their
currently planned 1,500 GW project pipeline is expansion plans in relation to currently operating
subcritical. The shift to more modern technology capacity. We group countries in the Asia-Pacific
is motivated by efficiency gains. However, even subregions into categories, distinguishing
with a high share of super critical or ultra-super between countries with relatively stable or
critical units, impacts on air pollution and contracting coal capacities (where there are no
greenhouse gas emissions would remain high. major expansion plans or expansion plans are
For example, the Republic of Korea has one of smaller than retired capacity); and countries
the highest shares of ultra-super critical coal with expanding coal capacities. For the latter, we
power plants in the world, and still the sector’s distinguish between those with high expansion
contribution to air pollution is very significant, p l a n s i n co m pa r i s o n to cu r re n t ca pa c i t y
from those with higher current capacity than
5 Two new coal-fired power plants have been proposed
in Australia by two owners/developers who have
sought federal government funding. For one of them, in
Collinsville, NSW, a feasibility study is being funded by the
federal Government. A new plant at Hazelwood (Victoria)
has not been shortlisted for a government underwriting
programme.
8Chapter 1 \ Current situation, trendsand expansion plans
Table 3\
Country groupings by Asia-Pacific subregion and coal capacity
expansion categories
Category Asia-Pacific subregion
North and East and South and South-East Pacific
Central Asia Northeast Asia Southwest Asia
Asia
Stable/contracting Small or no Kazakhstan6 Democratic People’s Brunei Darussalam Australia, New
net expansion; Kyrgyzstan Republic of Korea Malaysia Zealand
expansion smaller Russian Federation Hong Kong , China, Myanmar
than retired Tajikistan Japan
capacity Uzbekistan Republic of Korea7
Taiwan Province of
China
Continuing Current capacity -- China India Indonesia --
expansion from larger than pipeline Thailand
high-current
capacity
Accelerating Pipeline larger than -- Mongolia Bangladesh Philippines --
expansion current capacity Pakistan Viet Nam
compared to Sri Lanka Cambodia
current capacity Turkey Lao People’s
Democratic
Republic
New Player No current capacity, -- -- -- -- PNG
but planning new
capacity
Share of current coal capacity within 3.9% 72.8% 16.2% 5.5% 1.6%
Asia-Pacific region China: 65% India: 14.6%
Without China: Without India:
7.3% 1.6%
Share of coal pipeline within Asia-Pacific 0.7% 56.6% 26.2% 16.2% 0.5%
region China: 51.5% India: 13.2%
Without China: 5% Without India:
12.9%
Source: Authors’ calculations, based on data from Global Energy Monitor, 2020.
expansion plans, which typically have not relied (table 3). The subregions show very different
or relied substantially on coal until recently. characteristics concerning the age distribution of
Only one country in the region (Papua New their coal fleet.
Guinea) does not have any current coal capacity
but is planning new capacity (“new player”) Of the five countries in the North and Central
Asia subregion with coal capacity above 30 MW,
6 Kazakhstan would currently fall into the “expanding” none has meaningful expansion plans. They
category, as it has 636 MW under construction, but has no have largely unchanged or slightly contracting
further pipeline. total capacity with ageing coal fleets (figure 4).
7 Japan and the Republic of Korea are still expanding, as
they both have capacity in construction and, in the case of This subregion includes 4 per cent of current
Japan, in permitted state. coal capacity within the Asia-Pacific, but only
9COAL PHASE OUT AND ENERGY TRANSITION PATHWAYS
FOR ASIA AND THE PACIFIC
Figure 4\
Current coal fleet and pipeline (left) and age distribution (right)
in the North and Central Asia (NCA) subregion by status
and technology
Capacity by status and technology
70 140
60 120
50 100
Capacity GW
40 80
30 Number 60
20 40
10 20
0 0
Operating Construction Planned Announced 10 or less 11-20 21-30 31-40 41-50 51-60 61 or
greater
Age (years)
Ultra super critical Super critical Sub critical Other Unknown
Source: Authors’ calculations, based on data from Global Energy Monitor, 2020.
Note: This region is characterised by an ageing coal fleet and a high share of subcritical technology.
0.7 per cent of the coal expansion pipeline and a Two countries in the East and North-East Asia
large share of sub-critical technology. region, China and Mongolia, are currently
expanding and continuing to plan expansion
This is similar in the Pacific countries with of their coal capacity. In Mongolia, the capacity
coal capacity, mainly Australia, and with some growth expansion plans are larger than the
capacity in New Zealand. One country in the current capacity. For China, the capacity growth
Pacific, Papua New Guinea, has no current coal expansion plans are smaller than the current
capacity but is planning new capacity (“new capacity. This is partly influenced by the policies
player”). of control over coal consumption and its share
in the energy mix in the thirteenth Five-Year Plan
The coal fleets in the East and North-East Asia (2016-2020) (Wang et al., 2020), which is reinforced
subregion are typically stable or contracting, but by actions against air pollution and climate
younger compared to the coal fleet in the North change in China (Hang et al., 2019).
and Central Asia or Pacific subregions. They have
a much higher share of more modern, more China alone is home to about half of all operating
efficient technology (super critical, ultra-super coal power and almost half the global coal
critical) (figure 4). Japan and the Republic of pipeline (Global Energy Monitor, 2020) (see
Korea are currently still expanding their capacity tables 1 and 2, and Figure 6). However, with the
but are actively discussing policies to reduce coal strong growth in renewable energy, the recently
use.
10Chapter 1 \ Current situation, trendsand expansion plans
Figure 5\
Current coal fleet and pipeline in countries in the East and North-
East subregion (ENEA) with stable or contracting coal capacity,
by status and combustion technology
Capacity by status and technology
120 140
120
90
100
Capacity GW
80
Number
60
60
40
30
20
0 0
Operating Construction Planned Announced 10 or less 11-20 21-30 31-40 41-50 51-60 61 or
greater
Age (years)
Ultra super critical Super critical Sub critical Other Unknown
Source: Authors’ calculations, based on data from Global Energy Monitor, 2020.
Note: Economies included: the Democratic People’s Republic of Korea; Hong Kong, China; Japan; Republic of Korea; and Taiwan Province of China. Most
are OECD countries, with a relatively high share of super critical and ultra-super critical technology.
announced long-term target of carbon neutrality While India also still relies strongly on coal-
by 2060, strengthening the NDC target by 2030 fired power generation, this has decreased and
to aim for peaking CO2 emissions earlier than the pipeline is shrinking. With strong policies
2030, and existing policies to reduce overall coal to enhance renewable energy uptake, there is
use in primary energy and capping coal, there is potential for India to move away faster from coal
expectation for change in relation to coal-fired (figure 8).
power generation.
Turkey stands out as the only OECD country with
Countries in the South and South-West Asia such a high coal expansion pipeline. The other
subregion with coal capacity are all expanding OECD countries, e.g., the Republic of Korea and
their capacity, most with very high expansion Japan, are developing policies to move away from
plans compared to their current capacity. dependency on coal.
This reflects their fast-growing energy output,
particularly electricity demand. This group of The South-East Asian subregion is dominated by
countries include only 2 per cent of current countries with expansion plans, mostly from an
coal capacity within the Asia-Pacific region, but already high current capacity – Indonesia, the
13 per cent of the expansion pipeline within the Philippines, Thailand and Viet Nam – with the
region. Philippines and Viet Nam still having expansion
11COAL PHASE OUT AND ENERGY TRANSITION PATHWAYS
FOR ASIA AND THE PACIFIC
Figure 6\
Current coal fleet and pipeline in China, by status and combustion
technology
Capacity by status and technology
1,500 1,400
1,200
1,000
1,000
750
Capacity GW
800
Number
600
500
400
250
200
0 0
Operating Construction Planned Announced 10 or less 11-20 21-30 31-40 41-50
Age (years)
Ultra super critical Super critical Sub critical Other Unknown
Source: Authors’ calculation, based on data from Global Energy Monitor, 2020.
Figure 7\
Coal capacity by status and technology, in countries in the South
and South-West Asia (SSWA) subregion with high expansion plans
compared to current capacity
Capacity by status and technology
30 50
40
20
Capacity GW
30
Number
20
10
10
0 0
Operating Construction Planned Announced 10 or less 11-20 21-30 31-40 41-50
Age (years)
Ultra super critical Super critical Sub critical Other Unknown
Source: Authors’ calculation, based on data from Global Energy Monitor,2020.
Note: This group includes Bangladesh, Pakistan, Sri Lanka and Turkey.
12Chapter 1 \ Current situation, trendsand expansion plans
Figure 8\
Current coal fleet and pipeline in India by status and technology
Capacity by status and technology
250 500
200 400
Capacity GW
150 300
Number
100 200
50 100
0 0
Operating Construction Planned Announced 10 or less 11-20 21-30 31-40 41-50 51-60
Age (years)
Ultra super critical Super critical Sub critical Other Unknown
Source: Authors’ calculation, based on data from Global Energy Monitor, 2020.
Figure 9\
Coal capacity by status and technology, (left) and age distribution
(right) for countries in the South-East Asian (SEA) subregion (all
categories)
Capacity by status and technology
100 250
80 200
Capacity GW
60 150
Number
40 100
20 50
0 0
Operating Construction Planned Announced 10 or less 11-20 21-30 31-40 41-50
Age (years)
Ultra super critical Super critical Sub critical Other Unknown
Note: Authors’ calculation, based on data from Global Energy Monitor, 2020
pipelines larger than the current capacity. characterised by high growth in demand for
Cambodia and the Lao People’s Democratic energy, particularly electricity, includes 5 per cent
Republic currently have low capacity but large of the Asian-Pacific region’s coal capacity, but
expansion plans. This subregion, which is 16 per cent of its coal pipeline.
13You can also read