Cognition - Lab Conscious
←
→
Page content transcription
If your browser does not render page correctly, please read the page content below
Cognition 211 (2021) 104638
Contents lists available at ScienceDirect
Cognition
journal homepage: www.elsevier.com/locate/cognit
Did you see it? Robust individual differences in the speed with which
meaningful visual stimuli break suppression
Asael Y. Sklar a, *, Ariel Y. Goldstein b, Yaniv Abir c, Alon Goldstein d, Ron Dotsch e,
Alexander Todorov f, Ran R. Hassin g, *
a
Edmond & Lily Safra Center for Brain Sciences, The Hebrew University of Jerusalem, Jerusalem, Israel
b
Princeton Institute of Neuroscience, Princeton University, Princeton, NJ, USA
c
Department of Psychology, Columbia University, NY, USA
d
Department of Psychology, The Hebrew University of Jerusalem, Jerusalem, Israel
e
Anchormen, Amsterdam, Netherlands
f
Booth School of Business, University of Chicago, USA
g
James Marshall Chair of Psychology, Department of Psychology and The Federmann Center for the Study of Rationality, The Hebrew University of Jerusalem,
Jerusalem, Israel
A R T I C L E I N F O A B S T R A C T
Keywords: Perceptual conscious experiences result from non-conscious processes that precede them. We document a new
Consciousness characteristic of the cognitive system: the speed with which visual meaningful stimuli are prioritized to con
Individual differences sciousness over competing noise in visual masking paradigms. In ten experiments (N = 399) we find that an
Visual perception
individual’s non-conscious visual prioritization speed (NVPS) is ubiquitous across a wide variety of stimuli, and
generalizes across visual masks, suppression tasks, and time. We also find that variation in NVPS is unique, in
that it cannot be explained by variation in general speed, perceptual decision thresholds, short-term visual
memory, or three networks of attention (alerting, orienting and executive). Finally, we find that NVPS is
correlated with subjective measures of sensitivity, as they are measured by the Highly Sensitive Person scale. We
conclude by discussing the implications of variance in NVPS for understanding individual variance in behavior
and the neural substrates of consciousness.
And then, you suddenly become aware: it might be of a child running information to be consciously experienced it must be integrated with
into the road in front of your car, your friend walking on the other side of currently active information in the brain (Tononi, 2008; for reviews see
the street, or a large spider on your shoe. On the timeline that stretches Dehaene, Charles, King, & Marti, 2014; Tononi & Koch, 2015). Finally,
between non-conscious processes and the conscious experiences that Local Ignition theories suggest that a “local ignition”, a stable recurrent
emerge from them, this paper focuses on the moment in which your pattern of neuronal activity, often in the relatively early perceptual
visual conscious experiences begin: just when you become aware of the layers of the cortex, is closely associated with conscious perception
child, your friend or the spider. Before this moment visual processing is (Malach, 2007; Noy et al., 2015; Zeki, 2003).
strictly non-conscious; after this point a mix of conscious and non- These frameworks hold, then, that (i) the process of rendering in
conscious processing ensues, influencing behavior, broadly defined. formation conscious takes time, and that (ii) only a (small) subset of the
Three prevalent theories describe the processes that precede information that is processed by our brains becomes conscious (see,
conscious experiences. According to Global Neural Workspace, Cohen, Dennett, & Kanwisher, 2016; Dehaene et al., 2006; Libet, 2009;
conscious experiences occur when activation in the occipito-temporal Sergent, Baillet, & Dehaene, 2005; Wu & Wolfe, 2018). These charac
cortex reaches higher association cortices, in which it is amplified and terizations mean that the lay belief, which holds that when we open our
broadcasted to the rest of the brain through long distance reverberation eyes we instantaneously see everything that is in front of us, is doubly
(e.g., Dehaene, Changeux, Naccache, & Sergent, 2006). Integrated In wrong. Conscious experiences are not immediate, and the process is
formation Theory, on the other hand, argues that for sensory selective.
* Corresponding authors.
E-mail addresses: Asaelsk@gmail.com (A.Y. Sklar), ran.hassin@huji.ac.il (R.R. Hassin).
https://doi.org/10.1016/j.cognition.2021.104638
Received 29 June 2020; Received in revised form 14 February 2021; Accepted 15 February 2021
Available online 16 March 2021
0010-0277/© 2021 Elsevier B.V. All rights reserved.
A.Y. Sklar et al. Cognition 211 (2021) 104638
This limited nature of conscious experiences compared to our overall (e.g., Nakamura & Kawabata, 2018; Yang, Zald, & Blake, 2007). First, it
sensory processing implies that the brain prioritizes information for allows subliminal presentations that can last seconds, enabling lengthy
consciousness.1 Indeed, in recent decades research of prioritization non-conscious processing. Second, bCFS measures spontaneous emer
processes found that both low-level visual features such as contrast, and gence into awareness, focusing on the moment in which a previously
higher-level cognitive determinants such as expectations, motivations, non-conscious stimulus becomes conscious.2 To examine the robustness
and semantic content, influence prioritization (e.g., Abir, Sklar, Dotsch, within bCFS, we use two different types of masks in CFS studies –
Todorov, & Hassin, 2018; Balcetis, Dunning, & Granot, 2012; Sklar colorful Mondrians and grey-scale stimuli that contain unusually-shaped
et al., 2012; Stein, Sterzer, & Peelen, 2012; Zeelenberg, Wagenmakers, & numbers (see Fig. 1 panels a and b).
Rotteveel, 2006). Crucially, to examine generality we use a new long duration masking
Here we begin exploring a here-to-fore neglected aspect of prioriti technique that we have recently introduced, Repeated Mask Suppression
zation – individual variability. An examination of the major theories of (RMS; Abir & Hassin, 2020). In RMS, a target stimulus is presented to
consciousness quickly reveals that they are silent regarding individual both eyes, and it is temporally interleaved with a mask (see Fig. 1 panel
differences. This silence implies that individual variation in prioritiza c). The phenomenology of doing RMS is similar to that of CFS – initial
tion is either non-existent or lies outside the scope of theories of con experience of the masks is followed by the target stimulus (or parts of it)
sciousness. The existing empirical literature concurs: to the best of our spontaneously emerging into consciousness. RMS has been used to
knowledge, no published research examined general individual differ replicate robust CFS findings (e.g., face inversion; face dimension; see
ences in prioritization. Abir & Hassin, 2020). Naturally, the process that blocks consciousness in
In this paper we propose that there are meaningful differences in RMS is not binocular rivalry, but rather competition of visual stimuli
how quickly we become aware of visual stimuli (Non-conscious Visual over time.
Prioritization Speed; NVPS). We suggest that these differences are gen It is important to note, that our choice to explore individual differ
eral, ubiquitous and unique. NVPS is general in that it characterizes per ences with the widely used paradigm of masking, allows us to examine
formance in various tasks; NVPS is ubiquitous in that it can be found for only a narrow meaning of prioritization. Namely, prioritization of
many types of stimuli, and NVPS is unique, in the sense that it is largely meaningful stimuli in the face of competing visual noise. Prioritizing in
independent of similar cognitive traits such as general speed of pro this narrow sense does not necessarily require a process that assigns
cessing, perceptual decision threshold, attentional networks, and short- values to non-conscious representations. Rather, it may be implemented
term memory. in the architecture of the cognitive system or in early bias in the inter
Individual variability is a potent source for theoretical development play between meaningful visual stimuli and noisy masks. This bias re
which allows one to test possible links between phenomena within and sults in (or implements) priorities (consider, e.g., the various ways in
across levels of analysis (Bolger, Zee, Rossignac-Milon, & Hassin, 2019). which the visual system prioritizes information from the fovea over
For example, examining individual variability helped establish the in information from the periphery; or the lack of a centralized selecting
dependent nature of attentional networks (e.g., Fan, McCandliss, Som process in natural selection). We further discuss these alternative in
mer, Raz, & Posner, 2002), and the degree to which different executive stantiations of prioritization in the General Discussion.
function tasks measure the same (vs. different) construct (thus leading to
the identification of core executive functions; Miyake & Friedman, 2. Overview
2012). Individual variability is also a potent tool in identifying neural
substrates of cognition (e.g., Kleinschmidt, Sterzer, & Rees, 2012) Ten experiments document large, consistent and robust differences
potentially leading to better understanding of both cognition and the in NVPS that are stable at least over short periods of time (Experiment
brain (e.g., Wimmer & Shohamy, 2012). 7). We address generality by showing strong correlations between bCFS
and bRMS: participants who are fast prioritizers in one paradigm are
1. The paradigms also fast when tested using the other (Experiment 3a) and between
different types of masks in bCFS (Experiment 3b). We demonstrate
The scientific study of consciousness within cognitive psychology ubiquity by examining a wide variety of stimuli, including words
and cognitive neuroscience relies heavily on masking paradigms that use (Experiment 2), numbers (Experiment 5), faces (Experiments 3, 3b, 4
visual noise to block percepts from breaking suppression. These tech and 6), and emotional expressions (Experiment 1). The issue of unique
niques allow scientists to map brain networks and activation patterns ness, that is – our claim that NVPS is largely independent from relevant
that are associated with conscious vs. non-conscious perception (e.g., cognitive traits, is addressed in multiple experiments establishing that
Dehaene et al., 2006; Kouider et al., 2013; Noguchi, Yokoyama, Suzuki, NVPS cannot be explained by variation in conscious cognitive speed
Kita, & Kakigi, 2012; Sterzer, Jalkanen, & Rees, 2009; Suzuki, Noguchi, (Experiment 4), perceptual threshold (Experiment 5), visual short-term
& Kakigi, 2015). They also allow for an exploration of conscious vs. non- memory (Experiment 6), and the efficacy of alerting, orienting and ex
conscious processes (e.g., inhibitory control; van Gaal, Ridderinkhof, ecutive attention (Experiment 7). Finally, we find that differences in
Fahrenfort, Scholte, & Lamme, 2008; face adaptation; Moradi, Koch, & NVPS are moderately correlated with self-reported differences in
Shimojo, 2005). Given the prevalence of masking in the literature, we sensitivity in the richness of experience (Experiment 8). Based on these
begin the foray into individual differences using such paradigms. results we conclude that NVPS is a robust trait, that affords new possi
The main paradigm we employ is breaking continuous flash sup bilities to advance our understanding of non-conscious processes, con
pression (bCFS; Tsuchiya & Koch, 2005). In bCFS, a stimulus is pre sciousness, and the related brain mechanisms.
sented to one eye while a dynamic mask is presented to the other eye
(see Fig. 1). Participants are asked to respond via key press when they
become aware of (any part of) the target stimulus. This reaction time is
our measure of participants’ NVPS.
bCFS is particularly suited for assessing prioritization for two reasons 2
There are disagreements regarding the interpretation of breaking time dif
ferences (e.g., Gayet, Stein, & Peelen, 2019; Stein, Hebart, & Sterzer, 2011).
Although these issues are less relevant to individual differences experiments, in
1
The other logical possibility, that all contents of conscious experiences are which all participants respond to the same stimuli, we address them directly in
stochastically determined, is unlikely given the adaptive advantage of allo multiple experiments by using more than one task (Experiment 3), and by
cating processing resources to stimuli that are important for one’s current testing the relationship between NVPS and (conscious) cognitive speed and
concerns. perceptual threshold (Experiments 4 & 5).
2
A.Y. Sklar et al. Cognition 211 (2021) 104638
Fig. 1. (a). Example of bCFS. A static stimulus, fading in over time, is presented to the left eye, while colorful Mondrians are presented to the right eye. Presentation
continues until participants indicate awareness. (b). Example of bCFS with grayscale numbers mask. (c). Example of bRMS. A static stimulus repeatedly presented
(here, for 33 milliseconds) with each presentation followed by a longer presentation of a mask (67 milliseconds) that suppresses the target stimulus from awareness.
Like in bCFS, The static stimulus fades in over time.
2.1. Experiment 1 NVPS.
Experiment 1 quantified individual variation in NVPS of emotional 2.1.3. Results
faces, a type of stimulus that has often been examined in bCFS (e.g., Following standard procedure when analyzing bCFS results (e.g.,
Yang et al., 2007). Abir et al., 2018), six participants who did not correctly locate the target
stimulus on at least 90% of trials were excluded from analysis3(Sklar,
2.1.1. Participants 2021). Replicating previous results (Sterzer, Hilgenfeldt, Freudenberg,
Twenty Hebrew University students (15 female) participated in this Bermpohl, & Adli, 2011), significant differences in response time of
experiment (see Expended Methods section below for details regarding different emotional expressions emerged, F2,26 = 24.40, P < 0.001, BF10
sample size choices for all experiments). > 1000. Neutral expressions (M = 1.76 s, SD = 0.43) entered con
sciousness sooner than Happy expressions (M = 1.96 s, SD = 0.57), and
2.1.2. Method both entered consciousness sooner than Sad expressions (M = 2.20 s, SD
Participants responded to happy, neutral and sad faces in a bCFS task. = 0.64).
To generate intraocular suppression, in each trial, an emotional face To examine our main hypothesis regarding individual variation in
appeared randomly in one of the four corners of the display area of one NVPS, we computed mean expression-specific RTs for each participant
eye while a dynamic Mondrian mask stimulus was presented over the per each type of face, and examined their correlations across partici
entire display area in the other eye (for more details regarding the pants. The higher this correlation, the more individuals’ visual priori
experimental procedure of all experiments see Expended Methods). tization speed varied consistently across expressions.
Participants responded by pressing a key to indicate the corner at which We found very strong correlations between participants’ RTs (which
the face appeared. Participants were instructed to respond as soon as index NVPS) for the different emotional expressions: r = 0.93, p < 0.001,
they noticed any part of the face. On each trial, the duration between the BF10 > 1000, credible interval 0.72 to 0.98; r = 0.97, p < 0.001, BF10 >
start of stimulus presentation and the participant’s response is the time it 1000, credible interval 0.85 to 0.99; and r = 0.94, p < 0.001, BF10 >
took the participant to become aware of and respond to the face. 1000, credible interval 0.75 to 0.98; for happy-sad, happy-neutral and
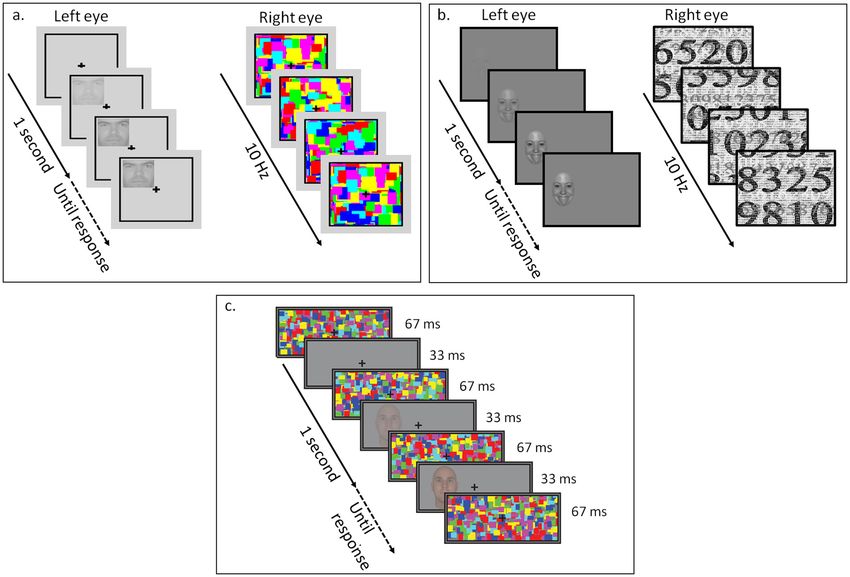
Therefore participants’ reaction times (RT) serve as our measure for sad-neutral (See Fig. 2). Thus, individuals consistently vary in NVPS,
3
The same exclusion rules – accuracy above 90% and mean reaction time not
further than three standard deviations from the group mean – were used in all
experiments. Where the second rule is not noted this is because no participants
were excluded due to its applications.
3A.Y. Sklar et al. Cognition 211 (2021) 104638
(caption on next page)
4A.Y. Sklar et al. Cognition 211 (2021) 104638
Fig. 2. Results overview. Panels a-i, correlations between measures of NVPS in Experiment 1 (panels a-b), Experiments 2 (c), Experiment 3a (d), Experiment 3b (e),
Experiment 4 (f), Experiment 5 (g), Experiment 6 (h) and Experiment 7 (i). Panels j-o, correlations between NVPS and measures of other traits (i.e., reducibility of
NVPS to other traits) in Experiment 4 (j, speed on a categorization task), Experiment 5 (k, decision threshold), Experiment 6 (l, short term visual memory) and
Experiment 7, (m-o, Alerting, Orienting and Executive attention). In all panels, lines represent linear least square best fit lines and speed values are in seconds,
attentional effect measures (panels m-o) are in milliseconds.
over and above the mean differences in the speed of reaction to different followed by a longer (67 milliseconds) presentation of a mask stimulus
emotional expressions (see Supplementary Analyses below for addi to suppress the target stimulus from awareness. Thus, while CFS relies
tional analyses). on interocular suppression, RMS relies on backward and forward
masking to achieve long-duration suppression.
In both tasks, participants were asked to detect target faces, which
2.2. Experiment 2
were masked using Mondrian masks. A manipulation of target face
detectability through varying presentation contrast allowed us to test
In Experiments 2a and 2b we examined individual variation in NVPS
the possible influence of stimulus detectability. Each participant was
of written language in two previously published datasets (Sklar et al.,
exposed to six contrast levels, spaced logarithmically between 30% and
2012, Experiments 4a and 4b) in which this individual variance was not
90% contrast in both the bCFS and bRMS tasks.
previously explored.
2.3.3. Results
2.2.1. Participants
Only participants who correctly located the target stimulus on at
Twenty eight Hebrew University students (14 female) participated in
least 90% of trials in the maximum contrast level in both tasks and
Experiment 2a and 30 Hebrew University students (18 female) partici
whose mean reaction time in both tasks did not differ by more than three
pated in Experiment 2b.
standard deviations from the group mean (50 participants) were
included in the analyses. As expected, there were significant main effects
2.2.2. Method
of stimulus detectability in both tasks (F(5,245) = 130.54, p < 0.001, BF10
We reanalyzed data from two previously published experiments
> 1000 and F(5.245) = 92.23, p < 0.001, BF10 > 1000 in the bCFS and
(Sklar et al., 2012, Experiments 4a and 4b) in which participants per
bRMS tasks respectively), with every level increase in contrast signifi
formed bCFS with valenced phrases (e.g., black eye). Using pilot ratings,
cantly reducing mean reaction time over the previous level in both tasks
we categorized phrases as either positive or negative.
(all F(1,49) > 31, p < 0.001, BF10 > 1000).
Crucially, for each of the contrast levels, NVPS performance in the
2.2.3. Results
bCFS and bRMS were significantly correlated (r = 0.63, r = 0.5, r = 0.5,
Only participants who correctly located the target stimulus on at
r = 0.43, r = 0.57 and r = 0.5 in contrast levels 0.3–0.9 respectively, all
least 90% of trials (27 and 28 in Experiments 2a and 2b respectively)
p < 0.001, BF10 > 100 except contrast level 0.58 in which r = 0.43, p =
were analyzed. As previously reported (Sklar et al., 2012),
0.002, BF10 = 17.98) and these correlations did not significantly differ
we found a significant difference between the RT of positive and
from each other (all Z < 1.36, p > 0.085). Overall, the correlation be
negative phrases, F1,26 = 6.90, p = 0.014, BF10 = 3.46 and F1,27 = 6.07,
tween NVPS averaged across all contrast levels between the bCFS and
p = 0.02, BF10 = 2.65 in Experiments 2a and 2b, respectively.
bRMS tasks was r = 0.56, p < 0.001, BF10 > 1000, credible interval 0.33
Crucially, when we averaged separately RTs for positive and nega
to 0.72. Thus, the results show strong evidence for generality of NVPS
tive stimuli within participant, and examined the correlation across
across the two suppression paradigms.
participants, we found that the correlations between the prioritization
speeds of positive and negative phrases were very high, r = 0.97, p <
0.001, BF10 > 1000, credible interval 0.91 to 0.98 in Experiment 2a and
2.4. Experiment 3b
r = 0.94, p < 0.001, BF10 > 1000, credible interval 0.87 to 0.97 in
Experiment 2b. Thus, the results show consistent individual variation in
Experiment 3b examines another aspect of the generality of NVPS.
NVPS of written language, over and above the differences in RT gener
Namely, whether individual variance in NVPS as it is measured using the
ated by stimulus meaning.
commonly used Mondrian masks, correlates with individual variability
in NVPS when measured with a different type of masking pattern (see
2.3. Experiment 3a Fig. 1 panel b).
Experiments 3a and 3b address the generality of NVPS across masks 2.4.1. Participants
and paradigms. Experiment 3a examine whether individual variance in Thirty-six Hebrew University students (29 female) participated in
NVPS measured in a bCFS paradigm correlates with variability in NVPS this experiment.
as measured by a different long-duration suppression paradigm, bRMS.
Importantly, the processes that underlie suppression in these two par 2.4.2. Method
adigms are different. In bCFS, it is binocular rivalry; in bRMS, it is Participants completed a bCFS task in which they were asked to
competition over time. If the two estimates of NVPS are correlated to a detect in which of three possible locations (left, middle or right side of
large degree, it would suggest that prioritization cannot be exhaustively the display area) a target face appeared. Faces were binocularly masked
explained by variability in the effectiveness of either masking process. using either dynamic Mondrian masks (50% of trials) or dynamic
grayscale number patterns (50% of trials). Because pilot testing indi
2.3.1. Participants cated that grayscale number patterns are more effective at masking
Fifty three Hebrew University students (38 female) participated in faces, the presentation contrast for target faces was set higher in the
this experiment. grayscale numbers trials (presentation alpha 70%) than in the Mondrian
mask trials (presentation alpha 50%).
2.3.2. Method
Participants completed a bCFS task and a breaking repeated masked 2.4.3. Results
suppression task (bRMS; Abir & Hassin, 2020). In RMS target stimuli are Only participants who correctly located the target stimulus on at
repeatedly presented briefly (34 milliseconds) with each presentation least 90% of trials (24 participants) were included in the analyses.
5A.Y. Sklar et al. Cognition 211 (2021) 104638
Possibly due to the higher target presentation contrast, mean response 2.7.1. Participants
times were significantly faster (t23 = 7.22, p < 0.001) for grayscale Sixty three Hebrew University students (38 female) participated in
numbers masks (M = 2.72 s, SD = 1.04) than for Mondrian masks (Mean this experiment.
= 4.56 s, SD = 1.5). Critically however, despite different masking
effectiveness, response times (i.e., NVPS) were strongly correlated be 2.7.2. Method
tween the two masking conditions (r = 0.57, p < 0.001, BF10 = 13.95, Participants completed two very similar tasks: (i) a bCFS task with
credible interval 0.19 to 0.77). Thus, the results show strong evidence masked arithmetic statements (e.g., 7–2–1 = 4; we used similar arith
for generality of NVPS across the two mask types. metic stimuli previously in Sklar et al., 2012) and (ii) a decision
threshold task in which the same stimuli and masks were presented to
both eyes so that no interocular masking occurred. In both tasks par
2.5. Interim discussion ticipants were asked to press a key indicating whether the target was
above or below fixation as soon as they saw the target. Importantly, in
In Experiments 1-3b, we found reliable and strong individual vari the threshold task the contrast (and therefore amount of information) of
ability in NVPS. This variability was consistent over both low-level targets was linearly ramped up during the first three seconds of each
factors (detectability; Experiment 3) and high-level factors (valance; trial (maximum 20% contrast). This task, then, allows us to approximate
Experiments 1and 2), and was strongly related between two suppression conscious decision threshold via measuring how quickly participants
paradigms (Experiment 3a) and two mask types (Experiment 3b). Ex react to conscious targets. Participants with higher decision thresholds
periments 4–7 serve as a test of the ubiquity of NVPS across different should be slower to decide, whereas participants with lower decision
stimulus categories and its stability over time. Additionally, they thresholds should be faster. Participants completed two blocks of bCFS
examine the uniqueness of NVPS, by estimating its correlations with followed by two blocks of the threshold task.
other factors that might be theoretically related to it: general cognitive
speed, attentional mechanisms and perceptual decision thresholds. 2.7.3. Results
Only participants who correctly located the target stimulus on at
2.6. Experiment 4 least 90% of trials and whose mean reaction time in the bCFS task did
not differ by more than three standard deviations from the group mean
Experiment 4 tested the hypothesis that NVPS is a result of general (59 participants) were included in the analyses.
processing speed. To test general speed we used a simple, conscious, There were strong correlations between the NVPS in the two blocks
categorization task. of the bCFS task, r = 0.78, p < 0.001, BF10 > 1000, credible interval
0.638 to 0.857 and between the two block of decision thresholds task, r
2.6.1. Participants = 0.74, p < 0.001, BF10 > 1000, credible interval 0.581 to 0.831.
Forty two Hebrew University students (26 female) participated in Crucially, there was a weak, and marginally significant, correlation
this experiment. between NVPS and decision thresholds, r = 0.249, p = 0.059, BF10 =
0.95, credible interval − 0.008 to 0.47. Moreover, when decision
2.6.2. Method threshold variance was statistically controlled for, the partial correlation
General processing speed was measured using reaction times in a between NVPS in the two blocks of the bCFS task, r = 0.78, p < 0.001
simple categorization task, in which participants categorized pictures as was almost identical to the simple correlation.
either faces or houses. Next, participants completed the bCFS task with Therefore, while some of the variance in performance in bCFS tasks
stimuli from the same categories. In both the bCFS and the conscious may be due to individual differences in thresholds, individual variation
categorization task, the frequency of each stimulus category was varied in NVPS is robust even when accounting for conscious perceptual
between participants, with half of the participants exposed to faces on thresholds.
80% of the trials, and the other half exposed to faces only on 20% of the
trials. As in the previous experiments, participants’ task in the bCFS task 2.8. Experiment 6
was determining the location of the target stimulus.
To test the possibility that differences NVPS stem from differences in
2.6.3. Results participants’ ability to encode or retrieve stimuli in short term visual
Only participants who correctly located the target stimulus on at memory, in Experiment 6 we examined whether NVPS is associated with
least 90% of trials (32 participants) were included in the analysis. There acuity of short-term visual memory in a previously published dataset
was a strong correlation between the processing speed of frequent and (the combined data of Experiments 1 and 2 in Abir et al., 2018) in which
infrequent stimuli, r = 0.86, p < 0.001, BF10 > 1000, credible interval individual variance in NVPS or its relation to short-term visual memory
0.71 to 0.93. NVPS of frequent and infrequent stimuli were also strongly were not previously examined.
correlated, r = 0.80, p < 0.001, BF10 > 1000, credible interval 0.59 to
0.89. 2.8.1. Participants
Crucially, however, categorization speed was not significantly Sixty five Hebrew University students (47 female) participated in this
correlated with NVPS, r = 0.18, p = 0.32, BF10 = 0.35, credible interval experiment.
− 0.17 to 0.48. Thus, while both general processing speed and NVPS
show consistent individual variations, there is no evidence that these 2.8.2. Method
individual differences are correlated. It appears, therefore, that Participants first completed an n-back task (n-1) on artificial faces,
conscious processing speed and NVPS do not share the same underlying similar to those used in Experiment 3, in which they were asked to
processes. identify instances where the same face appeared in consecutive trials.
Accuracy rates in this task serve as measures of acuity of visual short-
term memory (Phillips, 1974). Participants then completed two blocks
2.7. Experiment 5 of bCFS with the same stimuli.
Experiment 5 examined whether NVPS may be explained in terms of 2.8.3. Results
decision thresholds – the amount of information an individual seeks to Only participants who correctly located the target stimulus on at
gather before reaching a perceptual decision. least 90% of trials and whose mean reaction time in the bCFS task did
6A.Y. Sklar et al. Cognition 211 (2021) 104638
not differ by more than three standard deviations from the group mean across eyes, r = − 0.025, p = 0.92, BF10 = 0.28, credible interval − 0.43
(60 participants) were included in the analyses. The correlation between to 0.39 as well as the acuity difference between the dominant and non-
NVPS in the two blocks was high, r = 0.92, p < 0.001, BF10 > 1000, dominant eye, r = 0.053, p = 0.825, BF10 = 0.28, credible interval −
credible interval 0.86 to 0.95. 0.37 to 0.45.
Crucially, Short-term visual memory was not significantly correlated Thus, NVPS was not related to, and therefore cannot be explained by,
with NVPS, r = − 0.05, p = 0.72, BF10 = 0.17, credible interval − 0.29 to individual variation in attention or visual acuity.
0.20. Thus, NVPS cannot be explained by the short-term ability to
encode and quickly use visual stimuli. 2.10. Experiment 8
2.9. Experiment 7 In Experiment 8, we examined whether differences in NVPS are
echoed in people’s conscious, everyday life experience. Per unit of time,
Experiment 7 examined whether individual variation in NVPS relates people with faster NVPS are likely to experience more percepts than
to, and may therefore be explained by, individual variation in atten people with slow NVPS. This may suggest that people with fast (vs. slow)
tional capacities. NVPS tend to consciously experience more of their surroundings.
To examine correlates of NVPS we used the short version of the
2.9.1. Participants Highly Sensitive Person Scale (HSP; Aron, Aron, & Jagiellowicz, 2012).4
Twenty seven Hebrew University students (13 female) participated The HSP measures a personal tendency, that may be partly determined
in this experiment. genetically, towards general increased sensitivity – a basic tendency for
observing and noting more (i.e., processing more cues) at the cost of
2.9.2. Method acting slower (Aron et al., 2012). HSP scores correlate with better per
Cognitive and neuroscientific evidence documents three distinct formance in visual search (Gerstenberg, 2012), stronger neural activa
attentional functions – alerting, orienting and executive attention – that tion in high-level visual processing areas when detecting small
are supported by separate brain networks (Petersen & Posner, 2012; differences in visual scenes (Jagiellowicz et al., 2011) and with increase
Posner, 2011; Posner & Petersen, 1990). To measure these three atten in both negative and positive emotional reactivity (Acevedo et al., 2014;
tional functions, we used the Attention Networks Test (ANT), a widely Jagiellowicz, Aron, & Aron, 2016; Pluess et al., 2018).
used behavioral task that estimates individual variation for all three In light of the nature of HSP we hypothesized a negative correlation
functions (Fan et al., 2002). In the ANT, participants respond to the between HSPS and NVPS, such that more sensitive individuals will have
direction of a central arrow, which is preceded on some trials by either faster NVPS.
an alertness cue, or a cue predicting its location. On some trials, the
arrow is surrounded by either congruent or incongruent flanking arrows. 2.10.1. Participants
Differences between reaction times in the different conditions of the task Ninety two Hebrew University students (54 female) who had previ
represent the effectiveness of alerting or orienting attention, as well as ously participated in relevant bCFS experiments (experiments 3, 4 or 6
executive attention (indexed by the effect of conflicting flankers). from Abir et al., 2018 or a follow up experiment using the same face
Importantly, the executive component of the ANT has been previously stimuli) who were reached and willing to provide additional data are
linked to working memory capacity, fluid and crystallized intelligence included in this experiment.
(Redick & Engle, 2006; Tillman, Bohlin, Sørensen, & Lundervold, 2009;
Tourva, Spanoudis, & Demetriou, 2016). 2.10.2. Method
Participants completed, in the following order, (i) one block of bCFS The HSP is a self-reported measure of the experience of perceptual
task with pictures of faces in varying orientations; (ii) the ANT task sensitivity that has been linked to greater neural responses in higher
which lasted approximately 20 min, (iii) a second block of bCFS and (iv) order visual areas (e.g., Jagiellowicz et al., 2011), increased experience
the Landolt C visual acuity measure from the adaptive Freiburg Vision of non-ordinary states of consciousness under sensory deprivation
Test (Bach, 1996). The time difference between the two bCFS blocks (Jonsson, Grim, & Kjellgren, 2014; Kjellgren, Lindahl, & Norlander,
additionally allows us to test whether individual variation in NVPS is 2009) as well as an overall increase in subjective reporting of health
stable across such a time gap. symptoms and stress (e.g., Benham, 2006; Grimen & Diseth, 2016). In
order to gather a large enough sample to achieve statistical power that
2.9.3. Results would allow us to identify correlations with self-report measures, we
Only participants who correctly located the target stimulus on at attempted to contact all participants who completed bCFS tasks in our
least 90% of trials in the bCFS task (21 participants) were included in the lab during the 18 months prior to data collection. To reduce potential
analysis. NVPS was highly correlated between the two bCFS blocks, r = error variance due to differences between the bCFS tasks, we focused on
0.905, p < 0.001, BF10 > 1000, credible interval 0.74 to 0.96, indicating bCFS tasks in which faces or scrambled face images were used as stimuli.
that NVPS is stable over the 20 min time gap between the two bCFS These participants had been part of one of experiments 3, 4 or 6 from
blocks. Abir et al., 2018 or a follow up experiment using the same face stimuli.
There were significant main effects for alerting (Mean = 52.62 mil
liseconds, SD = 26.78, t20 = 9.0), orienting (Mean = 23.52 milliseconds, 2.10.3. Results
SD = 19.0, t20 = 5.67) and executive attention (Mean = 117.0 milli Of the 152 participants we attempted to contact, 92 (60.5%) were
seconds, SD = 36.24, t20 = 14.8). Orienting attention was not signifi reached and were willing to answer additional questions, 84 of whom
cantly correlated with either alerting (r = 0.13, p = 0.57) or executive had correctly located the target stimulus on at least 90% of trials in the
attention (r = 0.26, p = 0.26). Alerting and executive attention were bCFS task and were included in the analysis.
significantly (r = 0.52, p = 0.016). As expected, there was a significant correlation between NVPS and
Crucially, NVPS was not significantly correlated with any of the self-reported sensitivity, r = − 0.27, p = 0.014, BF10 = 2.69, credible
attentional functions, r = 0.105, p = 0.65, BF10 = 0.297, credible in interval − 0.45 to − 0.055. This result holds even if we exclude one NVPS
terval − 0.32 to 0.48; r = − 0.012, p = 0.96, BF10 = 0.27, credible in item that may be measuring visual perception rather directly (“I seem to
terval − 0.41 to 0.39 and r = − 0.134, p = 0.56, BF10 = 0.32, credible
interval − 0.50 to 0.27 for alerting, orienting and executive attention,
respectively. 4
Several measures relevant for other projects were additionally gathered; see
NVPS was also not correlated with participants’ acuity averaged Expanded Methods.
7A.Y. Sklar et al. Cognition 211 (2021) 104638
be aware of subtleties in my environment”; r = − 0.3, p = 0.006, BF10 = 3.2. Consciousness
5.86, credible interval − 0.48 to − 0.088).
These correlations establish that participants with short NVPS have Notably, much of the consciousness literature relies on masking
higher HSPS scores (see Fig. 3), suggesting that differences in NVPS may paradigms. Global Neuronal Workspace (e.g., Dehaene et al., 2006) and
lead to differences in how one consciously experiences the world. local ignition (e.g., Malach, 2007; Noy et al., 2015; Zeki, 2003) explicitly
rely on differences between masked and non-masked stimuli to infer the
3. General discussion neuronal mechanisms underlying consciousness, and the axioms of In
formation Integration Theory (Tononi & Koch, 2015) seem to take such
Our findings paint a picture of a highly robust cognitive character differences into account. Thus, regardless of whether our results mainly
istic. NVPS is general, ubiquitous and unique: It affects performance in reflect a systematic early bias, or a more balanced mix of low-level and
various tasks, for a large variety of stimuli, and it cannot be explained by high-level mechanisms, they may be highly informative and suggest new
cognitive characteristics such as general speed, perceptual threshold, possibilities for the science of consciousness.
short-term visual memory, or three different attentional networks. NVPS Specifically, general, ubiquitous and unique individual variability in
is also stable over short periods of time, and it correlates with HSPS, NVPS cannot be accounted for by existing frameworks for thinking
which measures self-reports of sensitivity of processing. about prioritization for awareness. Previous literature identified many
Before we discuss the broader implications of our findings, we turn to factors influencing prioritization of specific stimuli in specific paradigms
address potential limitations. (e.g., Abir et al., 2018; Balcetis et al., 2012; Sklar et al., 2012; Stein et al.,
2012; Zeelenberg et al., 2006). However, no existing view can explain
findings across factors and tasks. The current findings help in high
3.1. The nature of NVPS lighting the need for such a theoretical expansion and provide important
input.
The current examination of NVPS is limited to masking paradigms,
and may hence reflect a masking-specific characteristic. As we note in 3.3. Neural correlates of consciousness
the introduction, prioritization as we examine it here does not neces
sarily assume prioritizing processes that assign value to non-conscious Finally, robust individual variance, as we found here, offers a new
representations. Rather, it may be implemented in a systematic sen and powerful tool for examining the neural correlates of consciousness
sory, perceptual, or cognitive bias. It is therefore conceivable that the (NCC). The robustness of NVPS could be utilized in future research to
results we report here mainly (or solely) reflect duration-dependent link individual variability in NVPS with individual variability on the
biases in consciously perceiving meaningful visual objects in the face neural level (e.g., variability in the strength or speed of neural ignition
of visual masking. This, in turn, may help explain the lack of correlation response to stimuli or variability in connectivity between occipito-
with control experiments that do not include visual competition (Ex temporal cortex and association cortices; Dehaene et al., 2006; Mou
periments 4–7). tard, Dehaene, & Malach, 2015) or informational level (e.g., variability
The correlation between bCFS and bRMS (Experiment 3a) suggests in the speed of change in integrated information measures; Tononi,
that NVPS as it is measured here is not limited to binocular or temporal 2008). Such findings would offer a new independent source of evidence
masking. The correlation between two types of masks (Experiment 3b) for the ongoing effort to tie conscious experiences to neural processing.
suggests that NVPS is not limited to Mondrian masks. The moderate Indeed, a similar approach was instrumental to identifying the neural
correlation with the short version of the HSPS (and the version without underpinning of a related phenomenon - multistable perception
the potentially visual item; Experiment 8) suggests that NVPS is asso (Kleinschmidt et al., 2012).
ciated with more central aspects of sensitivity. This is but preliminary This new approach is particularly important for the search for NCC as
evidence that bears on the nature of prioritization. Mapping the more it avoids a major hurdle in the current literature – differentiating the
central vs. uniquely masking-related characteristics of NVPS as it is processes that generate conscious experience from those that result from
measured here is a challenge for future research (Harris, Sklar, & Hassin, it (Block, 2019; Dehaene et al., 2014). As we measured it here, indi
2020). The history of psychology teaches us that it is likely that both vidual variance in the process(es) generating conscious experiences (and
low- and high-level processes are at play. therefore its potential neural correlates) is unique, and does not corre
late with some of the usual suspects of post-awareness processing (e.g.,
conscious response speed, attentional capacity). The approach proposed
here may therefore offer an important tool to the NCC literature
(Dehaene et al., 2014), generating new results to arbitrate theoretical
disagreements.
3.4. General behavior
To close a circle to the first paragraph of this paper – NVPS may affect
many other processes and behaviors. Indeed, to the extent that it is not
limited to the masking paradigms used here – people with short NVPS
are likely notice more of their surroundings, with positive (e.g., less
accidents, better knowledge of one’s surrounding) and negative (e.g.,
less time for thinking, shallower processing) consequences. These
fascinating possibilities are left for future empirical examination.
Fig. 3. Results of Experiment 8. Correlation between Highly Sensitive Person
(HSP) scale scores and NVPS (in seconds). The line is linear least square best fit.
8A.Y. Sklar et al. Cognition 211 (2021) 104638
4. Expended methods 2015), cropped into ovals containing only the face and presented in
grayscale, 175 × 140 pixels in size. In Experiment 4 target stimuli were
4.1. Participants 20 images of faces and 20 images of houses cropped into squares of 100
× 100 pixels. In each task, 10 face images and 10 house images were
In all experiments, participants were Hebrew university students, 20, used so that images were not repeated between the two tasks. In
28, 30, 53,5 36,6 42, 63, 65, 27 and 92 in Experiments 1 through 8 Experiment 5 target stimuli were 52 three number subtraction arith
respectively,7 of these 15, 14, 18, 38, 26, 38, 47, 13 and 54 were female metic statements (e.g. 6–1-2 = 3), displayed in 16 pt. Ariel font. In
in Experiments 1 through 8 respectively. Participants’ Mean age was Experiment 6 target stimuli for the CFS task were 300 faces generated
23.3, 24.4, 25.6, 23.2 and 23.3 in Experiments 1 through 4 respectively, randomly on FaceGen 3.1 (Oosterhof & Todorov, 2008). In Experiment
23.0 in Experiment 6, 24.4 in Experiment 7 and 24.03 in Experiment 8. 7, target stimuli were 16 grayscale images of faces, cropped into 100
Due to errors no age data was collected in Experiments 3b 5. All par pixels × 100 pixels squares.
ticipants had normal vision and participated in the experiments in ex Mask stimuli were Mondrian patterns (grayscale in Experiment 1 and
change for course credit or 10 NIS in Experiment 1, 15 NIS in colored in Experiments 2a through 8, see Fig. 1) changing at 10 hz. (i.e.,
Experiments 2 through 5, 30 NIS in Experiments 6 and 8 and 35 NIS in each frame of the mask was presented for 100 milliseconds). Mask
Experiment 7 (1 NIS = approximately $0.25). In Experiment 8, partic stimuli size was 170 × 170 pixels in Experiment 1, 250 × 250 pixels in
ipants were compensated by being included in a lottery with a single 200 Experiments 2a, 2b, 4, 5 and 7, and 600 × 250 pixels in Experiments 3, 6
NIS (approximately $50). All participants provided informed consent and 8.
prior to participating.
4.4. Experiment 1 procedure
4.2. Apparatus
Participants completed 8 training trials, with faces displaying neutral
In Experiments 1–2b and 4–8 stimuli were presented on a 15-in. CRT expressions of identities not included in the experimental trials, fol
monitor (800 pixel by 600 pixel resolution in Experiment 1, 1024 pixel lowed by 192 experimental trials (16 repetitions of each expression by
by 768 pixel resolution in Experiments 4 through 8). In Experiments identity combination) presented in random order. In each trial, the
1–2b and 4–8 participants viewed the screen through a Screenscope target stimulus appeared randomly in one of the four corners of the
mirror stereoscope placed approximately 30 cm from the screen. In display area, fading in linearly up to 100% contrast over the first second
Experiments 3a and 3b, stimuli were presented on a Samsung Sync of presentation. The mask stimulus was presented at full contrast during
Master SA950 3D monitor. Participants viewed the screen through the first second of presentation and then linearly faded out over five
matching Samsung 3D glasses, using a chin rest positioned approxi seconds, or until a response was registered at which point the trial
mately 60 cm from the screen. Stimulus presentation was controlled by ended. Target stimuli and mask stimuli were each presented monocu
DirectRT Version 2012 in Experiment 1 and the psychophysics toolbox larly to different eyes in order to induce interocular suppression. Eye of
extension for MATLAB (Brainard, 1997) in Experiments 2a through 8. presentation was varied randomly between trials so that each eye was
presented with the target stimuli on 50% of trials. Participants were
4.3. Stimuli asked to respond by pressing one of four keys to indicate the corner of
the display area at which the target stimulus appeared. Participants
In Experiment 1 target stimuli were grayscale images of faces, were instructed to respond as soon as they noticed any part of the target
cropped into 80 × 80 pixels squares, displaying either a sad, a happy or a face. Upon response, the trial terminated and a blank screen was pre
neutral facial expression. Images were taken from the standard Ekman sented for 400 milliseconds followed by the next trial.
set of facial expressions (Ekman, Friesen, & Press, 1975). Four identities
(two male) were used, each was presented displaying all three emotional 4.5. Experiments 2a and 2b procedure
expressions. In Experiments 2a and 2b target stimuli were 46 two-words
expressions in Hebrew. Expressions varied on their affective valence as During each trial, a fixation cross was presented binocularly at the
rated by a separate group of participants. All expressions were composed center of each eye’s visual field. The expressions were presented
of affectively neutral words (see Experiments 4a & 4b in Sklar et al., monocularly in 15-pt Ariel font and gradually ramped up in contrast
2012). In experiment 3 and 6 target stimuli were a random subset of 30 (from 0% to 50%) during the first 900 milliseconds of presentation.
faces drawn from the 300 randomly generated faces stimulus set (Oos Target stimuli appeared either below or above fixation (probability =
terhof & Todorov, 2008). All face stimuli were 145 × 235 pixels in size. 0.5). Participants’ task was to indicate whether the sentences (or any
In Experiment 6, 25 additional faces were randomly generated for the part of them—a word, letter, or feature) appeared above or below fix
memory task. For additional information regarding the stimuli used in ation by pressing the appropriate key. They were instructed to respond
Experiment 6 see Experiments 1 and 2 (Abir et al., 2018). In Experiment as quickly as they could, trials ended after 10 s if no response was given.
3b, target stimuli were 24 face images drawn from NimStim (Tottenham Upon response, the trial terminated and a blank screen was presented for
et al., 2009) and the Chicago Face Database (Ma, Correll, & Wittenbrink, 800 milliseconds followed by the next trial. The mask was randomly
presented to one eye, and the expression was presented to the other eye
(probability = 0.5).
5
An additional 12 participants in Experiment 3 reported during debriefing
they had closed one of their eyes during the CFS presentation and are therefore 4.6. Experiment 3a procedure
excluded entirely from the sample.
6
An additional 14 participants in Experiment 3b either reported during Participants completed two experimental blocks: One with a bCFS
debriefing they had closed one of their eyes during the CFS presentation or task, and one with a bRMS task. Order of tasks was counterbalanced
experienced equipment failure leading to monocular instead of binocular pre
across participants. During trials in both tasks, a fixation cross was
sentation and are therefore excluded entirely from the sample.
7 presented binocularly at the center of each eye’s visual field, and a
To detect a correlation of r = 0.6 with reasonable (80%) power, the required
sample size is 18 (Hautus, 1995), we therefore set 20 as a conservative minimal double line framed the area in the visual field in which Mondrians would
sample size required for all further experiments based on the results of Exper be presented. In the bCFS task, face images were presented monocularly,
iments 1-2b. When it was possible given participant pool constraints, larger gradually ramping up in contrast (from 0% to one of six levels of
samples were obtained. See Experiment 8 procedure for a thorough description maximal contrast, logarithmically spaced between 30% and 90%) dur
of the sampling for Experiment 8. ing the first second of presentation. On each trial the mask was randomly
9A.Y. Sklar et al. Cognition 211 (2021) 104638
presented to one eye, and the face stimulus to the other (probability = presented for 800 milliseconds after a trial terminated.
0.5). In the bRMS task, both faces and Mondrians were presented
binocularly. Faces and Mondrians were presented in alternation, each 4.9. Experiment 5 procedure
face presentation lasting 33 ms and each Mondrian presentation lasting
67 ms. Each trial began with a Mondrian presentation. Faces were pre Participants completed two tasks. First, participants completed 104
sented at one of six contrast levels, logarithmically spaced between 30% trials (two presentations of each statement) of the CFS task. Next, par
and 90% contrast. In both tasks, face stimuli appeared either to the left ticipants completed 104 trials (two presentations of each statement) of
or the right of fixation (probability = 0.5). Participant’s task was to the control task. Before the CFS task, participants completed 8 training
indicate whether the faces appeared to the left or right of fixation by trials identical to trials used in the actual task. Due to the high similarity
pressing an appropriate key. They were instructed to respond as quickly between the CFS and control tasks, no training preceded the control task,
as they could. For both tasks, trials ended after 10 s if no response was which immediately followed the CFS task with no additional
given. Upon response, the trial terminated and a blank screen was pre instructions.
sented for one second followed by the next trial. For both tasks face In the CFS task, on each trial a statement linearly faded in over the
stimuli appeared either in their cardinal orientation or flipped by 180◦ first second of presentation up to 20% contrast. The mask stimulus was
(probability = 0.5). Overall, participants completed 360 trials for each presented at full contrast during the first seven seconds of presentation
of the tasks. Each task was preceded by a training block, 25 trials long. and then linearly faded out over three seconds. Target stimuli and mask
stimuli were each presented monocularly to different eyes in order to
4.7. Experiment 3b procedure induce interocular suppression. Eye of presentation was varied
randomly between trials so that there was a 50% likelihood each eye was
Participants completed 144 trials of the bCFS task, 72 trials with each presented with the target stimulus on any given trial. Trials terminated
masking type (Mondrian or grayscale numbers masks). During each as soon as a response was registered, or after a total of 10 s has elapsed.
trial, the target face stimulus linearly increased in contrast over the first Participants were asked to respond by pressing one of two keys to
second of presentation up to the maximal contrast (50% for Mondrian indicate whether the statement was presented in the upper or lower half
mask trials, 70% for the grayscale numbers mask). Mask stimuli covered of the display area. Participants were instructed to respond as soon as
a display area 400 × 300 pixels in size, with target stimuli appearing in they noticed any part of the statement.
either the left edge, centre or right edge of the display area, with each In the control task, presentation was changed so that both the masks
stimulus appearing in each position on one third of the trials. Mondrian and target statements were presented to both eyes simultaneously on
masks were identical to those used in Experiments 2 and 3. Grayscale each trial, with the target statement superimposed over the mask. In
number masks were composed or four overlapping layers of numbers order to induce reaction times that were similar to those of the CFS task,
with each layer including numbers at a different shade of grey and in target statements faded in linearly over three seconds. All other display
different size (see Fig. 1). Face stimuli appeared upright on half the trials parameters were identical between the two tasks and participants were
and inverted on half the trials. Participants were asked to report the acting under the same instructions as in the CFS task. A blank screen was
position of the target stimulus by pressing one of three keys as quickly as presented for one second after a trial terminated.
possible. Upon response, there was a one second intertrial interval. If no
response was given, trials terminated after 10 s. 4.10. Experiment 6 procedure
4.8. Experiment 4 procedure Participants completed two tasks. First, participants completed 34
trials of the memory task. Then participants completed two blocks, 300
Participants completed two tasks. First, participants completed 100 trials each, of the CFS task. The memory task was preceded by 4 practice
trials of the face/house identification task. Next, participants completed trials; the CFS task was preceded by 25 practice trials.
150 trials of the CFS task. Each task started with an additional 8 training In the memory task, 25 faces were presented binocularly for 4 s, with
trials with stimuli and display parameters that were the same as those an inter-trail interval of 1 s. Face stimuli faded in linearly up to 35%
used in the rest of the task. For each participant, one stimulus category contrast over the first second of presentation. Nine randomly selected
was designated as frequent and the other was designated as infrequent. faces appeared twice consecutively. Participants had to indicate by
Participants saw 8 repetitions of each of the 10 frequent category stimuli pressing one of two keys whether the face presented is different or
and 2 repetitions of each of the 10 infrequent category stimuli in the identical to the previous one. The color of the frame around the stimulus
identification task (100 trials in total). Participants saw 12 repetitions of was changed after key press to provide feedback (green for correct, red
each of the 10 frequent category stimuli and 3 repetitions of each of the for incorrect).
10 infrequent category stimuli in the CFS task (150 trials in total). In the CFS task, on each trial a face stimulus faded in linearly over the
In the identification task, on each trial an image (either a house or a first second of presentation up to 35% contrast. The mask stimulus was
face) appeared in one quadrant of the display area and participants were presented at full contrast during the first seven seconds of presentation
asked to identify the image as either a house or a face by pressing a and then linearly faded out over three seconds. Target stimuli and mask
corresponding key. stimuli were each presented monocularly to different eyes in order to
In the CFS task, on each trial an image, either a house or a face, induce interocular suppression. Eye of presentation was varied
linearly faded in over the first second of presentation up to 20% contrast. randomly between trials so that there was a 50% likelihood each eye was
The mask stimulus was presented at full contrast during the first seven presented with the target stimulus on any given trial. Trials terminated
seconds of presentation and then linearly faded out over three seconds. as soon as a response was registered, or after a total of 10 s has elapsed.
Target stimuli and mask stimuli were each presented monocularly to Participants were asked to respond by pressing one of two keys to
different eyes in order to induce interocular suppression. Eye of pre indicate whether the face was presented in the upper or lower half of the
sentation was varied randomly between trials so that there was a 50% display area. Participants were instructed to respond as soon as they
likelihood each eye was presented with the target stimulus on any given noticed any part of the face. A blank screen was presented for one second
trial. Trials terminated as soon as a response was registered, or after a after a trial terminated.
total of 10 s has elapsed. Participants were asked to respond by pressing
one of four keys to indicate the corner of the display area at which the 4.11. Experiment 7 procedure
target image appeared. Participants were instructed to respond as soon
as they noticed any part of the target image. A blank screen was Participants completed three tasks, the CFS task, the ANT and a
10You can also read