COGNIZANT 2ND QUARTER 2018 - Old Mutual Wealth
←
→
Page content transcription
If your browser does not render page correctly, please read the page content below

COGNIZANT                                        2ND QUARTER 2018

JAPAN: THE LAND OF THE RISING ECONOMY | CHINA: ASCENDING | INDIA: THE TIME FOR GROWTH IS NOW
                        | THE MIDDLE EAST: ECONOMIES FULL OF ENERGY
TABLE
                                    OF
                                 CONTENTS

    INTRODUCTION                                 3

    JAPAN: THE LAND OF THE RISING ECONOMY        5

    CHINA: ASCENDING                             9

    INDIA: THE TIME FOR GROWTH IS NOW           13

    THE MIDDLE EAST: ECONOMIES FULL OF ENERGY   17

2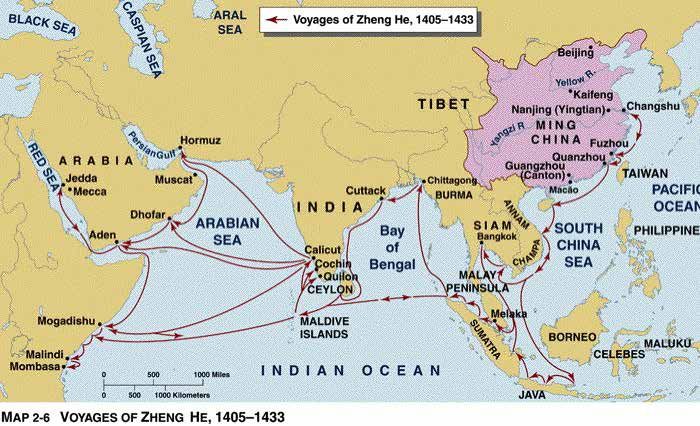
INTRODUCTION
                                               CHRIS POTGIETER – HEAD OF PRIVATE CLIENT SECURITIES

The theme of this edition and the next is      not see these technologies as threats         its trading and investment with countries
“Around the World in 180 Days”. We will        but as essential enablers. Labour force       other than the US. Initiatives such as the
cover most of the globe with brief insights    participation by women in Japan was           One Belt One Road (OBOR) initiative is
into the major economies and trends            negligible a decade ago and now               a case in point.
shaping our collective future. At Private      the percentage of women working in
Client Securities (PCS), we believe that       Japan exceeds that in the US. Corporate       From China we move on to India, the
wealth should be protected and grown           governance and gender diversity at            second most populous country in the
by diversification into global investment      companies are improving rapidly and           world. Its population is young, educated
opportunities. From the inception of PCS       encouraging a shift of domestic savings       and increasingly dynamic, connected
we made sure we had the capabilities to        from bonds to stocks.                         and tech-savvy. India’s growth had long
enable this in bespoke personal portfolios                                                   disappointed investors who argue that,
                                               We then move our attention to China.          based on its demographics, it should have
in an efficient and a cost-effective way.
                                               The most populous country on earth is         outpaced China as the fastest-growing
South Africa represents less than 1% of
                                               rapidly transforming from an export and       large economy. But decades of erratic
the world economy and of the global
population and while many companies            infrastructure investment-driven economy to   economic policy, complicated tax laws,
listed on our local exchange do offer          a domestic consumption-led economy, with      inefficient infrastructure and bureaucratic
opportunities to get global exposure,          its demographic dividend being replaced       red tape have stymied its growth. However,
these are limited. For an investor to obtain   by a consumption dividend coupled with        there are tangible signs that things are
rightful exposure to global growth and         rapid technological innovation. The country   improving. Several meaningful fiscal
diversification opportunities, one has to      has been able to produce a wide range of      reforms are already playing out in the
look beyond the Johannesburg Securities        products at compelling prices and become      economy and the effects are evident in
Exchange.                                      a leading exporter to the world. China’s      the stock market. Increasingly domestic
                                               growth was enabled by the technology          savings are being driven out of bank
This edition covers the major economies        of others. It copied these technologies       accounts and into listed equities. This may
in the East. We look at Japan and its          and applied them in new areas and on          have been overdone recently, but booms
nascent revival from what some called          a massive scale, but now it is coming         and busts are part of the growing pains
a zombie economy to an economy that            into its own in terms of creativity and       that can be expected.
is changing from being export-led to           home-grown innovation. With the Chinese
consumption-fed. Japan’s economy now           economy forecast to match that of the US      From the Far East we cross to the Middle
has such low unemployment that robotics        by 2030, it is reasonable to expect the       East – a fitting place to conclude this
and digitisation are necessary to keep up      investable market to grow significantly.      edition and to set the stage for the next.
with labour force demand. The Japanese,        Trade wars with the US may slow this,         The Middle East represents an ancient and
unlike some Western counterparts, do           but won’t prevent China from expanding        enduring link between East and West. It has

                                                                                                                                           3
always been a contested region due to its
    strategic geographic position in the world
    and, from the late 19th century, because
    it also represented a bountiful source of oil
    and gas to fuel the world’s energy demand
    as industrialisation and consumption
    accelerated. With the world changing
    its energy consumption habits towards
    more sustainable sources, the economies
    in this region have been reinventing
    themselves also. This is probably most
    obvious in Dubai and also the reason
    for the planned listing of state-owned
    oil company Saudi Aramco. Despite the
    change in the energy landscape, the
    new trade connections between East and
    West will put the Middle East in centre
    stage yet again.

    Could the current bout of tit-for-tat raising
    of trade barriers escalate into all-out trade
    wars and spoil the opportunities we
    highlight in this issue? It is possible, but not
    probable. The price of an all-out global
    trade war is arguably too high for any
    of the world’s largest economies to bear.
    Many would argue that the safest place to
    be in a trade war is in the countries with
    the strongest domestic economies that are
    largely self-sufficient. The United States is
    the leading economy in this regard, but as
    new and renewed economies rise in the
    East, it is no longer the only place to be.
    New trade connections and relations are
    being established and the scope and size
    of these new relations have the potential
    to far exceed what has gone before.

    “We think of globalisation as a uniquely
    modern phenomenon; yet 2 000 years
    ago too, it was a fact of life, one that
    presented opportunities, created problems
    and prompted technological advance.”
    Peter Frankopan, The Silk Roads: A New
    History of the World

4
JAPAN: THE LAND OF THE RISING ECONOMY

                   JAPAN: THE LAND OF
                   THE RISING ECONOMY
                                   ANDREW DITTBERNER – CHIEF INVESTMENT OFFICER

Japan and economic prosperity are two words that have not often been mentioned in the same sentence for the better part of nearly
three decades. The post-World War II economic miracle of Japan that came to a crushing halt in the late 1980s and early 1990s,
resulted in a prolonged period of economic malaise that became known as the Lost Decade. A lack of economic recovery through
2001 to 2010 resulted in the whole period becoming known as the Lost Score or the Lost 20 Years. Unsurprisingly, the Japanese
stock market suffered significant real losses during this period, as shown in graph 1.

                                                                                                                                    5
JAPAN: THE LAND OF THE RISING ECONOMY
GRAPH 1: THE NIKKEI 225 INDEX (DEC 1950 – MAY 2018) is that a normalisation of the Japanese
45 000
market has taken place and continues
40 000
to do so. Historically, the equity market
The Lost 20 Years
35 000 was very much driven by the yen/US
30 000 dollar exchange rate, given the Japanese
Nikkei Price Index
25 000 economy’s reliance on exported goods
20 000 such as motor vehicles (Toyota, Honda,
15 000 Nissan, Mazda, etc.) and electronic
10 000 goods (Sony, Canon, Fujifilm, Nintendo),
5 000 among others. This resulted in Japanese
0 companies producing very erratic earnings
1950
1953
1956
1959
1962
1965
1968
1971
1974
1977
1980
1983
1985
1988
1991
1994
1997
2000
2003
2006
2009
2012
2015
2018
growth profiles, in turn leading the market
to closely correlate with the exchange rate
rather than the underlying profitability of
With the Japanese economic miracle on this later. The profitability of listed
the companies that constituted the market.
parked in our very distant memory, companies, as measured by return on
This relationship began to break down in
and the oxymoron that is Japan and equity, has nearly doubled from mid-single
the lead-up to the global financial crisis
economic prosperity, today Japan is not digits to 9.2%. And most surprisingly, in
of 2008. This is highlighted in graph 2.
often considered an attractive investment local currency terms, the stock market’s
destination. The rise of China and the new Nikkei 225 Index has outperformed the Decomposing Japanese GDP numbers
technology age are viewed as far more other major stock indices of the US and into net exports and domestic demand,
exciting investment destinations. Yet, as Europe with a cumulative total return since 2010 domestic demand has been
all good things come to an end, so do of 135% to the end of May 2018. In a far larger contributor to total GDP than
periods of poor performance. US dollar terms, the Japanese market has exports and also far less volatile than
slightly underperformed the US market, exports. This theme is playing itself out in
Japan’s lacklustre economic performance
but remains materially ahead of the the equity market and is evident through
of recent decades aside, it remains the
European market. listed companies’ profitability becoming
third-largest economy, behind the United far less volatile, while at the same time
States and China, and constitutes the It is fascinating to dig a little deeper into increasing the overall level of profitability
second-largest weight in the global equity the Japanese equity market and get a as alluded to above. Graph 3 shows that
market, from a geographical point of better understanding of how the underlying over the past 10 years, the local stock
view. Given the sheer size of Japan, and market drivers have evolved in recent market has been driven more by earnings
their global economic significance, it is years. What becomes instantly obvious than the exchange rate.
imperative that Japan receives more than
just a passing glance. GRAPH 2: C
ORRELATION BETWEEN THE NIKKEI AND THE YEN/US DOLLAR
EXCHANGE RATE
If one were to take a bird’s eye view of
25 000 70
how Japan has progressed over the past
80
five years, it would be very difficult to 20 000
90
say that it remains in its economic slump
Yen/USD Exchange Rate
Nikkei 225 Price Index
100
of the 1990s and 2000s. Since the end 15 000
110
of 2012, economic growth as measured
10 000
120
by nominal gross domestic product, has
130
expanded by a cumulative 11.3%. The 5 000
140
unemployment rate has also improved Nikkei 225 (LHS) Yen/USD (RHS)
0 150
materially from 4.3% to 2.5%, but more
1992
1994
1996
1997
1999
2001
2003
2005
2007
2008
2010
2012
2014
2016
2018
6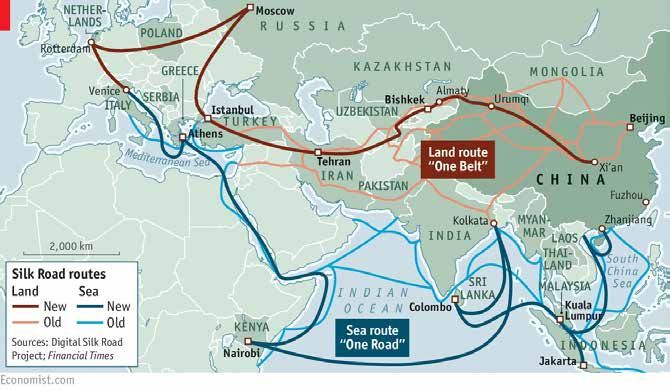
GRAPH 3: T HE NIKKEI PRICE INDEX AND THE UNDERLYING EARNINGS LEVEL                                                      and efficient corporate sector and the
         (MAY 2008 – MAY 2018)                                                                                           need to address the lack of corporate
                         200                                                                                             governance was identified as a key
                                  Nikkei 225 Earnings Base
                                                                                                                         area of concern. Second, labour market
                                  Nikkei 225 Price Index
                         150                                                                                             reform was required to reduce the level of
Index (May 2008 = 100)

                                                                                                                         unemployment and to attract women back
                         100
                                                                                                                         into the workforce. And last, addressing tax
                                                                                                                         collection issues that were putting further
                          50
                                                                                                                         pressure on an already strained fiscus.

                           0
                                                                                                                         Japan has more listed companies than
                                                                                                                         the US and therefore, given the size
                         -50
                           2008    2009       2010         2011   2012   2013   2014    2015    2016     2017     2018   of the sector, it is vitally important that
                                                                                                                         corporate governance should be up
The recent five years has seen earnings                                    Japan has been anything but stable with       to date. The rights of minority investors
per share at market level growing 162%.                                    10 different prime ministers since the turn   need to be protected, while also ensuring
This is slightly ahead of the market’s 135%                                of the century. This includes two terms by    the independence of boards to reduce
total return over the same period, resulting                               incumbent Shinzo Abe, who first came to       the likelihood of corporate troubles.
in a more attractively priced Japanese                                     power in 2006, before returning again in      Interestingly, Pakistan had a corporate
equity market (based on a price to                                         2012. The next elections are due to be        governance code in place before
earnings ratio) than at the end of 2012,                                   held in September, and while the feeling      Japan did. Thankfully, Japan has now
despite the fantastic returns generated                                    on the ground (at the time of writing) is     addressed this issue and evidence shows
                                                                           that Shinzo Abe will scrape through, he       that corporate governance within Japan
for investors. The US and European
                                                                           is currently facing a number of allegations   has materially improved and is continuing
stock markets stand in stark contrast to
                                                                           that are making the political landscape       on this trend.
the Japanese market, given that over the
                                                                           less certain than in recent history.
past five years, returns generated have                                                                                  Labour market reforms increased female
exceeded underlying earnings growth.                                       Shinzo Abe has also played a significant      participation in the workforce, to the
The net result is that both the US and the                                 role in turning the Japanese economy          point where there are now more females
European markets are more expensive                                        around with the onset of what has become      working in Japan as a percentage of the
today than they were at the end of 2012.                                   affectionately known as abenomics. In         total workforce than in the US. On a similar
                                                                           short, abenomics was a three-pronged          note, a record number of older people
Japan has struggled to wash itself of its old
                                                                           approach which entailed a set of              now also form part of the workforce. This
stigma, and as such international investors                                                                              is in conjunction with the introduction of
                                                                           aggressive monetary and fiscal policies
continue to refuse to pay a premium to                                                                                   minimum wages and a cap on overtime.
                                                                           with the aim of revitalising the economy.
invest in Japanese companies. This is                                                                                    Currently, the job offer to applicant ratio
                                                                           Four years down the line, it appears that
evidenced by the fact that roughly 40%                                                                                   sits at 1.6x, indicating that there are 60%
                                                                           these policies have enjoyed an element of
of listed Japanese companies trade at                                                                                    more job offers than applicants. 97%
                                                                           success, as the economy has managed to
less than their book value. Against the                                    move out of the deflationary environment,     of high school graduates are securing
above background, coupled with the                                         while posting a number of consecutive         jobs. The net result is that overall nominal
fact that consensus remains that earnings                                  years of positive economic growth.            employee income growth is rising at 3.3%.
growth will continue through 2018 and                                                                                    This all points to a labour market that is
2019, investors’ unwillingness to re-rate                                  Completing the third prong of abenomics,      very tight. Since household consumption
the market appears puzzling.                                               was a number of structural reforms that       makes up 55% of Japanese GDP, it augurs
                                                                           were put in place to improve the overall      well for the foreseeable future.
A well-functioning equity market is very                                   global competitiveness of the economy.
much reliant on a stable economic and                                      Three of these structural reforms are         One of the unintended consequences
political landscape. On the political front,                               highlighted here. First, a more competitive   of some of the labour market reforms,

                                                                                                                                                                        7
the cap on the amount of overtime per       collection. As it stands, the tax base is     well. Abenomics, which includes a number
    week in particular, is that companies now   far too narrow and should be a much           of structural reforms under the watchful eye
    have to find a way to boost productivity    larger source of revenue. With marginal       of Prime Minister Shinzo Abe, continues
    to maintain the current level of output.    income tax rates in the region of 55%, the    to support and grow the economy on
    The obvious answer to this is to turn       problem does not lie in too low tax rates     a sustainable basis. Coupled with the
    to technology. Unlike the majority of       but rather in the fact that not everyone      normalisation of the equity market, which
    the world, Japan embraces robotics,         pays. A taxpayer identification system        is supported by growing profitability
    automation and artificial intelligence.     was only put in place two years ago,          on the back of improving domestic
                                                which is almost unbelievable. Alongside
    Given Japan’s highly indebted balance                                                     demand and much-improved corporate
                                                this, 70% of Japanese companies pay no
    sheet, it is imperative that the country                                                  governance, Japan is fast becoming an
                                                income tax. These problems are currently
    takes the necessary action to address                                                     attractive investment destination. Making
                                                being addressed.
    the problem, irrespective of whether the                                                  it even more appealing to the discerning
    debt is held by locals or not. One way      In conclusion, while flying under the radar   investor is the fact that the equity market
    identified to make inroads in this regard   for the past few years, the Japanese          remains relatively undemanding from a
    was to address problems around tax          economy has been performing exceedingly       valuation perspective.

8
CHINA: ASCENDING

                      CHINA: ASCENDING
                                 CHRIS POTGIETER – HEAD OF PRIVATE CLIENT SECURITIES

During my recent visit to Shanghai I made sure that I purchased, for posterity, a bottle of Kweichow Moutai at a local liquor
merchant. Moutai is a brand of baijiu – meaning “clear alcohol” – and is a prized and popular alcoholic beverage in China. In
fact, baijiu is by some measures the most consumed liquor in the world. This makes sense given that one in five people alive today
are Chinese! The company which owns this prized brand is partly state-owned, but the shares in Kweichow Moutai are listed on
the Shanghai stock exchange (as so-called “A-shares”, as opposed to Hong Kong-listed “H-shares”). With the gradual inclusion of
Chinese A-shares in the MSCI World Index starting June 2018, Kweichow Moutai will become a feature of many global portfolios.
The company has a market capitalisation of nearly CNY950 billion, or USD150 billion, which places it between the UK-listed
Diageo and Brussels-listed Anheuser-Busch InBev.

                                                                                                                                     9
CHINA: ASCENDING

                                                                                                 a reinvention of its imperialistic past.
                                                                                                 Yet, the Chinese dream of a return to
                                                                                                 greatness is real. In many important ways
                                                                                                 the dream is already matched by reality.

                                                                                                 China is rapidly transforming from an
                                                                                                 export and infrastructure investment-driven
                                                                                                 economy to a domestic consumption-led
                                                                                                 economy. Much has been written about
                                                                                                 its ageing population – the adverse
                                                                                                 impact of the one child policy which
                                                                                                 was introduced back in the 1970s and
                                                                                                 only relaxed in 2013. However, its
                                                                                                 demographic dividend is being replaced
                                                                                                 by a consumption dividend. China will
                                                                                                 probably “grow rich before it grows
                                                                                                 old”. Personal consumption expenditure
     Moutai, or Maotai, is named after            become the world’s manufacturing hub
                                                                                                 is still well below Western levels. Indeed,
     the town with the same name in the           and today it has risen to become the
                                                                                                 it is well below some of its Near-Eastern
     Guizhou Province, a mountainous province     second largest economy in the world and
                                                                                                 neighbours. The services sectors will benefit
     in Southwest China with a very long          is projected to overtake the US as the
                                                                                                 most with financial services, technology,
     history of distilling liquor. In fact, the   world’s largest economy by 2030.
                                                                                                 entertainment, healthcare and education
     Moutai of today originated during the
                                                  Today, with China’s rapid ascendancy           some of the top growth areas. Chinese
     Qing dynasty (1644 to 1912), which
                                                                                                 consumers are spending more on lifestyle
     followed the Ming dynasty and was            in areas of geopolitical power, trade
                                                                                                 services and experiences while also
     the last of the Chinese dynasties before     and commerce, one cannot but wonder
                                                                                                 moving from mass to premium segments.
     the creation of the Republic of China.       whether this is Qing Dynasty Version
     The Qing was a multi-cultural empire which   2.0 in the making. From the expansion          In Shanghai, as in all the major cities, the
     lasted almost three centuries and formed     of trade influence beyond its borders,         influence and pervasiveness of Western
     the territorial base of modern China.        as evidenced by initiatives such as the One    brands are very apparent. Everything
     It was the fourth-largest empire in world                                                   “Disney” is loved by young and old
                                                  Belt, One Road (“OBOR”) to President
     history. The Qing, like its predecessors,                                                   alike. The Disney Park in Shanghai is
                                                  Xi Jinping’s centralisation of power, it all
                                                                                                 typically fully booked days in advance,
     expanded trade and commerce well             brings home many comparisons to what
                                                                                                 while the brand’s influence is felt even
     beyond the borders of China, into the        was last seen during the Qing dynasty.         at the top end of the market with co-
     far reaches of the South China Sea and
                                                  Yet, the world is a very different place       branded Disney products being sold in
     beyond. The dynasty was vast in its
                                                  and the new dynamism and assertiveness         high-end malls by luxury brands, such
     reach and influence and its development
                                                  of China cannot be oversimplified as           as Coach. Starbucks presents another
     and expansion was set to continue.
     Yet, the expansion of European states
     into overseas territories and their rapid
                                                        DID YOU KNOW THAT PAPER CURRENCY WAS FIRST USED BY THE
     industrialisation, coupled with the Opium
                                                       CHINESE, WHO STARTED CARRYING FOLDING MONEY DURING THE
     wars of the 1840s, conspired against
                                                         TANG DYNASTY (A.D. 618 TO 907) — MOSTLY IN THE FORM OF
     advancement of the Qing dynasty.
                                                     PRIVATELY ISSUED BILLS OF CREDIT OR EXCHANGE NOTES? IT WAS USED
     China was the world’s largest economy
                                                            FOR MORE THAN 500 YEARS BEFORE THE PRACTICE BEGAN
     in 1820 but it declined steadily in the                      TO CATCH ON IN EUROPE IN THE 17TH CENTURY.
     150 years thereafter. Then it rose to

10
example of a “magical” place where on the design of their high-end phones, companies such as Tencent and Alibaba is
Chinese consumers find escapement Apple still commands a premium in the evident. From Hong Kong to Beijing and
and fulfilment. Top sports apparel brands Chinese consumer’s mind. It may be the everywhere in between, taxi drivers use
such as Nike, Puma and Adidas are power of Western idealism, or idolism? an app via Tencent’s platform, WeChat,
competing head-on for top spot in the But things are changing as the Chinese to navigate and keep records. Purchases
Chinese consumer’s mind. Even though become more self-aware of their status are made and paid with WeChat Pay
domestic competition is tough with the likes and achievements on the world stage. and Alipay. News, information and
of Huawei now partnering with Porsche entertainment are all accessed through
Technology is playing an ever-increasing
these platforms. Mobile gaming has
role in the services sectors. China may still
become a major source of revenue
DID YOU KNOW THAT THE lag the US in some areas of technology
for Tencent, never mind the fact that it is
MING “TREASURE” VOYAGES, research and development but it leads the default communications tool for just
COMMANDED BY ZHENGE the way in applying cutting-edge about everyone. Businesses connect
HE, INCLUDED SEVEN technology. It is a hotbed of technology with one another and with consumers
FAR-REACHING OCEAN innovation. In little more than a decade, through Alibaba and procurement and
VOYAGES BETWEEN 1405
China has come from almost nowhere payments are seamless and well governed.
AND 1433 TO THE COASTAL
to become the largest e-commerce market These platforms are pervasive and used
TERRITORIES AND ISLANDS IN
in the world, accounting for more than for everything, from conducting business
AND AROUND THE SOUTH
40% of global e-commerce transactions. to living everyday life. The billion+
CHINA SEA, THE INDIAN
China’s mobile payments are 11 times eyeballs connected to these platforms
OCEAN, AND BEYOND? THIS
the value of those in the United States attract online advertising and promotions
EXPANDED CHINESE TRADE
thanks to consumers’ early embrace of and it still seems to be early days. Every
RELATIONS FAR BEYOND THE
the technology. The extraordinary impact provider of services or products to the
LAND-BASED “SILK ROADS”.
of the technology platforms owned by Chinese consumer needs to be on these
11platforms. Revenues will continue to grow, these platforms. It has changed people’s the north and its rich and prosperous
the companies will continue to invest lives and connected the world in a very rice-growing areas in the south. China
in their technology, net income will go real way. This has been mostly positive has always been about commercialism
through cycles, but the trend is upwards. for society. These tenets are important to and trade. This has meant creating
Alibaba founder Jack Ma and Tencent ensure sustainability and avoid the pitfalls connections – within itself and with the
founder Pony Ma remain heavily invested of anti-competiveness, non-compliance or outside world. It is also about competition
in the fortunes of these companies – in social self-sabotage as seen elsewhere. of the highest order. With the Chinese
personal wealth and in time and energy. economy forecast to match that of the
The stakes are high. Their approach to While sitting in the departure terminal at
US by 2030, it is reasonable to expect
government regulations is pragmatic and Shanghai Pudong International Airport,
the investable market to grow significantly.
collaborative, as it has to be. They promote I watched with some amazement as the
aircraft constantly took off and landed in One can expect more capital liberalisation
an open architecture approach so that
the foreground while cargo ships moved as the economy opens up. Trade wars
consumers decide, for most part, which
up and down the mouth of the 6 300km- with the US may slow this, but it will not
services or suppliers reach “page one” on
long Yangtze river in the background. prevent China expanding its trading and
My mind then crossed to the Grand investment with countries other than the
CHINA’S “ONE BELT, ONE Canal, not far from Shanghai. The Grand US. The Western developed world runs
ROAD” INITIATIVE COVERS Canal winds its way from Beijing in the the risk of falling far behind this rapidly
65% OF THE WORLD’S north to Hangzhou in the south and is at rising superpower in the East. Investors
POPULATION, 75% OF GLOBAL nearly 1 800km the longest and one of should no longer view China as an
ENERGY RESOURCES AND the oldest man-made waterways in the emerging market – it has “emerged”
40% OF GLOBAL GDP. world. The canal was a major conduit and is well on its way to, again, lead
for commodities between its capital in the developed world.
12INDIA: THE TIME FOR GROWTH IS NOW
INDIA: THE TIME FOR
GROWTH IS NOW
SAMEER SINGH – RESEARCH ANALYST
India has long been seen as the de facto leader-in-waiting among the ambush of Asian Tigers hungering to take over the global
economy. Through the rise of Asia during the 1990s, the commodity boom of the 2000s and the recovery post the 2008
global financial crisis, India’s decades of consistent upper-single-digit GDP growth remained behind that of its larger neighbour
to the East, and arguably, has left the expectations of many unsatisfied. As the oft quoted Chinese saying goes, “May he live
in interesting times”, most would agree that the present is the most interesting of times, and it is not only this current period of flux
and uncertainty, but also technological progress and marvel that present India with a stronger platform and greater opportunity
for growth than at any other time in the memorable past. In fact, not only do those in the know now assert that India will become
one of the three largest economies in the world by 20251, but also that India's growth rate should consistently surpass that of
China for at least the next decade2.
13INDIA: THE TIME FOR GROWTH IS NOW
HOW DID INDIA FIND ITSELF IN obligations3. After pledging 67 tons known as the “Liberalisation of India”.
THIS ENVIABLE POSITION? of the country’s gold reserves against The slew of reforms which followed
Well, it is not all demographics. India’s a US$2.2 billion emergency loan from the were a veritable overhaul of the way
path to the doorstep of world-leading International Monetary Fund, India, both India does business, both internally and
growth began from a position of ruin as as a government and a nation, awoke externally, including the devaluation
the country dealt with the after-effects of to the stark reality that open markets of the rupee; industrial deregulation;
the Balance of Payments Crisis in 1991. attracting foreign direct investment and
and structural reforms were needed to
Having managed both a trade and other capital flows; trade liberalisation;
get the economy back on track.
fiscal deficit for more than five years, the tax reforms and rationalisation of the
tipping point was reached when India’s A few months after the collapse, with taxation structure; reduction in financial
foreign exchange reserves could barely a new prime minister and finance repression; and continued modernisation
cover three weeks' worth of imports. minister (Manmohan Singh, later prime of monetary policy, including reducing
At the same time the government came minister over the 2000s) in charge, fiscal dominance4. Key industries that
close to defaulting on its financial benefited from liberalisation were largely
the government instituted what became
services related (leading to the strong
INDIA VS. CHINA GDP growth in business process outsourcing)
16 and included insurance, banking, and
China India
14 telecommunications. Previously, all of
12 these were subject to heavy government
intervention, if not outright control.
10
8 The results of these reforms are perhaps
6 most evident when looking at the ramp-up
in India’s trade share of GDP, from the
4
early 1990s to the global financial crisis.
2
Monetary and fiscal prudence, together
0
with open and greater participation
1980
1981
1982
1983
1984
1985
1986
1987
1988
1989
1990
1991
1992
1993
1994
1995
1996
1997
1998
1999
2000
2001
2002
2003
2004
2005
2006
2007
2008
2009
2010
2011
2012
2013
2014
2015
2016
2017
2018
2019
2020
2021
2022
2023
in the world economy, brought with
1
https://edition.cnn.com/2015/05/12/opinions/china-india-haiyan-wang/
2
https://www.forbes.com/sites/salvatorebabones/2018/01/02/india-will-outgrow-china-in-2018-but-must-invest-in-next-generation-value-chains/#30c88b744d87
3
https://en.wikipedia.org/wiki/1991_Indian_economic_crisis
4
India Development Update, World Bank, March 2018
5
https://www.yahoo.com/news/India-economy-stands-today-yahoofinancein-3798138905.html
6
https://en.wikipedia.org/wiki/Literacy_in_India#Post-Independence
14it crucial knowledge and technology barring two years of 4-5% GDP growth, Pradesh (largest agricultural producer in
transfers which, along with increased growing industrial output and increasing India) leading to the country’s net exports
capital and labour productivity, investment were the key priorities. In of agricultural products growing from
contributed to India’s economic expansion addition to targeting an annual growth US$5 billion in 2004 to US$39 billion
into the 2000s. rate of 8% from 2003 onwards, the in 2013.
government also set five-year goals
But it was not all plain sailing and avid AND THEN, A BLACK SWAN
for human and social development,
market watchers would be mindful The fallout from the global financial
which included reducing the poverty
to point out the 1997 Asian financial crisis had far-reaching ramifications for
rate by 5% by 2007 and increasing
all countries and India was not spared.
crisis. Fortunately for India, the Asian the literacy rate to 75% by March
In spite of limited ownership/exposure
financial crisis had a limited impact on 20075. It was also during this period
to sub-prime mortgage instruments
the economy with GDP growth shifting that the government set up an incentive
and the minimal presence of stressed
from 7.6% in 1996 to 4% in 1997 fund to encourage states to implement
international financial institutions in the
and back up to 6.2% in 1998. Owing fiscal reforms that could be monitored.
Indian banking sector, the economy
to much of the reforms taken since 1991, These reforms included improvement
was primarily affected by negative
India maintained a lower current account in the quality of life through provision
investment flows as foreign investors
deficit, had a lower reliance on foreign of basic public services; clustering
withdrew offshore cash to steady their
funding of the fiscus and greater control of of high-tech industries and services;
local balance sheets. Additionally, owing
capital flows allowing it to fare relatively setting up Special Economic and Agri-
to deteriorating investor sentiment, many
better than its Asian neighbours. Economic Zones to promote exports; and
Asian export-led economies suffered
formulating state-level industrial policies
current account imbalances as the
THE NEED FOR HUMAN AND to attract investments. Many of these
appetite for global trade diminished.
SOCIAL DEVELOPMENT policies and reforms can be credited
For India, a lower dependence on
The start of the 2000s for much of the for the specialised growth experienced
exports and large contribution to GDP
world was marked by the implosion of in states such as Bangalore (also known
from domestic sources helped lessen
the dot-com bubble. However, for India, as the Silicon Valley of India), and Uttar
the effects. However, growth did take
a knock. The following four years from
FACT: OVER 1991-2011 IS THE FIRST PERIOD DURING WHICH THE 2010 to 2014 saw India decelerate
ABSOLUTE NUMBER OF THOSE WHO COULD NOT READ DECLINED, from strong GDP growth of ~10% to
INDICATING THAT THE LITERACY RATE WAS OUTSTRIPPING THE ~6% as a multitude of factors took hold
POPULATION GROWTH RATE.6 on the economy. Not only was it the
strong aversion to emerging markets that
SHARE OF EXPORTS AND IMPORTS IN GDP HAS INCREASED worked against India, but the weakness
AS THE ECONOMY PROGRESSIVELY OPENED UP in global trade, high oil prices (India
35.00 is a net importer of crude oil) and an
30.00 enlarged fiscal deficit following the crisis
Exports (% of GDP) Imports (% of GDP) also played a significant role.
25.00
20.00 CHAK DE INDIA! (GO INDIA!)
Within two years, India had a new
15.00
prime minister in Narendra Modi, whose
10.00
appointment in 2014 marked a noticeable
5.00 shift in policy from the previous regime of
0.00
Manmohan Singh. Modi was appointed
with high expectations, having achieved
1980
1982
1984
1986
1988
1990
1992
1994
1996
1998
2000
2002
2004
2006
2008
2010
2012
2014
2016
an overwhelming majority off the success
15of turning around the state of Gujarat’s Considering the majority of India’s and more transparent, which encourages
manufacturing base as well as promising population, around 62% are in the registration and adherence. Medium-term
a pro-socialist stance, inclusive of working age group of 15-59 years, expectations are for higher tax revenues,
substantial reforms. Much like past nearly 54% of the total population are higher exports and increased foreign direct
reforms, India continued to focus on below 25 years old and by 2020 the
opening up the economy and improving investment, all while increasing the ease
average Indian will be 29 years old.
the ease of doing business, for both locals of doing business 7. Over a sustained
Sustained improvements in digital literacy
and foreigners. However, differing from period, these are the key ingredients for
and inclusion will be a game-changer for
the past, embedding technology and high growth.
“digitising” the economy were integral the country that could super-charge the
to reform implementation. Besides well-documented demographic dividend. Pragmatically, the growth picture
the passage of reforms for improving is not all blooming lotuses. There have
GROWTH FROM WITHIN:
insolvency procedures (providing relief
UNBRIDLED TRADE been and will be teething issues. After
to India’s distressed credit markets) and
Growth over the coming years will also all, this is India, the world’s largest
liberalising foreign direct investment, two
of the most significant actions were the come from the introduction of GST, which democracy, second largest by population
launch of Digital India and the passing (much like South African VAT) will be levied (1.35 billion), seventh largest (for now)
of the Goods and Services Tax (“GST”). across all stages from manufacture to by GDP and land mass, and easily one of
Arguably, it is the scope of these two final consumption. This is significant as it the most diverse countries on the planet.
reforms that gives them the power to replaces up to 13 direct and indirect taxes
The country recognises 22 official spoken
transform the Indian economy by closing that often overlapped and existed across
languages, 6+ religious faiths and a mix
the digital divide and unlocking growth both federal and state administration.
in trade between states. of racial and ethnic groups; growth here
Beyond simplifying the status quo, the move
comes in starts and stops, spurts and
GROWTH FROM WITHIN: to a single GST widens the net for inclusion
of unregulated and unorganised industries stutters and with compromise. However,
A CONNECTED FUTURE
Digital India aims to overhaul the dated and improves the efficiency of logistics by as history would suggest, the path is
eGovernance project and is unashamedly limiting cross-state taxes and restrictions. undeniably upward and will continue to
ambitious, targeting nine key pillars: Furthermore, the whole process is online be so for the foreseeable future.
PILLAR DESCRIPTION
Broadband Highway Fibre-optic network covering 250 000 village councils; virtual network operators and smart
buildings in cities
Universal Access to Growing network penetration and coverage across the country
Mobile Connectivity
Public Internet Access National Rural Internet Mission – converting 1.5 million post offices to multi-service centres
Programme for service delivery
eGovernance Using IT to improve government transactions, workflow and databases
eKranti Electronic service delivery – using IT to improve service delivery, e.g. free wi-fi in schools,
digital literacy program and provision of Massive Open Online Courses
Information for All Massive open platform for citizens to communicate with government and vice versa
Electronics Through the development of incubators, specialised clusters and support from government
Manufacturing procurement
IT for Jobs ICT-enabled growth in smaller towns and villages – train 10 million people in towns/villages
in five years; support rural IT services businesses
Early Harvest Programs Quick-wins that cover standardisation of government communications, public wi-fi spots in
major metros, school books to become ebooks etc.
7
https://cleartax.in/s/impact-of-gst-on-indian-economy
16THE MIDDLE EAST: ECONOMIES FULL OF ENERGY
THE MIDDLE EAST:
ECONOMIES FULL OF ENERGY
MOOSA HASSIM – INVESTMENT ANALYST
The Middle East has always been a geographic region of great importance throughout human history. It is credited with being
the cradle of civilisation as its region of dry grasslands and fertile river plains made it the natural home to the first agriculture. Its
highlands were the natural habitat of wild grasses, such as wheat and barley, and it is from here that the first agriculture, based
on these crops, started around 10 000 years ago. Farming spread through the Middle East by around 6000 B.C. and from there
gradually spread westward into Europe and east to India and South Asia1.
17THE MIDDLE EAST: ECONOMIES FULL OF ENERGY
Beyond farming, the Middle East The adoption of the Paris Agreement What this analysis abundantly highlights is
contributed much to the development of marked a major step forward in global that the majority of Middle East economies
the civilised world. It was here where the efforts to address global warming. For the are heavily reliant on oil production and its
first codes of law were defined, where first time in history, both developed and related industries for both economic growth
the first writing systems were invented, developing nations committed themselves and socio-political stability. Unsurprisingly,
where engineering feats such as the wheel to pursue policies that would lower the reliance on a commodity that the
and the first surgical tools like the scalpel, their carbon footprint. This ensures that world is attempting to phase out presents
bone saws and forceps were crafted, these countries place larger emphasis on numerous issues for the future of the
where sciences such as astronomy and initiatives that would reduce their usage of region. These economies will come under
mathematics were first developed and hydrocarbon fuels as a source of energy. immense pressure as the global demand
studied, and it is even credited with for oil decreases. This is exacerbated by
Meanwhile, technological advancement
popularising the brewing of coffee, the fact that they subsidise energy in their
has improved the cost-competitiveness of
allowing you to get your morning fix2. home countries, providing it at prices that
low-carbon technologies such as wind and
solar energy generation, power storage are a fraction of the international market
More recently, the Middle East is known
technologies and electric vehicles. The value. In this process, the region incurs
for being the global energy storehouse,
global energy outlook sees the trend of massive losses, bloated and inefficient
with around half the world’s known oil
low-carbon technologies reshaping the public sectors and very high levels of
and gas reserves found in the region.
global energy generation mix. These two youth unemployment.
It is this fact that ensures the region will
continue to play a major role in global forces will ensure that the global reliance
SO WHAT ABOUT MIDDLE EAST
affairs, whether economic or political for on hydrocarbon fuels wanes and at some
STOCK MARKETS?
the foreseeable future. However, the rich point in the future we should reach a peak
With the geopolitical tensions and constant
deposits of “black gold” doesn’t come in global oil demand.
threat of war and proxy wars, why would
cheaply. There is a constant backdrop HOW WILL THIS AFFECT investors consider the Middle East as a
of geopolitical tension and the volatility MIDDLE EAST ECONOMIES? potential investment destination? The
of oil prices creates periods of economic The charts alongside analyse the answer is simple: long-term development
uncertainty. These tensions, along with the composition of specific countries' GDPs can and should continue irrespective of the
inefficiencies created by the monarchical to investigate the percentage that oil concerning structural dynamics surrounding
states, have left the Middle East largely contributes to their economy. Also oil and the geopolitical backdrop.
underdeveloped. compared are oil and non-oil fiscal
revenue and oil and non-oil exports. Although oil has in the past provided
GLOBAL DECARBONISATION these countries with great wealth and
Being considered the cornerstone of the These charts paint a clear picture. a certain measure of stability, growth and
global energy architecture, Middle Eastern For the major economies of the Middle income distribution have been uneven,
oil-producing countries have a vested East, oil and government activities (heavily coupled with a private sector that is unable
interest in ensuring oil prices remain high funded by oil revenues) constitute more to absorb the hundreds of thousands of
in order to support their economies and than 40% of their GDP. The amount of job-market entrants each year. To build a
the region as a whole. Traditionally, this fiscal revenue generated from oil in these more resilient and inclusive economy it is
was done by controlling the supply of oil same oil export-led economies is also imperative that these countries diversify their
(through OPEC). However, the latest dip disproportionately large. To provide an economies away from being completely
in the oil price is being driven by more example: Qatar reports its direct fiscal dependent on commodity exports.
than just an oversupply (although it is a big revenue from oil to be around 67% of total
component). Two forces that are playing a fiscal revenue, but practically all investment Revenues from hydrocarbon exports are
material role in the structural decline of the income and the bulk of corporate tax no longer guaranteed, which leaves
oil price are decarbonisation policies and come from Qatar Petroleum. In this case, policymakers in a pinch as to where
low-carbon technology advancements. their oil-related fiscal revenue is probably to obtain funds. With equity markets
closer to 90%, if not more. in bearish territory, this represents
1
History of The Middle East (n.d.), Accessed: June 2018,
2
Al-Hassani, S., 1001 Inventions: The Enduring Legacy of Muslim Civilization, 3rd ed., National Geographic, 2012
18GRAPH 1: GDP COMPOSITION OF MENA COUNTRIES, 2016 a significant problem. What the region now
100%
requires is for the respective governments
90%
to push for much-needed reform in the
80% financial sector. The reforms would need
70% to be far encompassing: relaxing foreign
60% ownership rules would provide much-
50% needed market liquidity; development
40% of diversified asset classes would
30% present further investable opportunities,
20%
encouraging increased domestic
10%
investor inclusion, and strengthening
0%
the regulatory environment would ensure
Libya
Kuwait
Iraq
Oman
Saudi
Arabia
Qatar
Algeria
UAE
Bahrain
Egypt
Iran
Palestine
Yemen
Morocco
Israel
Lebanon
Jordan
more transparency and oversight in the
Oil Government Other market. While equity markets in and of
themselves cannot promote development,
GRAPH 2: O
IL AND NON-OIL FISCAL REVENUE IN SELECTED MENA
they provide the impetus for foreign capital
COUNTRIES, 2016 (% OF GENERAL FOVERNMENT REVENUE)
inflows and allow for greater transparency
100%
into the valuation of companies, which
90%
is vital for countries seeking funding and
80%
70%
sustainable economic growth.
60%
SOME STOCK MARKET
50%
CONCERNS
40%
Stock markets in the Middle East can be
30%
considered lacklustre. Even though their
20%
10%
stock market capitalisation as a percentage
0%
of GDP averages around 60%, which
Libya
Iraq
Oman
Qatar
Kuwait
Saudi
Arabia
UAE
Yemen
Algeria
Iran
Egypt
Palestine
Morocco
Lebanon
is roughly on par with global emerging
Oil Revenue Non-oil Revenue
markets, their market dynamics are dismal.
Turnover, a measurement of how often
GRAPH 3: OIL AND NON-OIL EXPORTS IN MENA COUNTRIES, 2016 shares change hands and an indication
100% of how vibrant and liquid a market is, has
90%
been pretty much stagnant over the past
80%
10 years. For 2017, Bahrain had an
70%
annual turnover of just 3.7%, with Abu
60%
Dhabi at 11% and Saudi Arabia at 49%.
50%
This is a fraction of the turnover seen
40%
in Asian markets, with China’s Shenzhen
30%
20%
Stock Exchange boasting a turnover
10%
of 264%.
0%
Not only are oil and gas the primary
Libya
Iraq
Algeria
Kuwait
Saudi
Arabia
Qatar
Oman
Iran
Bahrain
Egypt
UAE
Yemen
Tunisia
Morocco
Israel
Jordan
Lebanon
revenue drivers for the Middle East states,
Oil Exports Non-oil Exports but they also extend into stock market
Source: Bruegel based on International Monetary Fund, World Economic Outlook database, accessed in February 2017. returns. Saudi Arabian petrochemical
Note: Data on Libya refers to 2014.
and oil-related stocks make up over a
quarter of their market capitalisation
19and the Saudi financial sector makes Stock Exchange. Of further concern price slump has been the impetus that
up a further 39%. Analysis done by the is the fact that in June 2017 over 40% of these countries needed to accelerate
International Monetary Fund (IMF) has shares were held by government entities their systematic economic reform and
shown that banking profits in the Gulf in Saudi Arabia with only 27% belonging diversification strategies. By encouraging
Cooperation Council (GCC) are extremely to retail investors, which is indicative of a
the development and accelerating
positively correlated to the movement in very limited stock market culture.
privatisation, the respective domestic
oil prices. The net result is that the Saudi
Leaders around the Middle East and stock markets will allow these countries to
stock market, as a whole, is extremely
North Africa (MENA) region are now increase financing and promote a culture
susceptible to global oil prices, feeding
fully cognisant of the fact that higher of domestic saving and investing, which
volatility in the region’s markets.
oil prices cannot solve the fundamental will ultimately lead to economic growth.
Another complication is the limited number issues plaguing their economies.
Fortunately, many of these countries have
of investable opportunities available The abundant oil revenues will be unable
begun this process. We can see a list of
in the private sector. As of July 2018, to increase productivity in the public sector,
the various diversification strategies in the
only 50 companies were listed on the grow investment in the private sector
and improve the legal and regulatory table below. Whether these end up being
Abu Dhabi Securities Exchange, 40 on
the Bahrain Bourse, 62 on the Dubai environment needed to facilitate an open successful or not, remain to be seen but
Financial Market and 185 on the Saudi and improved business environment. it is the right course of action in creating
It can be argued that the extended oil an inclusive and a robust economy.
Iraq – Private Sector Development Strategy (2014-2030) (Launched in 2014)
• Increase the private sector up to a share of 60% of GDP by 2030
• Improve the country’s business environment, particularly for SMEs
• Reduce the unemployment rate to 4% or less by 2030
Kuwait – Kuwait Development Plan (2015-2020) (Launched in 2015)
• Increase the private sector up to a share of 40% of GDP by 2020
• Create public-private partnership to carry out infrastructure projects
• Increase the number of Kuwait employees in the private sector from 92 000 to 137 000 by 2020
Oman – Ninth Five-Year Development Plan (2016-2020) (Launched in 2016)
• Reduce the contribution of oil in GDP at current prices from 44% in 8th five-year plan to 26% by 2020
• Focus on the private sector and activate public-private partnerships
• Create job opportunities
• Focus on SMEs
Qatar – National Vision 2030 (Launched in 2008)
• Increase and diversify the participation of Qataris in the workforce
• Create a business climate capable of stimulating national and foreign investments
• Manage the optimum exploitation of hydrocarbon resources
• Expand industries and services with competitive advantages derived from hydrocarbon industries
• Create a knowledge-based economy characterised by innovation, entrepreneurship and excellence
Saudi Arabia – Vision 2030 (Launched in 2016)
• Increase SME contribution to GDP from 20% to 35% by 2030
• Increase foreign direct investment from 3.8% to the level of 5.7% of GDP by 2030
• Increase the private sector’s contribution from 40% to 65% of GDP by 2030
• Raise the share of non-oil exports in non-oil GDP from 16% to 50% by 2030
• Increase non-oil government revenue from SAR163 billion to SAR1 trillion by 2030
• Generate 9.5 GW of new renewable energy by 2030
Source: Bruegel based on Kingdom of Saudi Arabia (2016), People’s Democratic Republic of Algeria’s Prime Minister’s Office (2016), Republic of Iraq (2014), State of Kuwait (2015),
State of Qatar’s General Secretariat for Development Planning (2008) and Sultanate Oman (2016).
20THE MIDDLE EAST: ECONOMIES FULL OF ENERGY
WITH DWINDLING OIL REVENUES, THE PRIVATE SECTOR NEEDS TO
BECOME THE ENGINE OF NON-OIL GROWTH AND JOB CREATION.
$96 $51 $51
Barrel Barrel Barrel
PRIVATE PUBLIC PUBLIC PUBLIC
CURRENT PUBLIC SECTOR-LED GROWTH MODEL RUNNING OUT OF STEAM
PUBLIC PUBLIC PRIVATE PRIVATE
NEW GROWTH MODEL NEEDED, WITH PRIVATE SECTOR AS THE ENGINE
2014 2015 2021
CONCLUSION
About a decade ago, returns in Gulf markets
were stellar and dazzling technologically
advanced exchanges were built across
the region with some analysts predicting
that the GCC markets (particularly Saudi
Arabia and the UAE) would soon rival
markets in East Asia. These predictions
may have been premature but sustained
low oil prices with rising debt and high
unemployment may provide the impetus for
the diversification required to reinvigorate
these economies.
21THE MIDDLE EAST: ECONOMIES FULL OF ENERGY
TOP EXPORT BY REVENUE IN MIDDLE EAST ECONOMIES
PETROLEUM &
PETROLEUM PRODUCTS
PETROLEUM PRODUCTS
& CHEMICALS OIL
VEHICLES
GOLD
OIL & GAS
CRUDE OIL
FOODSTUFFS & GAS
ALUMINIUM
OIL
OPIUM
JEWELLERY
CRUDE OIL
PETROLEUM
ELECTRONICS
CLOTHING OIL
OIL
PETROLEUM
CRUDE OIL
OIL METALS/MINERALS
ELECTRONICS TEXTILE APPAREL
OTHER MACHINERY/TRANSPORTATION
PRECIOUS METALS/MINERALS FOOD/DRINK
22CONTACT US
ANDREW DITTBERNER
CHRIS POTGIETER Chief Investment Officer VICTOR MUPUNGA
Head of PCS Tel: 021 524 4867 (CPT) Research Analyst
Tel: 021 524 4582 011 217 1945 (JHB) Tel: 021 524 4466
Cell: 082 827 9777 Cell: 083 296 6928 Cell: 072 838 2919
chris.potgieter@omwealth.co.za andrew.dittberner@omwealth.co.za victor.mupunga@omwealth.co.za
MOOSA HASSIM SAMEER SINGH
Investment Analyst Research Analyst
Tel: 021 524 4609 Tel: 021 524 4529
Cell: 072 448 6369 Cell: 072 383 4490
moosa.hassim@omwealth.co.za sameer.singh@omwealth.co.za
PRIVATE CLIENT PORTFOLIO MANAGERS
CAPE TOWN
DEREK ALTON SHANE LAWRENCE PAUL STEVEN
Tel: 021 524 4566 Tel: 021 524 4656 Tel: 021 524 4572
Cell: 072 290 4220 Cell: 079 526 6369 Cell: 076 719 3958
derek.alton@omwealth.co.za shane.lawrence@omwealth.co.za paul.steven@omwealth.co.za
JOHANN VAN ZYL MICHELLE MATTHEWS
Tel: 021 524 4574 Tel: 021 524 4421
Cell: 083 261 0140 Cell: 083 979 6391
johann.vanzyl@omwealth.co.za michelle.matthews@omwealth.co.za
JOHANNESBURG
DEAN GINSBERG VISHAL HURRICHUND TREVOR O’CALLAGHAN
Tel: 011 245 3818 Tel: 011 245 3812 Tel: 011 245 3801
Cell: 083 650 8223 Cell: 082 411 7798 Cell: 083 660 8321
dean.ginsberg@omwealth.co.za vishal.hurrichund@omwealth.co.za trevor.ocallaghan@omwealth.co.za
MIKE SITHOLE GARY SMITH ROY TOPOL
Tel: 011 245 3741 Tel: 011 245 3802 Tel: 011 245 3619
Cell: 083 352 9070 Cell: 082 464 3691 Cell: 082 809 5052
mike.sithole@omwealth.co.za gary.smith@omwealth.co.za roy.topol@omwealth.co.za
PRETORIA
LOUIS FOURIE GREGORY POTGIETER JACQUES THERON
Tel: 012 369 7232 Tel: 012 369 7234 Tel: 012 369 7235
Cell: 083 391 8610 Cell: 082 823 2731 Cell: 082 495 6465
louis.fourie@omwealth.co.za gregory.potgieter@omwealth.co.za jacques.theron@omwealth.co.za
DURBAN
HELMAR BREYTENBACH JAMES BUZZARD SCOTT LOGAN
Tel: 031 581 0773 Tel: 031 581 0763 Tel: 031 581 0768
Cell: 082 564 0223 Cell: 083 509 7640 Cell: 082 908 7679
helmar.breytenbach@omwealth.co.za james.buzzard@omwealth.co.za scott.logan@omwealth.co.za
BLOEMFONTEIN
BRIAN VERMEULEN
Cell: 083 408 0528
brian.vermeulen@omwealth.co.zaThis document is for information purposes only and does not constitute financial advice in any way or form. It is important to consult a financial planner to receive financial advice
before acting on any information contained herein. Old Mutual Wealth and its directors, officers and employees shall not be responsible and disclaim all liability for any loss, damage
(whether direct, indirect, special or consequential) and/or expense of any nature whatsoever, which may be suffered as a result of or which may be attributable, directly or indirectly,
to the use of, or reliance upon any information contained in this document.
Old Mutual Wealth Private Client Securities (“PCS”) is a division of Old Mutual Wealth Trust Company (Pty) Ltd (“OMWTC”), an authorised Financial Services Provider, Reg No:
1925/002721/07. PCS is authorised to provide financial services on the OMWTC licence.
The Estuaries, 2 Oxbow Crescent, Century City 7441. Tel: +27 (0)21 524 4400, Fax: +27 (0)21 441 1060, Email: pcs@omwealth.co.za, Website: www.omwealth.co.za.
24You can also read