Colorado Department of Transportation 2022 Problem Identification Report
←
→
Page content transcription
If your browser does not render page correctly, please read the page content below

Colorado Department of Transportation
              2022 Problem Identification Report

Colorado Department of Transportation 2022 Problem Identification Statewide Report   1
Colorado Department of Transportation
                  2022 Problem Identification Report

Report Prepared for:
Highway Safety Office
Colorado Department of Transportation
2829 W Howard Place
Denver, CO 80204

Report Prepared by:
Sarah Barkley, MPH
Colorado Department of Public Health and Environment
4300 Cherry Creek Drive South
Denver, CO 80246

Contact Information:
Carol Gould
Highway Safety Office
Colorado Department of Transportation
2829 W Howard Place
Denver, CO 80204
carol.gould@state.co.us
P 303.757.9468

This report is available electronically at:
https://www.colorado.gov/pacific/cdphe/motor-vehicle-safety

    Colorado Department of Transportation 2022 Problem Identification Statewide Report   2
Table of Contents
Report Highlights ..................................................................................................................................4
Motor Vehicle Crashes and Fatalities Overview ...............................................................................5
Fatal Crashes and Fatalities ................................................................................................................6
Urban and Rural Fatalities ................................................................................................................10
Serious Injuries from Traffic Crashes ..............................................................................................11
Injury Hospitalizations .......................................................................................................................12
Mode of Transportation .....................................................................................................................16
Occupant Protection ...........................................................................................................................18
Seat Belt Compliance .........................................................................................................................20
Impaired Driving ................................................................................................................................21
Speed Enforcement .............................................................................................................................26
Motorcycle Safety ...............................................................................................................................28
Young Drivers .....................................................................................................................................30
Pedestrian Safety ................................................................................................................................34
Bicyclist Safety ....................................................................................................................................36
Distracted Driving ..............................................................................................................................38
Older Drivers ......................................................................................................................................41
Data Sources and Acknowledgements ..............................................................................................42
State Performance Measures by County ..........................................................................................45

      Colorado Department of Transportation 2022 Problem Identification Statewide Report                                                             3
Report Highlights
Motor vehicle crashes are among the leading causes of death in Colorado. This annual report describes
motor vehicle crash characteristics for crashes that occurred in Colorado to identify traffic safety issues to
reduce the number and severity of traffic crashes. The Colorado Department of Transportation (CDOT), law
enforcement agencies, local government agencies, nonprofit organizations, and health and prevention
professionals utilize this document to develop strategies to improve traffic safety in Colorado. In the
sections on the core performance measures, this report lists the top five counties with the highest counts
and the effective countermeasures to improve performance.
The year 2020 was unique because of the COVID-19 pandemic, a world-wide outbreak of a novel corona
virus. The governor issued an executive order directing all Coloradans to stay at home effective March 26,
2020 through April 11, 2020. The limited exceptions were obtaining food and other necessities, going to
and from work at critical businesses, seeking medical care, caring for dependents or pets, or caring for a
vulnerable person in another location. This may have had an impact on motor vehicle injury and death
trends, as vehicle miles traveled decreased by 7 billion vehicle miles.
The total number of motor vehicle fatalities in Colorado increased in 2020. There were 622 fatalities,
an increase of 4% from the previous year.
Speeding-related fatalities increased 20% from 2019 and was a factor in 46% of all fatalities in 2020.
There were 287 speeding-related motor vehicle fatalities in 2020 compared to 239 in 2019.
Among the people who died in an occupant motor vehicle crash, 51% were not wearing a seat belt.
There were 190 unrestrained motor vehicle occupant fatalities in 2020, one more than in 2019.
Alcohol-impaired drivers were involved in 24% of all fatalities. In 2020, an estimated 151 motor vehicle
deaths resulted from crashes involving an alcohol-impaired driver, a 7.9% decrease from 2019.
In 2020, there were 140 motorcyclist fatalities, a 36% increase from 2019. More than half of the
motorcyclists (53%) who died in 2019 were not wearing a helmet.
The number of fatalities per vehicle miles traveled (VMT) in Colorado increased 21% over the past
year. Colorado's fatality rate per 100 million VMT was slightly lower than the United States (1.32 and
1.37, respectively).
Fatalities in rural areas decreased in 2020 over the past year by 2.5%, while fatalities in urban areas
increased 9.7%.
Core performance measures varied in 2020, compared to 2019 when most core performance measures
improved. This report on the core performance measures can inform continued efforts on
countermeasures to improve performance measures or support increased efforts.
Colorado Department of Transportation 2022 Problem Identification Statewide Report 4
Motor Vehicle Crashes and Fatalities Overview
Table 1 presents an overview of motor vehicle crashes across Colorado, including core performance measures
for 2016-2020. One-year and five-year percent changes for each measure appear in the last two columns.
Green font indicates improvement, and red font indicates undesired change. The ↑ symbol indicates a percent
increase in the number, rate, or percent. The ↓ symbol indicates a percent decrease in the number, rate, or
percent. See the last two pages of this report for the core performance measures of each county. Note that
2019 data has been updated for this report.
 Table 1. Colorado traffic information and crash outcomes at a glance, 2016-2020
                                                                                                      1-year    5-year
                                                  2016      2017      2018            2019    2020
                                                                                                       %Δ         %Δ
                                                                                                        ↓-     ↓-
 Total crashes (n)                               121,149   119,373   122,504   121,648       87,629
                                                                                                      28.0%    27.7%
                                                                                                        ↑
 Colorado population (millions)                  5.54      5.60      5.70      5.76          5.81
                                                                                                       0.9%    ↑ 4.9%
                                                                                                        ↓-
 Seat belt use (%)                               84        83.8      86.3      88.3          86.3              ↑ 2.7%
                                                                                                       2.3%
 Core Performance Measures:
                                                                                                        ↑
 Fatalities (n)                                  608       648       632       596           622               ↑ 2.3%
                                                                                                       4.4%
                                                                                                        ↓-
 Serious injuries (n)                            2,956     2,884     3,112     3,190         3,164             ↑ 7.0%
                                                                                                       0.8%
 Motor vehicle occupant fatalities,                                                                     ↑
                                                 186       222       216       189           190               ↑ 2.2%
 unrestrained all seat positions (n)                                                                   0.5%
 Fatalities in crashes where driver/motorcycle
                                                                                                        ↓-       ↓-
 operator has blood alcohol content ≥0.08+       163       177       192       164           151
                                                                                                       7.9%     7.4%
 (n)
                                                                                                        ↑         ↑
 Speeding-related fatalities (n)                 211       230       210       239           287
                                                                                                      20.1%     36.0%
                                                                                                        ↑         ↑
 Motorcyclist fatalities (n)                     125       103       103       103           140
                                                                                                      35.9%     12.0%
                                                                                                        ↑        ↓-
 Unhelmeted motorcyclist fatalities (n)          82        72        58        54            74
                                                                                                      37.0%     9.8%
                                                                                                        ↑         ↑
 Driver 15-20 years old in fatal crashes (n)     59        91        81        76            83
                                                                                                      9.2%      40.7%
                                                                                                        ↑         ↑
 Pedestrian fatalities (n)                       79        92        89        73            87
                                                                                                      19.2%     10.1%
                                                                                                       ↓-        ↓-
 Bicyclist fatalities (n)                        16        16        22        20            15
                                                                                                      25.0%     6.3%
                                                                                                       ↓-        ↓-
 Driver 65+ years old in fatal crashes (n)       131       125       129       116           114
                                                                                                      1.7%      13.0%
                                                                                                        ↑        ↓-
 Distracted drivers involved in a fatal crash    67        67        53        35            54
                                                                                                      54.3%     19.4%
 Fatalities involving driver/motorcycle                                                                 ↑         ↑
                                                 68        93        84        78            91
 operator testing positive for drugs                                                                  16.7%     33.8%

 Data sources: Traffic crash reports, Colorado Department of Revenue, Division of Motor Vehicles; Fatality Analysis
 Reporting System (FARS), National Highway Traffic Safety Administration (NHTSA)

     Colorado Department of Transportation 2022 Problem Identification Statewide Report                          5
C-1 Top Five Counties
                                                                                                El Paso – 85 fatalities
                                                                                                 Weld – 54 fatalities
Fatal Crashes and Fatalities                                                                    Adams – 53 fatalities
                                                                                               Arapahoe – 52 fatalities
Core Performance Measure (C-1): Reduce the number of                                            Denver – 51 fatalities
traffic fatalities.
This section of the report gives an overview of fatalities from motor vehicle crashes in Colorado over time,
including demographics and other characteristics. Figure 1 shows the number of fatal crashes and fatalities in
Colorado from 2010-2020. 2020 had an increase in fatalities and fatal crashes following decreases in 2018 and
2019. Between 2019 and 2020, the number of fatal motor vehicle traffic crashes in Colorado increased by 5.5%,
and the number of traffic fatalities increased by 4.4%. There was also an increase in motor vehicle traffic
fatalities across the United States. Some crashes involve more than one fatality; as a result, the number of
fatalities is greater than the number of fatal crashes. There were 36,355 fatalities in 2019 and 38,824 fatalities
in 2020, a 6.8% increase.1

1
    https://www.nhtsa.gov/press-releases/2020-traffic-crash-data-fatalities Last accessed April, 2022

        Colorado Department of Transportation 2022 Problem Identification Statewide Report                                6
Colorado’s motor vehicle fatality rate increased in 2020 after decreases in 2018 and 2019. In 2020, 10.7 people
per 100,000 Colorado residents died from a motor vehicle crash compared with 10.3 people per 100,000
Colorado residents in 2019. With the exception of the year 2017, the motor vehicle fatality rate in Colorado
has been lower than the national average over the past ten years (Figure 2).

Figure 3 displays the age and sex of the people who died due to a motor vehicle crash in 2020. The 25-34 year
olds had the highest number of fatalities in 2020. More males died in motor vehicle crashes than females
during 2020 in every age category except youth ages 9-14, where an equal number of males and females
died. Table 2 shows the fatality rate by age and sex. The fatality rate also shows males ages 21-24 had the
highest death rate among all sex and age groups. Among all age groups combined, males had nearly three
times the rate of deaths from motor vehicle crashes than females.

     Colorado Department of Transportation 2022 Problem Identification Statewide Report                      7
Source: FARS
                           Table 2. Rate of Fatalities per 100,000 population
                           due to motor vehicle crashes in 2020 in Colorado,
                           by age and sex
                           Age
                                          Male   Female Rate for age group*
                           Group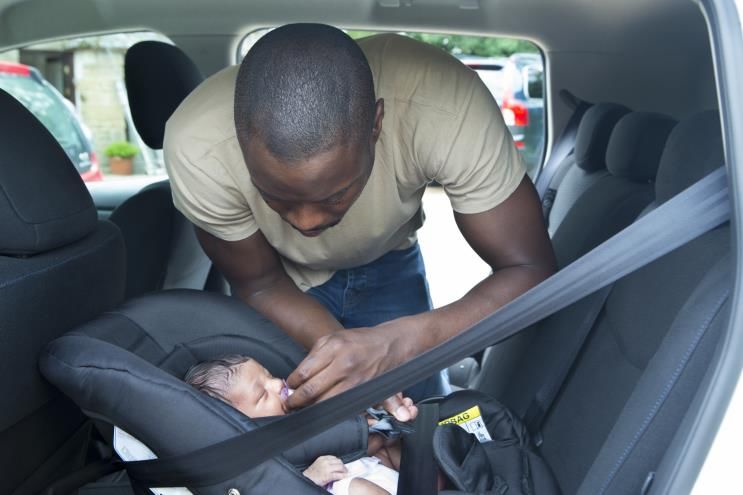
Not only were there differences in motor vehicle fatalities by age and sex, but there were also differences in
motor vehicle fatalities among races and ethnicities. Figure 4 displays the aggregate number of fatalities by
race and ethnicity from 2016 to 2020, due to the small counts in some of the race and ethnicity categories.
White, non-Hispanic individuals had the highest number of motor vehicle fatalities; however, when factoring
in population size of racial and ethnic groups living in Colorado, White, non-Hispanic individuals had a lower
rate of motor vehicle deaths compared to White Hispanic, Black, and American Indian/Alaska Native
individuals (Table 3). Differences in fatality rates for race/ethnicity groups could reflect external differences in
geography, access to emergency medical care, access to safe transportation methods and transportation
options other than motor vehicles, the built environment, road use design, weather patterns, and cultural
factors.

        Source: FARS

                 Table 3. Five-year Average Rate of Fatalities per 100,000 population
                 due to motor vehicle crashes by race and ethnicity, Colorado, 2016-
                 2020
                 Race/Ethnicity                             Rate for race/ethnicity
                 White, Non-Hispanic                                  10.5
                 White, Hispanic                                      16.3
                 Black                                                14.5
                 American Indian/Alaska Native                        17.5
                 Asian/Pacific Islander                                7.7
                 Multiracial/Other race*                               3.5
                 All races and ethnicities                            11.1
                 * Contains other races, including persons who identify with more than one race
                 Source: FARS and US Census Bureau

     Colorado Department of Transportation 2022 Problem Identification Statewide Report                           9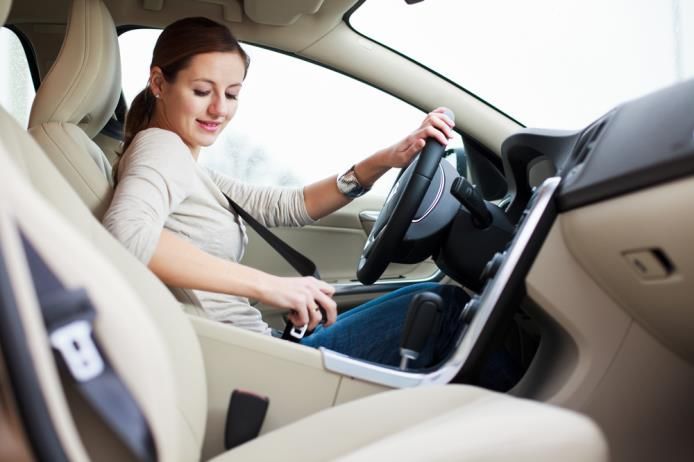
Core Performance Measure (C-3): Reduce the number of fatalities per Vehicle Miles
Traveled (VMT)

Dividing the number of motor vehicle fatalities by the number of vehicle miles traveled (VMT) takes into
account changes in the population, fuel prices, driving habits, and distances driven. Fatalities per 100 million
VMT can be compared over time and between different geographic areas. Figure 5 shows the rate of fatalities
per 100 million VMT for Colorado and the United States.22 Colorado’s fatality rate increased sharply (21%) in
2020 after a decrease in 2019. However, Colorado’s fatality rate was slightly lower than the average fatality
rate in the United States in 2020 (see Figure 5).

2
    https://www.fhwa.dot.gov/policyinformation/travel_monitoring/tvt.cfm Last accessed April 2022

       Colorado Department of Transportation 2022 Problem Identification Statewide Report                    10
Urban versus Rural Fatalities
Figure 6 displays the number of motor vehicle fatalities that occurred in urban or rural roadways. The Colorado
Department of Transportation defines which roadways are urban or rural in Colorado, and the Federal Highway
Administration approves the definitions. While motor vehicle fatalities occurring on rural roadways have
remained relatively constant over the last decade, fatalities occurring on urban roadways increased 9.7% in
one year and 89.7% between 2010 and 2020.
Colorado Department of Transportation 2022 Problem Identification Statewide Report 11C-2 Top Five Counties
Serious Injuries from Traffic Crashes Denver – 396 serious injuries
Adams – 251 serious injuries
Core Performance Measure (C-2): Reduce the number of Arapahoe – 217 serious injuries
El Paso – 189 serious injuries
serious injuries in traffic crashes Jefferson – 171 serious injuries
The number of serious injuries resulting from traffic crashes has remained steady over the past five years
(Figure 7). In this report, serious injury is defined as “evident incapacitating” on the crash report by the
responding law enforcement officer. An incapacitating injury is a type of injury that prevents the person from
walking, driving, or continuing the normal activities previously capable of performing prior to being injured.
Colorado Department of Transportation 2022 Problem Identification Statewide Report 12Injury Hospitalizations
The age-adjusted rate of hospitalizations for Colorado residents injured in motor vehicle crashes decreased by
4.9% from 2016 to 2020 (Figure 8), and the age-adjusted hospitalization rate decreased by 6% from 2019 to
2020 despite a 5% increase in the Colorado population in 2020. The motor vehicle crashes occurred in traffic
or on public roadways, and the hospitalizations occurred in non-federal, acute care hospitals in Colorado.
Source: Colorado Hospital Association, Hospital Discharge
In 2020, there were 3,127 hospitalizations among Colorado residents injured from motor vehicle crashes in
traffic or on public roads (Figure 9). The age-specific hospitalization rate for Colorado residents sustaining
injuries in motor vehicle crashes varied by age group. Adults 21 to 24 years old had the highest hospitalization
rates related to motor vehicle injuries.
Colorado Department of Transportation 2022 Problem Identification Statewide Report 13Source: Colorado Hospital Association, Hospital Discharge
Figure 10 shows the number of individuals hospitalized from motor vehicle crashes in Colorado during 2020,
including the number of males and females within each age group. The 25-34 and 35-44 year age groups had
the highest numbers of people hospitalized from motor vehicle crashes. Males accounted for two-thirds of
those hospitalized from crashes during 2020.
Source: Colorado Hospital Association, Hospital Discharge
Colorado Department of Transportation 2022 Problem Identification Statewide Report 14Table 4 shows the hospitalization rate per 100,000 population by age group and sex. The 21-24 years old age
group had the highest hospitalization rate. Males aged 21-24 had the highest hospitalizations rate from motor
vehicle crashes for every 100,000 persons, compared to the other age and sex groups.
Table 4. Crude rate of hospitalizations per 100,000 population due
to motor vehicle crashes in 2020 in Colorado, by age and sex
Crude Rate for
Age Group Male Female
age groupMode of Transportation
Individuals driving or riding motorized vehicles made up an average of 83% of the motor vehicle-related
fatalities in Colorado between 2016 and 2020 (Figure 11). Pedestrians accounted for 13% of fatalities in motor
vehicle crashes, while bicyclists averaged 3% over the five years. The percentage of pedestrian fatalities
increased in 2020, after a decrease in 2019.
Figure 12 displays the mode of transportation among persons seriously injured from a motor vehicle crash.
Most people seriously injured from a motor vehicle crash in 2020 were riding in a vehicle (96%). Pedestrians
comprised almost 3% in 2020, a decrease from 2019. Bicyclists ranged from one to five percent over the past
five years.
Colorado Department of Transportation 2022 Problem Identification Statewide Report 16As shown in Figure 11 and Figure 12, persons riding motorized vehicles comprised the majority of motor
vehicle-related fatalities and serious injuries. A motorized vehicle can be a car/van, motorcycle, pickup truck,
SUV, other vehicle type, or unknown vehicle type (such as can occur in a hit-and-run crash). Other vehicle types
include a large truck, motor home, bus, or these vehicle types when used on a public road: all-terrain vehicle,
snowmobile, and farm or construction equipment. Figure 13 below shows the type of motor vehicle individuals
were using when fatally injured. Among the fatally injured, over half (68%) of the individuals fatally injured
were riding in a passenger vehicle (car, van, SUV, or pickup truck), and 27% were riding a motorcycle. Of those
who were seriously injured, 45% were riding in a car/van, 29% were in an SUV, and 2% riding a motorcycle
(Figure 14).
Colorado Department of Transportation 2022 Problem Identification Statewide Report 17C-4 Top Five Counties
Occupant Protection El Paso – 24 fatalities
Weld – 22 fatalities
Core Performance Measure (C-4): Reduce the number of Arapahoe– 21 fatalities
unrestrained passenger vehicle occupant fatalities, all El Paso – 21 fatalities
Adams – 19 fatalities
seat positions.
In 2020, there were 190 unrestrained passenger vehicle occupant fatalities,
almost the same as 2019 (Figure 15). After rising sharply from 2016 to 2017, Countermeasures that Work
unrestrained passenger fatalities have declined to a similar number as 2016. Increase seat belt use:
In 2020, these 190 fatalities of unrestrained occupants represented 54.1% of Targeting Adults:
Seat Belt Use Laws
the 351 passenger vehicle occupant fatalities (Table 5). State primary enforcement
seat belt use laws
Local primary enforcement
seat belt use laws
Increased seat belt use law
penalties
Seat Belt Law Enforcement
Short term high-visibility belt
law enforcement
Integrated nighttime seat belt
enforcement
Sustained enforcement
Communications & Outreach
Supporting enforcement
Strategies for low-belt-use
groups
Targeting Youth:
Child/Youth Occupant Restraint
Laws
Strengthening child/youth
occupant restraint laws
Child Restraint/Booster Seat Belt
Law Enforcement
Short term high-visibility CR
law enforcement
Communications & Outreach
Strategies for older children
Strategies for child restraint
and booster seat use
https://www.nhtsa.gov/sites/nhtsa
.gov/files/2021-
09/Countermeasures-
10th_080621_v5_tag.pdf
Colorado Department of Transportation 2022 Problem Identification Statewide Report 18Table 5 shows the number of unrestrained fatalities in Colorado by age and sex for 2019 and 2020. Of 351 total
fatalities among motor vehicle occupants in 2020, 190 occupants (54.1%) were unrestrained. In 2020, the 25-
34 age group had the highest percentage of unrestrained occupant fatalities, compared to the 15-20 age group
in 2019. In 2020, for all ages combined, almost twice as many males were unrestrained than females.
Table 5. Unrestrained motor vehicle occupant fatalities by age and sex,
Colorado, 2019 & 2020
Age
Sex 2019 2020
Group
Male 0 0Seat Belt Compliance
Behavioral Performance Measure (B-1):
Increase the observed seat belt use for passenger vehicles.
Increasing seat belt use is a major initiative of the Highway Safety Office (HSO). Each year, HSO funds an
observational survey of occupant protection use statewide. Figure 16 shows the steady increase in seat belt
use from 2010-2019 with a slight decrease in 2020. In 2020, Colorado’s seat belt use rate was 86.3% which
remained lower than the national rate of 90%.33
Historically, fewer occupants in light trucks wear seat belts compared to occupants in other passenger vehicles.
In 2010, almost 73% of light truck occupants wore seat belts. Over the past 10 years, this increased to 78%.
Despite this improvement, seat belt use among light truck occupants was still lower than the 86% overall seat
belt use.
3
https://crashstats.nhtsa.dot.gov/Api/Public/ViewPublication/813072 Last accessed April 2022.
Colorado Department of Transportation 2022 Problem Identification Statewide Report 20C-5 Top Counties
El Paso – 21 fatalities
Arapahoe– 20 fatalities
Weld -15 fatalities
Adams – 14 fatalities
Denver - 11
Impaired Driving
Core Performance Measure (C-5): Reduce the number of
fatalities in crashes involving a driver or motorcycle Countermeasures that Work
To reduce alcohol- and drug-impaired
operator with Blood Alcohol Content (BAC) of ≥0.08. driving:
Information regarding driving while impaired in Colorado is complex. In
fatal crashes, the standard procedure is to test the person who died for Deterrence
1) Laws
alcohol and/or drugs. The law requires an arrested driver to take a Administrative license
chemical test of their breath or blood if the law enforcement officer has revocation/suspension
probable cause to believe that the driver’s impairment is from alcohol or Open container
High-BAC sanctions
another impairing substance. Drivers who refuse to comply with testing BAC test refusal penalties
face consequences to their driving privileges. Despite the best efforts of Alcohol-impaired driving law review
2) Enforcement
law enforcement, some crash records lack driver’s BAC test results. To
Publicized sobriety checkpoints
remedy missing test results on BAC, the National Highway Traffic Safety High visibility saturation patrols
Administration (NHTSA) uses methods to impute missing BAC values for Preliminary breath test devices
Passive alcohol sensors
drivers involved in a crash where a fatality occurred. Imputation is a
Integrated enforcement
process of replacing missing data with a probable value based on other 3) Prosecution and Adjudication
available data. The alcohol-related performance measure in Figure 17 is DWI Courts
Limits on diversion and plea agreements
NHTSA’s imputed measure. The number of fatalities involving an alcohol- Court monitoring
impaired driver increased each year from 2016 to 2018 but decreased 8% 4) DWI offender treatment, monitoring,
in the past year. control
Alcohol problem assessment, treatment
Alcohol ignition interlocks
Vehicle and license plate sanctions
DWI offender monitoring
Lower BAC limit for repeat offenders
Prevention, intervention, communications
& outreach
Alcohol screening and brief intervention
Mass-media campaigns
Underage drinking & alcohol-impaired driving
Minimum drinking age 21 laws
Zero-tolerance law enforcement
Alcohol vendor compliance checks
Other minimum legal drinking age 21 law
enforcement
Drugged Driving
Enforcement of drug-impaired driving
https://www.nhtsa.gov/sites/nhtsa.gov/files/2
021-09/Countermeasures-
10th_080621_v5_tag.pdf
Colorado Department of Transportation 2022 Problem Identification Statewide Report 21A blood alcohol content (BAC) of 0.08 grams of alcohol per deciliter of blood increases crash risk exponentially
and therefore is the state and federal standard for legal intoxication. It is important to look at the drivers who
were involved in a fatal crash, not just the person who was fatally injured, to help inform prevention efforts.
Table 6 shows the number of drivers with a blood alcohol content greater than or equal to 0.08 involved in a
fatal crash in 2019 and 2020. Males aged 25-34 had the highest number of drivers with a BAC at or above legal
intoxication involved in a fatal crash. During 2020, there were 878 drivers involved in a fatal crash in Colorado,
15.7% of whom were intoxicated. The percentage of alcohol-intoxicated drivers involved in a fatal crash
increased from 14.3% in 2019 to 15.7% in 2020.
Table 6: Drivers with a blood alcohol content ≥ 0.08 in fatal crashes in
Colorado, by impaired driver age and sex
Age
Sex 2019 2020
Group
Driver
Male 6 12
15-20 Female 4 5
Total 10/76 (13.2%) 15/83 (18.1%)
Male 17 22
21-24 Female 2 5
Total 19/93 (20.4%) 27/88 (30.7%)
Male 33 36
25-34 Female 12 8
Total 45/195 (23.1%) 44/201 (21.9%)
Male 16 15
35-44 Female 3 5
Total 19/145 (13.1%) 20/154 (13%)
Male 15 20
45-54 Female 3 1
Total 18/118 (15.3%) 21/120 (17.5%)
Male 10 4
55-64 Female 1 1
Total 11/108 (10.2%) 5/94 (5.3%)
Male 1 3
65-74 Female 1 0
Total 2/75 (2.7%) 3/75 (4%)
Male 0 0
75+ Female 0 0
Total 0/41 (0%) 0/39 (0%)
Male 98 113
All Ages Female 26 25
%crashes 124/866 (14.3%) 138/878 (15.7%)
Source: FARS
Colorado Department of Transportation 2022 Problem Identification Statewide Report 22C-14 Top Five Counties
El Paso – 12 fatalities
Adams, Weld – 10 fatalities
Core Performance Measure (C-14): Reduce the number Denver – 6 fatalities
of drivers or motorcycle operators involved in fatal Douglas – 5 fatalities
crashes testing positive for drugs.
Prescription drugs, over-the-counter drugs, and illegal drugs can affect a person’s ability to drive. Taking legal
drugs or illegal drugs, alone or in combination with alcohol, can cause impairment. An impaired driver puts
the driver, passengers, and other road users at risk. 4 Figure 18 shows the trend of motor vehicle fatalities
involving a driver under the influence of drugs. After a three-year decrease, the number of fatalities involving
a driver under the influence of drugs increased in 2020.
4
Berning, A., Compton, R., & Wochinger, K. (2015, February). Results of the 2013–2014 National Roadside Survey of
alcohol and drug use by drivers. (Traffic Safety Facts Research Note. Report No. DOT HS 812 118). Washington, DC:
National Highway Traffic Safety Administration.
Colorado Department of Transportation 2022 Problem Identification Statewide Report 23Table 7 describes drivers who tested positive for drugs and were involved in fatal motor vehicle crashes in 2019
and 2020. The percentage of drivers involved in fatal crashes who were impaired by drugs increased slightly
from 2019 to 2020. Males in the 25-34 age group had the highest number of drug-impaired drivers in 2020.
Table 7: Drivers testing positive for drugs in fatal crashes in Colorado, by
impaired driver age and sex
Age
Sex 2019 2020
Group
Driver
Male 13 11
15-20 Female 2 3
Total 15/76 (19.7%) 14/83 (16.9 %)
Male 15 8
21-24 Female 2 2
Total 17/93 (18.3%) 10/88 (11.4%)
Male 17 19
25-34 Female 4 7
Total 21/195 (10.8%) 26/201 (12.9%)
Male 12 17
35-44 Female 2 8
Total 14/145 (9.7%) 25/154 (16.2%)
Male 8 15
45-54 Female 4 2
Total 12/118 (10.2%) 17/120 (14.2%)
Male 5 11
55-64 Female 5 1
Total 10/108 (9.3%) 12/94 (12.8%)
Male 7 8
65-74 Female 0 1
Total 7/75 (9.3%) 9/75 (12%)
Male 1 1
75+ Female 0 0
Total 1/41 (2.4%) 1/39 (2.6%)
Male 79 91
All Ages Female 19 24
%crashes 98/866 (11.3%) 115/878 (13.1%)
Source: FARS
Colorado Department of Transportation 2022 Problem Identification Statewide Report 24Marijuana Impaired Driving
Like alcohol, marijuana has measurable physiological effects that may impair the ability of a person to drive
and react quickly in critical situations.5, 6 National Highway Traffic Safety Administration (NHTSA) studies have
shown marijuana impairs crucial abilities needed to drive safely.7 Impairments include:
Slowed reaction time Impaired cognitive performance
Difficulties in road tracking and lane- Impaired executive functions, including
position variability (inability to stay in the route planning, decision-making and risk-
driving lane). taking or a combination
Decreased divided attention
Colorado law allows the prosecution of drivers that show signs of impairment from marijuana. Five nanograms
of active tetrahydrocannabinol (THC) in their blood creates a permissible inference that the driver is under the
influence of cannabis. However, there is no roadside device in Colorado to detect THC, so law enforcement
officers, including those trained as drug recognition experts (DREs), base arrests on observed impairment.
Under Colorado law, officers can arrest someone who uses marijuana for medicinal purposes for driving under
the influence (DUI) if an officer observes impairment. Figure 19 displays the number of fatalities from motor
vehicle crashes where the driver tested positive with five nanograms or higher of Delta 9 THC (the active
component in marijuana). Prior to 2016, data collection on Delta 9 was not complete. Fatalities from a
cannabis-involved driver decreased 25% from 2019 to 2020.
Source: Toxicology results, Colorado Department of Transportation
1. Data includes fatalities where alcohol or other drugs may also be present.
2. In Colorado, there is a "permissible inference" that a person is under the influence of a) cannabis - if their blood contains 5
nanograms or more of Delta 9-THC per milliliter in whole blood or b) alcohol - if their blood contains .08 grams or more of
alcohol per 100 grams in the whole blood.
5 National Academies of Sciences, Engineering, and Medicine. 2017. The health effects of cannabis and cannabinoids: Current state of
evidence and recommendations for research. Washington, DC: The National Academies Press.
6
Monitoring Health Concerns Related to Marijuana in Colorado: 2018 Summary. Colorado Department of Public Health and
Environment.
7 Compton, R. (2017, July). Marijuana-Impaired Driving - A Report to Congress. (DOT HS 812 440). Washington, DC: National Highway
Traffic Safety Administration.
Colorado Department of Transportation 2022 Problem Identification Statewide Report 25Speed Enforcement C-6 Top Five Counties
Core Performance Measure (C-6): Reduce the number of El Paso – 40 fatalities
speeding related fatalities. Adams – 25 fatalities
Arapahoe – 25 fatalities
Speeding-related motor vehicle fatalities increased by 20% between 2019 Jefferson – 24 fatalities
Weld – 21 fatalities
and 2020 (Figure 20). Speeding contributed to 46% of all fatalities in 2020.
Countermeasures that Work
Reduce aggressive driving &
speeding:
Laws
Speed Limits
Enforcement
Automated enforcement
Communications & Outreach
Public information supporting
enforcement
Listed have a 3-5 star effectiveness
rating. For all countermeasures, visit
https://www.nhtsa.gov/sites/nhtsa.gov/
files/2021-09/Countermeasures-
10th_080621_v5_tag.pdf
Colorado Department of Transportation 2022 Problem Identification Statewide Report 26Table 8 describes drivers who were cited to be speeding or exceeding the safe or posted speed in crashes in
which a fatality occurred in 2019 and 2020. Law enforcement officers indicated that speeding was the driver
action, or specific law violation, among 28% of all drivers in a fatal crash in 2020, compared with 24% in 2019.
The pattern by age and sex was similar for 2019 and 2020. Males ages 21-24 and ages 25-35 had a high number
of drivers speeding among the total number of drivers in crashes involving fatalities in 2019 and 2020. Males
ages 21-24 represented the greatest percentage of speeding drivers in fatal crashes in both years.
Table 8: Drivers who were speeding in fatal crashes in Colorado, by driver
age and sex
Age
Sex 2019 2020
Group
Driver
Male 20 24
15-20 Female 6 7
Total 26/76 (34.2%) 31/83 (37.3%)
Male 35 29
21-24 Female 5 7
Total 40/93 (43%) 36/88 (40.9%)
Male 46 54
25-34 Female 12 14
Total 58/195 (29.7%) 68/201 (33.8%)
Male 27 31
35-44 Female 3 8
Total 30/145 (20.7%) 39/154 (25.3%)
Male 15 36
45-54 Female 4 2
Total 19/118 (16.1%) 38/120 (31.7%)
Male 17 12
55-64 Female 1 2
Total 18/108 (16.7%) 14/94 (14.9%)
Male 9 8
65-74 Female 1 3
Total 10/75 (13.3%) 11/75 (14.7%)
Male 1 3
75+ Female 1 1
Total 2/41 (4.9%) 4/39 (10.3%)
Male 171 200
All Ages Female 33 44
%crashes 205/866 (23.7%) 245/878 (27.9%)
Source: FARS
Colorado Department of Transportation 2022 Problem Identification Statewide Report 27Motorcycle Safety C-7 Top Five Counties
Core Performance Measure (C-7): Reduce the number of El Paso – 26 fatalities
motorcyclist fatalities. Jefferson – 15 fatalities
Adams – 12 fatalities
Denver – 11 fatalities
Motorcyclist fatalities increased by 12% from 2016 to 2020. However, the Pueblo – 9 fatalities
number of motorcyclist fatalities increased 36% in 2020 from 2019 s (Figure
21). The number of unhelmeted motorcyclists also increased in 2020 after three years of decreases.
Unhelmeted motorcyclist fatalities represented 53% of all motorcyclist fatalities in 2020.
Countermeasures that Work
Improve motorcycle safety:
Motorcycle Helmets
Universal coverage state
motorcycle helmet use laws
Alcohol Impairment
Alcohol-impaired
motorcyclists: detection,
enforcement, & sanctions
Listed have a 3-5 star effectiveness
rating. For all countermeasures, visit
chrome-
extension://efaidnbmnnnibpcajpcglclefi
ndmkaj/viewer.html?pdfurl=https%3A%
2F%2Fwww.nhtsa.gov%2Fsites%2Fnhtsa
.gov%2Ffiles%2F2021-
09%2F15100_Countermeasures10th_08
0621_v5_tag.pdf&clen=7302462&chunk
=true
Colorado Department of Transportation 2022 Problem Identification Statewide Report 28Core Performance Measure (C-8): Reduce the number of unhelmeted motorcyclist
fatalities.
C-8 Top Five Counties
There were 103 motorcyclist fatalities in 2019 and 140 in El Paso – 15 fatalities
2020. About 53% of the motorcyclists who died were not Denver – 8 fatalities
wearing helmets in both years (Figure 21). Jefferson, Pueblo – 7 fatalities
Adams, Mesa, Weld – 6 fatalities
Table 9 shows the number of motorcyclists (operators and/or
passengers) who died in a motorcycle crash by age, sex, and
El Paso – 6 fatalities
helmet status in 2019 and 2020. In 2020, most motorcyclist fatalities were male (127 of 140 riders). Of these
140 fatalities, 74 (53%) did not wear a helmet, about the same as 2019. The 25-34 age group had the most
motorcyclist fatalities; however, the 21-24 age group had the largest percentage (84%) of unhelmeted
motorcyclist fatalities in 2019.
Table 9: Motorcyclist fatalities and serious injuries in Colorado,
by age and sex
2019 2020
Motorcyclist Fatalities Motorcyclist Fatalities
Age group Sex No Helmet Total No Helmet Total
Male 1 2 1 2
15-20 Female 1 1 0 0
Total 2/3 (66.6%) 3 1/2 (50%) 2
Male 3 10 7 17
21-24 Female 0 0 9 2
Total 3/10 (30%) 10 16/19 (84.2%) 19
Male 10 20 14 31
25-34 Female 1 3 0 2
Total 11/23 (47.8%) 23 14/33 (42.4%) 33
Male 15 21 14 21
35-44 Female 1 2 2 6
Total 16/23 (69.6%) 23 16/27 (59.3%) 27
Male 9 13 13 26
45-54 Female 3 4 1 1
Total 12/17 (70.6%) 17 14/27 (51.9%) 27
Male 8 16 12 16
55-64 Female 0 1 0 0
Total 8/17 (47%) 17 12/16 (75%) 16
Male 2 9 8 12
65-74 Female 0 1 1 2
Total 2/10 (20%) 10 9/14 (64.3%) 14
Male 48 91 70 127
All Ages Female 6 12 4 13
Total 54/103 (52.4%) 103 74/140 (52.8%) 140
Source: FARS
Colorado Department of Transportation 2022 Problem Identification Statewide Report 29Young Drivers C-9 Top Five Counties
Core Performance Measure (C-9): Reduce the number of Adams – 12 drivers
El Paso – 10 drivers
drivers age 20 or younger involved in fatal crashes.
Arapahoe – 8 drivers
Weld – 7 drivers
The number of drivers ages 15-20 involved in a fatal motor vehicle crash
Jefferson – 6 drivers
decreased from 2017 to 2020. Overall, the number of young drivers who
were involved in a fatal crash increased 11.9% from 2016 to 2020 (Figure
22). The population of persons aged 15 to 20 in Colorado increased only five
percent during the same time frame, indicating that population alone did not
drive the increase in young drivers involved in a fatal crash. Countermeasures that
Work
Improve young-driver
safety:
Graduated Driver Licensing
(GDL)
Graduated driver licensing
Learner’s permit length,
supervised hours
Intermediate-nighttime
restrictions
Intermediate- passenger
restrictions
Traffic Law Enforcement
Enforcement of GDL &
zero-tolerance laws
Listed have a 3-5 star effectiveness
rating. For all countermeasures,
visit
https://www.nhtsa.gov/sites/nhtsa
.gov/files/2021-
09/Countermeasures-
10th_080621_v5_tag.pdf
Colorado Department of Transportation 2022 Problem Identification Statewide Report 30Table 10 compares the number of drivers ages 15-20 involved in a fatal crash in 2019 and 2020. Young drivers
ages 15-20 accounted for nine percent of the drivers involved in fatal crashes in 2019 and for eight percent of
the drivers involved in fatal crashes in 2020. Twice as many young male drivers than young female drivers
were involved in a fatal crash in 2020.
Table 10: Young drivers involved fatal crashes by age and sex of driver
2019 2020
Drivers in fatal
Age Group Sex crashes Drivers in fatal crashes
Male 6 4
15-16 Female 3 7
Total 9 11
Male 23 21
17-18 Female 7 14
Total 30 35
Male 25 28
19-20 Female 12 9
Total 37 37
Male 54 53
Total: 15-20 Female 22 30
Total 76 83
Source: FARS
Colorado Department of Transportation 2022 Problem Identification Statewide Report 31Table 11 displays the type of driver’s license the driver aged 15 to 20 possessed at the time of the fatal crash.
A learner’s permit is the first stage of a tiered licensing process.8 A person with a learner’s permit can drive if
they are accompanied by an adult 21 years of age or older seated next to the driver and in possession of a valid
Colorado license. Intermediate driver’s license is the second stage toward obtaining a full driver’s license, which
eliminates the supervision requirement but still includes driving restrictions, including nighttime restrictions
and a limit on the number of passengers allowed in the vehicle. A full driver’s license is a license with unlimited
driving privileges. A temporary license is any non-permanent license that may be issued while the permanent
license is being processed by the Department of Motor Vehicles or is issued to drive in an area different from
where the permanent driver’s license was issued (i.e. foreign country). In 2020, the majority of young drivers
in a fatal crash had an intermediate driver’s license (n=21), 11 drivers did not have a driver’s license, and three
had a learner’s permit.
Table 11: Young drivers involved fatal crashes by type of driver's license, Colorado, 2020
Intermediate
Learner's Driver's Full Driver's Temporary
Age Group Not Licensed Permit License License License
15-16 2 1 5 1 0
17-18 6 2 5 4 1
19-20 3 0 11 3 4
Total: 15-20 11 14 34 13 11
Source: FARS
Law enforcement officers investigating the crash also record the most apparent human factor that contributed
to the crash. Figure 23 shows the top contributing factors associated with injury and fatal crashes among young
8
Colorado Driver Handbook, Colorado Department of Revenue. Accessible at https://www.codot.gov/safety/traffic-
safety-pulse/2020/november-2020/the-colorado-driver-handbook
Colorado Department of Transportation 2022 Problem Identification Statewide Report 32drivers, ages 15 to 20, compared to drivers age 21 or older in 2020. Inexperience was the leading contributing
factor in injury/fatal crashes among young drivers followed by aggressive driving.
Source: Crash reports, Colorado Department of Revenue
Distracted = passenger, cell phone, radio, food, object, animal, etc.
Motor vehicle fatalities among people ages 15-20 (all motor vehicle occupant, pedestrian, and bicyclist
fatalities) increased by 7.3% from 2016 to 2020 (Figure 24). Though not shown here, more drivers than
passengers aged 15-20 were killed in a motor vehicle crash in 2020 (30 drivers versus 27 passengers). There
were only two pedestrians and no bicyclists aged 15-20 killed in a motor vehicle crash in 2020.
Colorado Department of Transportation 2022 Problem Identification Statewide Report 33C-10 Top Five Counties
Pedestrian Safety Denver – 15 fatalities
Core Performance Measure (C-10): Reduce the Adams – 12 fatalities
Arapahoe – 11 fatalities
number of pedestrian fatalities. El Paso – 11 fatalities
Jefferson – 10 fatalities
In 2020, 87 pedestrians died from a motor vehicle collision. These
pedestrian fatalities accounted for 14% of all 622 motor vehicle
fatalities in 2020. Pedestrian fatalities increased by 10% from 2016-2020 and 19% from 2019-2020 (Figure 25).
Countermeasures that
Work
Improve pedestrian and bicycle
safety:
Pedestrian
School-aged Children
Elementary-age child pedestrian
training
Safe routes to school
All Pedestrians
Pedestrian safety zones
Reduce and enforce speed limits
Conspicuity enhancement
Enforcement strategies
Bicycle
Children
Bicycle helmet laws for children
Safe routes to school
Adult Bicyclists
Bicycle helmet laws for adults
All Bicyclists
Active lighting and rider
conspicuity
Listed have a 3-5 star effectiveness rating. For
all countermeasures, visit
https://www.nhtsa.gov/sites/nhtsa.gov/files/
2021-09/Countermeasures-
10th_080621_v5_tag.pdf
Table 12 shows pedestrian
fatalities from motor vehicle crashes for each age and sex group in 2019 and 2020. The “Total” row within each
age group shows the total number of fatalities in that age group. The last row in Table 12 shows pedestrian
Colorado Department of Transportation 2022 Problem Identification Statewide Report 34fatalities as a percentage of all motor vehicle fatalities (of all ages). More pedestrian fatalities occurred among
males than females in both years. In 2020, 76% of the 87 pedestrian fatalities were male.
Table 12. Pedestrian fatalities by age and sex, Colorado, 2019 & 2020
Age
Sex 2019 2020
Group
Male 1 1C-11 Top Counties
Boulder, El Paso – 3 fatalities
Bicyclist Safety Arapahoe – 2 fatalities
Core Performance Measure (C-11): Reduce the Adams, Douglas, Garfield, Jefferson, La
number of bicyclist fatalities Plata, Larimer, Montrose– 1 fatalities
In 2020, 15 bicyclists died from a motor vehicle crash (Figure 26), a 25% decrease from 2019. The number of
bicycle fatalities in 2020 returned to similar level as 2016.
Colorado Department of Transportation 2022 Problem Identification Statewide Report 36Table 13 shows the number of bicyclist fatalities due to a motor vehicle crash for each age group and sex in
2019 and 2020. All bicyclist fatalities in 2020 were over the age of 21 and male.
Table 13. Bicyclist fatalities by age and sex, Colorado, 2019 & 2020
Age
Sex 2019 2020
Group
Male 0 0Distracted Driving
Core Performance Measure (C-12): Reduce the number
of Distracted Drivers involved in a fatal crash C-12 Top Counties
Adams, Weld– 5 drivers
In this report, “distracted” means a passenger, animal, cell Arapahoe, Denver, Jefferson – 4
phone, radio, food, or other objects in the motor vehicle diverted drivers
the driver’s attention from the road. There were 54 drivers
involved in a distracted driving crash, which resulted in 68
fatalities in 2020. Figure 27 displays the number of distracted
drivers involved in a fatal crash during the past five years. The
number of distracted drivers decreased by 19% over the past five
years and yet increased 54% from 2019 to 2020.
Countermeasures that Work
Reduce distracted and drowsy
driving:
Laws and Enforcement
GDL requirements for
beginning drivers
High visibility cell phone/text
messaging enforcement
Listed have a 3-5 star effectiveness
rating. For all countermeasures,
visit
https://www.nhtsa.gov/sites/nhtsa.go
v/files/2021-09/Countermeasures-
10th_080621_v5_tag.pdf
Figure 28 shows the type of distraction among drivers involved in a fatal distracted driving crash in Colorado in
2020. A large percentage, 39% of drivers, had no details known about the type of distraction. Inattention to
driving was the source of distraction for 21% of distracted drivers. A cellular phone, either talking/listening or
Colorado Department of Transportation 2022 Problem Identification Statewide Report 38other phone use, was the source of distraction for 27% of distracted drivers. Another occupant in the vehicle
distracted the driver in 13% of the crashes where distracted driving was involved.
Human Contributing Factors in All Traffic Crashes
Colorado Department of Transportation 2022 Problem Identification Statewide Report 39Figure 29 shows the top human contributing factors that law enforcement officers noted in motor vehicle
crashes in 2020. Selecting one contributing factor poses a challenge because a driver’s circumstance and
contributing factor may fall into one or more categories, and a driver may not fully reveal their behavior and
the circumstances at the time of the crash. The top human contributing factor in all crashes in 2020 was
‘distracted’. The definition ‘distracted’ includes a driver being distracted by a passenger, cell phone, radio, food,
pet or other object diverting the driver’s attention from the road and from the traffic.
Source: Crash reports, Colorado Department of Revenue
Distracted = passenger, cell phone, radio, food, object, animal, etc.
Colorado Department of Transportation 2022 Problem Identification Statewide Report 40Older Drivers C-13 Top Counties
El Paso, Larimer – 14 drivers
Core Performance Measure (C-13): Reduce the number
Arapahoe – 8 drivers
of drivers age 65 and older involved in fatal crashes Denver, Douglas – 7 drivers
Between 2016 and 2020, the number of drivers age 65 years or older who
died in a motor vehicle crash, whether or not at fault for the crash, decreased
13% (Figure 30). During this same period, the number of Coloradans aged 65
and older increased by 19% from 738,773 persons in 2016 to 877,647 persons
in 2020. In 2020, there were 114 drivers ages 65 or older involved in a fatal Countermeasures that
motor vehicle crash, about the same as 2019. Work
Improve older driver
safety:
Licensing
License screening &
testing
Referring older
drivers to licensing
agencies
License restrictions
Traffic Law
Enforcement
Law enforcement
roles
Listed have a 3-5 star
effectiveness rating. For all
countermeasures, visit
https://www.nhtsa.gov/sites/nht
sa.gov/files/2021-
09/Countermeasures-
10th_080621_v5_tag.pdf
Conclusion
Efforts are still needed to reduce fatalities and serious injuries from motor vehicle crashes. The information
provided in this report, including the county results below, can help traffic safety and injury prevention
professionals at the state and local levels to address modifiable driving behaviors to improve traffic safety.
Policy-makers, community organizations, and individuals should use information from this report to identify
where and how to focus prevention efforts.
Colorado Department of Transportation 2022 Problem Identification Statewide Report 41Data Sources and Acknowledgements
Data Sources for the FY 2022 Problem Identification Report
Colorado Performance Measures and Statewide Goals for 2020
This information comes from the 2020 Colorado Integrated Safety Plan by the Colorado Department of
Transportation. The 2020 Colorado Integrated Safety Plan includes performance targets that are set for the
year 2020.
Countermeasures That Work
For select performance measures of CDOT, this report summarizes countermeasures that have a 3-5 star
effectiveness rating from Countermeasures That Work: A Highway Safety Countermeasure Guide for State
Highway Safety Offices, Tenth Edition, published in 2020 and available on the web. See:
https://www.nhtsa.gov/sites/nhtsa.gov/files/2021-09/Countermeasures-10th_080621_v5_tag.pdf
Crash Reports (Colorado DRIVES)
Colorado Driver License, Record, Identification and Vehicle Enterprise Solution (Colorado DRIVES) provides
crash data, defined as an incident where at least one motor vehicle in motion on a traffic way (public road)
resulted in an injury or unintentional property damage. This data tracking system originates from the Colorado
Department of Revenue.
Fatality Analysis Reporting System (FARS)
FARS provides detailed data about persons who died within 30 days of the crash, including motorcyclists, motor
vehicle drivers, motor vehicle passengers, pedestrians, and bicyclists involved in fatal motor vehicle crashes.
FARS SAS data files are obtained from the National Highway Traffic Safety Administration website.
Hospital Discharge Data
Hospital discharge data provides data where injury was mentioned as a discharge diagnosis in one of the thirty
diagnoses and the mechanism of injury was motor vehicle, traffic for Colorado residents treated in non-federal,
acute care hospitals as reported to the Colorado Hospital Association (CHA). National hospital coding rules
defines “motor vehicle, traffic” as events involving a motor vehicle that occur entirely or partially on public
streets, roadways, and highways. This data source is referenced as CHA Discharge Data in figures in this report.
The Colorado Department of Public Health and Environment analyzed the CHA Discharge Data in compliance
with the data use agreement. CHA was not involved in the analysis or production of this report.
Population Estimates
The Colorado Department of Local Affairs (DOLA) estimates state and county population in Colorado. This
report uses that DOLA population estimates accessed from the DOLA website or the Colorado Health
Information Dataset website. This data is referenced as DOLA data in the figures of this report. Population
estimates for the United States were obtained from the U.S. Census website.
Colorado Department of Transportation 2022 Problem Identification Statewide Report 42Restraint Use
The prevalence of seat belt use, car seat use, and booster seat use come from observational surveys conducted
by Atelior, Division of Transportation in partnership with Colorado Department of Transportation and posted
on the Colorado Department of Transportation website.
Vehicle Miles Traveled (VMT)
VMT data come from the Office of Highway Policy Information, Highway Statistics Series at the U.S. Department
of Transportation (USDOT) Federal Highway Administration (FHA) and are referenced as "USDOT FHA" in
figures in this report.
Acknowledgements
The Colorado Department of Transportation, Highway Safety Office, contracted with the Colorado Department
of Public Health and Environment (CDPHE) to prepare the Problem Identification Report. CDPHE would like to
gratefully acknowledge the leadership and contributions of the following individuals:
Glenn Davis, M.Ed
Highway Safety Manager
Carol Gould
Highway Safety Manager
Colorado Department of Transportation 2022 Problem Identification Statewide Report 43Colorado state performance measures by county, 2020
Fatalities in
Occupant crashes where Driver
fatalities, driver/ under 21
unrestrained motorcycle Speeding- Unhelmeted years old in
Performance Serious all seat operator has related motorcyclist Motorcyclist fatal Pedestrian
Measures Fatalities injuries positions BAC ≥ 0.08 fatalities fatalities fatalities crashes fatalities
Colorado ISP
Target 603 3,161 198 184 225 55 103 79 80
Colorado 622 3,164 190 151 287 74 140 83 87
Adams 53 251 19 14 25 6 12 12 12
Alamosa 5 3 2 0 1 0 0 1 1
Arapahoe 52 217 21 20 25 2 8 8 11
Archuleta 0 3 0 0 0 0 0 0 0
Baca 3 4 3 1 0 0 0 1 0
Bent 2 0 2 0 0 0 0 0 0
Boulder 16 101 4 4 8 0 0 5 4
Broomfield 4 15 1 1 2 2 2 0 0
Chaffee 3 10 1 0 2 0 0 1 0
Cheyenne 10 0 1 1 8 0 0 1 0
Clear Creek 1 12 0 0 0 0 1 0 0
Conejos 1 1 1 1 1 0 0 0 0
Costilla 0 2 0 0 0 0 0 0 0
Crowley 2 1 1 1 0 0 0 1 0
Custer 5 1 1 0 4 1 3 0 1
Delta 8 10 4 1 3 0 1 2 1
Denver 51 396 8 11 15 8 11 4 15
Dolores 1 0 0 0 0 0 0 0 0
Douglas 22 118 7 4 15 2 8 5 1
Eagle 2 25 0 1 1 0 0 0 1
El Paso 85 189 24 21 40 15 26 10 11
Elbert 5 6 1 0 3 1 2 1 0
Fremont 6 17 2 1 1 1 2 1 0
Garfield 12 14 3 6 6 1 1 2 1
Gilpin 1 0 0 0 1 0 1 0 0
Grand 1 12 0 0 0 1 1 0 0
Gunnison 12 6 6 5 5 0 1 3 0
Hinsdale 1 0 0 0 0 1 1 0 0
Huerfano 7 6 3 2 0 0 0 0 0
Jackson 3 3 0 0 1 0 0 0 0
Jefferson 43 171 9 9 24 7 15 6 10
Kiowa 2 1 1 0 1 0 0 0 0
Colorado Department of Transportation 2022 Problem Identification Statewide Report 44Fatalities in
Occupant crashes where Driver
fatalities, driver/ under 21
unrestrained motorcycle Speeding- Unhelmeted years old in
Performance Serious all seat operator has related motorcyclist Motorcyclist fatal Pedestrian
Measures Fatalities injuries positions BAC ≥ 0.08 fatalities fatalities fatalities crashes fatalities
Colorado ISP
Target 603 3,161 198 184 225 55 103 79 80
Kit Carson 2 2 2 1 1 0 0 0 0
La Plata 5 23 3 4 4 0 0 1 0
Lake 1 4 0 0 1 0 0 1 0
Larimer 32 107 5 7 12 5 8 1 3
Las Animas 1 4 0 0 0 0 0 0 1
Lincoln 5 4 2 0 5 0 0 0 0
Logan 5 6 3 2 2 0 0 0 0
Mesa 13 47 1 5 7 6 7 1 0
Mineral 1 0 0 0 1 0 0 0 0
Moffat 1 2 1 1 1 0 0 1 0
Montezuma 5 10 1 1 1 0 0 1 3
Montrose 6 9 1 2 3 1 2 1 0
Morgan 10 6 7 2 3 0 0 1 2
Otero 3 5 3 0 0 0 0 0 0
Ouray 0 0 0 0 0 0 0 0 0
Park 5 15 1 0 3 0 3 0 0
Phillips 0 0 0 0 0 0 0 0 0
Pitkin 4 7 0 0 1 1 1 0 1
Prowers 1 5 0 0 0 0 0 0 0
Pueblo 24 65 7 5 12 7 9 3 4
Rio Blanco 1 4 0 0 0 0 1 0 0
Rio Grande 0 0 0 0 0 0 0 0 0
Routt 3 11 1 1 1 0 0 0 0
Saguache 3 4 1 0 1 0 0 0 0
San Juan 1 0 0 0 1 0 0 0 0
San Miguel 2 0 1 1 2 0 0 0 0
Sedgwick 0 1 0 0 0 0 0 0 0
Summit 1 8 0 0 1 0 1 0 0
Teller 5 2 1 0 0 0 3 0 0
Washington 5 0 2 0 5 0 0 2 0
Weld 54 107 22 15 21 6 9 7 4
Yuma 4 1 0 0 2 0 0 0 0
Colorado Department of Transportation 2022 Problem Identification Statewide Report 45Colorado Department of Transportation 2022 Problem Identification Statewide Report 46
You can also read