Community Emission Reduction Plan (CERP) Community Steering Committee Meeting #14 - May 16, 2022
←
→
Page content transcription
If your browser does not render page correctly, please read the page content below
Community Emission Reduction Plan (CERP)
Community Steering Committee Meeting #14

                            May 16, 2022
Welcome

2
Today’s Agenda
1. Roll Call
2. Welcome and Timeline Review
3. Approval of April 25, 2022, Meeting Minutes
4. Updates from Ad Hoc Groups
5. Technical Assessment Insights: Part II
6. Environmental Justice Updates
7. Public Comment on Non-agenda Items and Next Steps
3
Timeline: Where are We Today?

4
Approval of April 25, 2022
        Meeting Minutes

5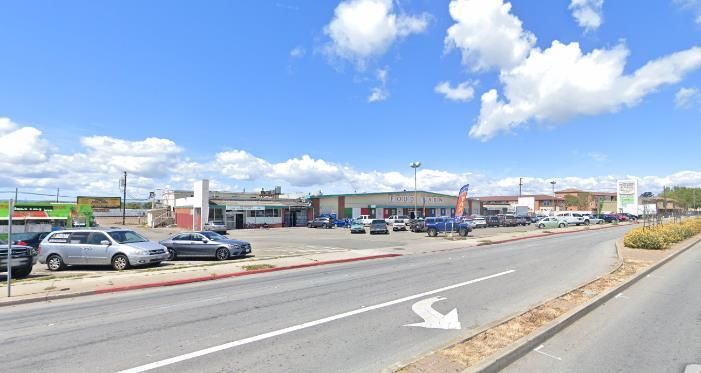
Public Comment

6
Updates from Community Description
and Technical Assessment Ad Hocs

Community Description Ad Hoc co-leads: Nancy Aguirre

Technical Assessment Ad Hoc co-leads: Jeff Kilbreth
Public Comment

8

Technical Assessment Insights: Part II

    Daniel Alrick, Principal Air and Meteorological Monitoring Specialist
    dalrick@baaqmd.gov
    Steve Reid, Senior Advanced Projects Advisor
    sreid@baaqmd.gov

9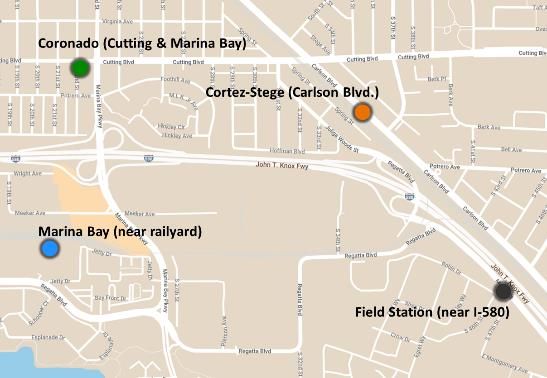
Topics for this Presentation
     • Insights from air quality modeling
        • How can exposure information supplement emissions inventory data?
        • What sources are contributing to the problems?

     • Insights from air quality measurements
        • Higher levels of several pollutants near roadways
        • Higher levels of PM2.5 in and adjacent to industrial areas
        • Examples of shorter-term or recurring air quality impacts

     • Connecting community concerns to strategies
10
Recap: Emissions to Health Effects
Chevron PM2.5 (479 tons/year*)
Sulfur
Boilers, Plants Other
Process 4% 2%
Heaters
11%
Cooling FCCU • Emissions are the first step (CERP =
Towers
16%
48%
Community Emissions Reduction Plan)
• Understanding exposures and health
impacts can help identify and prioritize
Generators
19% strategies to include in the CERP
11 *Includes OGV berthing emissionsCommunity Concerns (1 of 2)
Fuel Refining, Support Industrial and Commercial Vehicles and Trucks, Streets
Facilities, Storage, and Sources Near Communities and Freeways, and Logistics
Distribution
Chevron Permitted sources not included Cars and trucks operating on
Chemtrade under Fuel Refining (e.g., Levin freeways and surface streets
Kinder Morgan Terminal, autobody shops, food (incl. road dust)
Phillips 66 processing facilities)
Warehouses and truck-related
Transmontaigne Construction activities businesses
IMTT
Richmond Products Terminal Restaurants Diesel truck idling and
Qualawash Holdings LLC congestion
Gas Stations
12Community Concerns (2 of 2)
Marine and Rail Odors and Smells Addressing Public Health and
Reducing Exposure
Ocean going vessels Fuel Refining Wildfire smoke
Harbor craft (e.g., tugs) City of Richmond Wastewater Residential wood smoke
Treatment Plant
Ferries Accessible health data
West Contra Costa County
Landfill Sensitive receptor sites
Cargo handling equipment
AAK Oil Incompatible land use
Railyards
development
Rail lines Others (e.g., cannabis growing
and processing)
13Modeled PM2.5 Impacts from Local Sources Annual Average Exposures Concentrations (Concentration x Population) 14
Modeled PM2.5 Impacts
                          Emissions vs. Exposure
                                                   Impacts on Average
                          PM2.5 Emissions       Residential PM2.5 Exposure
                         600                                             0.35
                                                                                                 Why do they differ?
                         500                                             0.30                    • Source release characteristics
                                                                                                   (e.g., low-level vs. high stacks)
                                                Concentrations (µg/m3)
 Emissions (tons/year)

                                                                         0.25
                         400
                                                                         0.20                    • Proximity to emissions sources
                         300
                                                                         0.15                    • Only showing local impacts on
                         200                                                                       PM2.5 exposures (within the
                                                                         0.10
                         100                                             0.05
                                                                                                   PTCA study area)
                           0                                             0.00
                               Chevron   Road                                   Chevron   Road
                                         Dust                                             Dust
15
Modeled Impacts: Source Contributions
Source Contributions to Average Source Contributions to Average Source Contributions to
Residential PM2.5 Exposures Residential Chronic Hazard Index Average Residential Cancer Risk
(stacked bar total = 1.06 µg/m3) (stacked bar total = 0.11) (stacked bar total = 84.3 per million)
100% 100%
0.06 100%
90% 0.01
0.21 90%Vehicles and Trucks
A Closer Look at PM2.5
Source Contributions to Average
Truck Businesses
Residential PM2.5 Exposure & TRUs
1% Truck
100%
0.06 14%
90%
80%
0.21
70%
60% 0.34
50%
Non-Truck
40% 17%
30%
20% 0.46
10%
0%
Marine & Rail Road Dust
Industrial & Commercial 68%
Fuel Refining
Vehicles & Trucks
17Industrial & Commercial Sources
A Closer Look at PM2.5
Source Contributions to Average Other
Residential PM2.5 Exposures permitted Construction
sources 2%
100% 12%
0.06
90%
80%
0.21
70% WCCC Landfill
60% 13%
0.34
50%
40%
30%
20% 0.46 Restaurants
53%
10%
0%
Levin
Marine & Rail Terminal
Industrial & Commercial 20%
Fuel Refining
Vehicles & Trucks
18Fuel Refining
A Closer Look at PM2.5 from the Rule 6-5 Analyses
Disparities in PM2.5 Exposure
• On average, Hispanic/Latino and
African American/Black residents
are exposed to more PM2.5 from
Chevron in all modeled results
• Sources other than the refinery
Fluidized Catalytic Cracking Unit
(FCCU) drive these disparities
• These results include impacts
beyond the PCTA study area (a
larger modeling domain was used
for Rule 6-5)
FCCU impacts shown in darker colors
Bar heights = total impacts (FCCU + Non-FCCU)
19Fuel Refining (cont.)
A Closer Look at Chronic HI
Source Contributions to Average Bio-Reactor Chevron Processes
Residential Chronic Hazard Index Rheniformers 1%
Hydrogen 1% Other
Plant Boilers 6%
100% 0.010 2% 1%
Heat
90% 0.002 Tanks Recovery
0.004
80% 2% Steam
70% 0.032 Generator
Flares 31%
60% 3%
50% Fugitives
40% 4%
30% 0.062
20%
10%
FCCU
0% 23%
Marine & Rail
Sulfur
Industrial & Commercial Recovery Unit
Other Fuel Refining 26%
Chevron
20 Vehicles & TrucksMarine and Rail
A Closer Look at Cancer Risk
OGV Cargo
Source Contributions to Maneuvering Handling
Average Residential Cancer Risk /Transit Equipment
6% 1%
100%
90% OGV Berths
14%
80% 36.4
70% Rail lines
60% 38%
2.3
50% 3.3
40% Ferries
30% 10%
42.6
20%
10%
0%
Marine & Rail
Industrial & Commercial Railyards
Commercial
Fuel Refining Harbor Craft 8%
Vehicles & Trucks 23%
21Marine and Rail (cont.)
Modeled TAC Impacts on a Cancer Risk Scale
Exposures - Marine Exposures - Rail
22Summary of Insights from Modeling Analyses
Chronic Hazard Index
• Chevron and onroad sources (vehicles and trucks) are the key exposure
drivers for TACs with chronic health impacts
• For Chevron, three main processes account for 80% of the facility’s
contribution to exposures:
1. Heat Recovery Steam Generator (key TAC = manganese*)
2. Sulfur Recovery Unit (key TAC = sulfuric acid)
3. Fluidized Catalytic Cracking Unit (key TACs = nickel compounds, hydrogen
cyanide, hydrochloric acid, arsenic)
*Info on key TACs taken from the chronic hazard-weighted emissions inventory (individual TACs not modeled for
23 exposure analyses)Summary of Insights from Modeling Analyses (cont.)
Cancer Risk
• Mobile sources account for 94% of modeled cancer risk in the community
(diesel PM is the key driver)
• Within the Marine & Rail area of concern, rail activities and harbor craft
account for over two-thirds of the modeled cancer risk
• Modeled cancer risk maps show areas with high population density in
close proximity to rail lines (e.g., along Carlson Blvd.)
• Though marine sources are of lesser importance for the community as a
whole, impacts from these sources can be seen in Point Richmond and the
western part of the Iron Triangle
24Summary of Insights from Modeling Analyses (cont.)
PM2.5 Impacts
• PM2.5 concentration maps show impacts from Chevron, WCCC Landfill,
Levin Terminal, and onroad mobile sources (vehicles and trucks)
• Chevron and road dust are the two largest local contributors to annual
average residential PM2.5 exposures (impacts roughly equal)
• Though FCCU emissions will be reduced by Rule 6-5, modeling conducted
for that rule showed that other PM sources at Chevron combined make a
larger contribution to exposure inequities across the Rule 6-5 modeling
domain
• Road dust represents a growing portion of onroad emissions inventories
due to recent reductions in vehicle exhaust emissions; this category is
currently the subject of a study by CARB, Caltrans, and EPA
25Additional Insights from
Air Quality Measurement Data
26Additional Insights from Measurement Data
• Model results can show us annual average concentrations and
residential exposures over the study area, that we can split apart by
each contributing modeled source
• Measurement results can show variations in levels of air pollutants
in time or space (or of different pollutants) that may indicate other
problems not reflected in the modeling results
• Near-source impacts of other pollutants: higher levels of black carbon
and ultrafine particles near roadways
• Spatial variations in pollution: higher levels of PM2.5 near the interface
between industrial and residential areas
• Shorter-duration variations in pollution: examples of short peaks in
concentrations that can impact health too
27Near-Source Impacts of Other Pollutants
On-Road Mobile Sources
28Selected Near-Roadway Pollutants
Main Sources on
Pollutant Description / Examples Notable / Example Health Effects
Roadways
Smaller than 2.5 µm (1/20th the thickness Exhaust from
Fine particulate Asthma development, asthma attacks,
of a human hair). Smaller size makes it gasoline, diesel fuel,
matter (PM2.5) difficulty breathing, bronchitis, heart disease,
easier to inhale & be deposited in lungs. etc., being burned in heart attacks, strokes, neurological (brain)
engines disease, lung cancer, low birth weight, lost
Soot; a component of PM2.5; correlated
Black carbon Brakes & tires days of work and/or school.
with diesel particulate matter (DPM)
wearing down Increased emergency room visits, medicine
Ultrafine particles Road dust being usage, hospital admissions, and premature
Smaller than 0.1 µm. deaths / years of life lost.
(UFP) kicked back up
Some VOCs cause cancer. Many can cause
Gases such as benzene, toluene, Exhaust
Volatile organic eye/nose/throat irritation, headaches, rashes,
ethylbenzene, xylene, formaldehyde. Some
compounds (VOCs) Fuel evaporation nausea, or disorientation, depending on how
are odorless, some not.
much is inhaled.
Family of reactive gases; contributes to Coughing, wheezing, difficulty breathing,
Nitrogen oxides (NOx)
formation of PM2.5 in outdoor air increased asthma & allergy attacks.
Exhaust
Carbon monoxide Harder for blood to carry oxygen; at high
Colorless, odorless gas
(CO) levels (about 100,000 ppb), poisoning
29
More info at https://www.epa.gov/criteria-air-pollutants and https://ww2.arb.ca.gov/resources/california-ambient-air-quality-standardsNear-Road vs. Other Sites: PM2.5
Each line represents a Bay Area air monitoring site
In addition to combustion of
fossil fuels and wood, PM2.5
comes from brake and tire
wear, other non-combustion
sources, and forms through
reactions of other pollutants
At most sites, PM2.5 levels
increase during the morning
commute period
PM2.5 levels at near-road sites
are often, on average, at the
higher end compared to other
sites in the Bay Area
30Near-Road vs. Other Sites: Black Carbon
Each line represents one Bay Area monitoring site
Black carbon is a
component of particulate
matter, emitted by burning
of fossil fuels (traffic and
industrial operations),
wood burning, wildfires
Black carbon levels are,
on average, usually
higher at the near-road
sites, notably so during
the morning commute
period
31Technical Assessment Insights:
On-Road Mobile Sources
• Measurement data show higher levels of several pollutants
that are monitored in near-road locations
• Peak levels of black carbon and ultrafine particles are about
twice as high at the near-road monitors compared to peak
levels at other monitors
• On typical days, levels of several pollutants increase during
the commute hours in most locations
32Spatial Variations in Pollution:
PM2.5 measurements from sensors and mobile
monitoring can indicate places where
concentrations are higher
33Locations with more-frequent Locations with higher average PM2.5
occurrences of higher PM2.5 levels: levels:
Sensor network data (cont.) Aclima mobile monitoring data (cont.)
North of Hilltop
Local ongoing and/or
Parchester, Giant Rd
intermittent sources
may contribute to
North Richmond
North Richmond higher PM2.5 levels in
these areas
Many of these areas
are at the interface of Harbor area, Marina Bay,
industrial areas with Cortez-Stege, Laurel
locations where people Park, Eastshore
reside or spend time
for work or school
Percent of Hours at least 5 µg/m3 Data collected Aug – Oct 2019
Above Sensor Network Average, https://rspreport.aclima.tools/
34
2020-2021Locations with more-frequent Locations with higher average
occurrences of higher PM2.5 levels: PM2.5 levels:
Sensor network data Aclima mobile monitoring data
Traffic,
North of Hilltop restaurants,
different
topography
Parchester, Giant Rd
Warehouses and
truck-related
businesses, rail lines North Richmond
North Richmond
Nearer refinery and related
facilities, warehouses and
truck-related businesses,
scrapyards, rail lines
Harbor area, Marina Bay,
Harbor and industrial Cortez-Stege, Laurel
operations, warehouses and Park, Eastshore
truck-related businesses,
rail lines, traffic
Percent of Hours at least 5 µg/m3 Data collected Aug – Oct 2019
Above Sensor Network Average, https://rspreport.aclima.tools/
35 2020-2021Shorter-duration Variations in Pollution:
Examples of short peaks in PM2.5 levels that can
impact health
36Shorter-Duration Air Quality Events
• Annual average concentrations are important for
estimating chronic exposure to pollution
• Air pollution events with intermittent or recurring high
concentrations at shorter timescales (days, hours,
minutes) can also impact health and quality of life
• Sources behind these events may not be the largest in
terms of total emissions for the area, and some may not
be well characterized in emissions inventories
• Shorter-duration events are in addition to ongoing pollution
from the combination of other local and regional sources
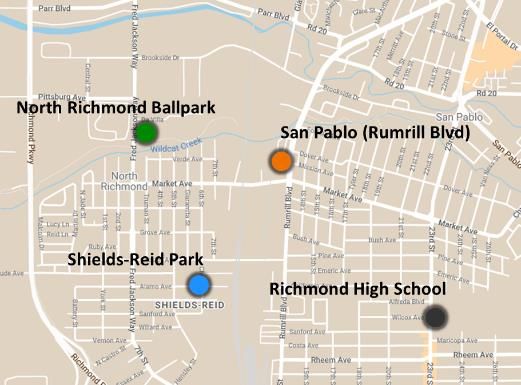
37Higher PM2.5 Levels at San Pablo Monitoring Site
Hourly PM2.5 Levels, April 4-10, 2021 Locations of air quality sensors
(Ramboll/Groundwork Richmond)
San Pablo (Rumrill)
Shields-Reid Park
North Richmond Ballpark
Richmond High School
5.8
8.2
6.7
5.2
Annual averages for 2021 shown under sensor location (µg/m3)
• Occurrences of higher PM2.5 levels at the San Pablo monitoring location on several days
• These higher PM2.5 levels usually occur during the daytime and on weekends, possibly indicating a
38
localized source or sources with certain hours of operationHigher PM2.5 Levels at San Pablo Monitoring Site (cont.)
What’s in this immediate area?
• Traffic (Rumrill Blvd., Market Ave.)
• Railway
• Grocery store, restaurants, food trucks
• Automobile dismantler and other industrial facilities
• Dusty empty lots
Map of area around Rumrill Blvd. and Market Ave.
39 Google Street View of Rumrill Blvd.Higher PM2.5 Levels at San Pablo Monitoring Site (cont.)
These higher PM2.5 levels may be due to food operations,
based on:
• Time periods when the higher levels occur
• Air quality complaint in this area related to food operations
• Proximity of the air monitor to those operations
Map of area around Rumrill Blvd. and Market Ave.
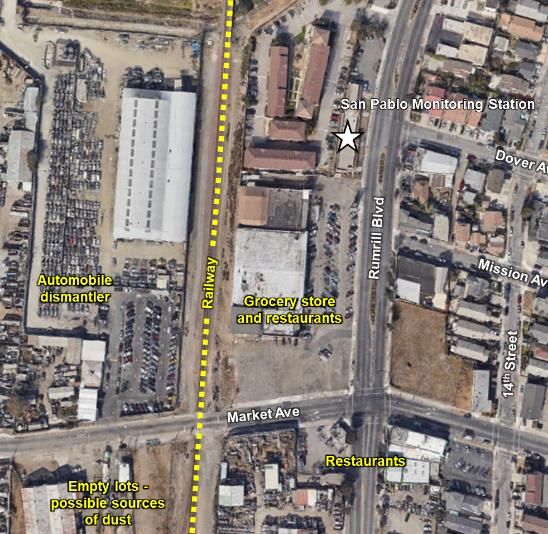
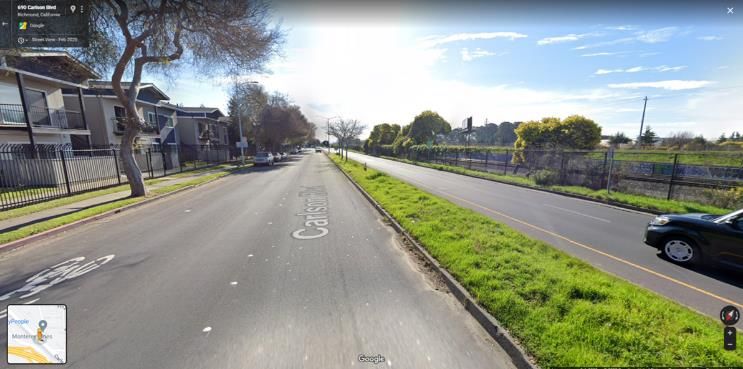
40 Google Street View of Rumrill Blvd.Higher PM2.5 Levels near Carlson Blvd.
Locations of air quality sensors
Hourly PM2.5 Levels, July 21-31, 2020 (Ramboll/Groundwork Richmond)
9.1
10.6
9.4
9.1
Annual averages for 2020 shown under sensor location (µg/m3)
• Sensor along Carlson Blvd. showed frequent occurrences of higher PM2.5 levels compared to
nearby sensors, possibly due to a localized source(s)
• Aclima data also showed higher PM2.5 levels in this area, though sensor data do not continue to
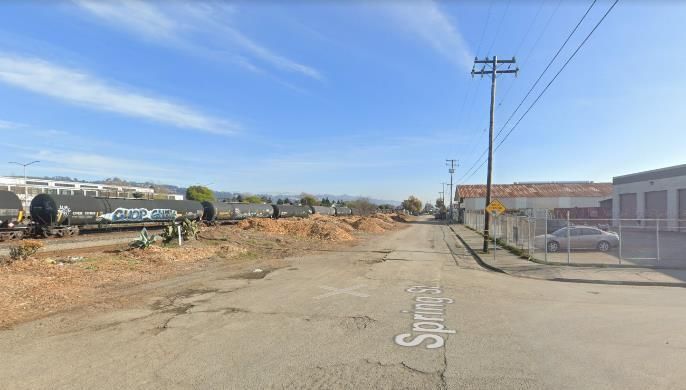
41 show this pattern past Summer 2020Higher PM2.5 Levels near Carlson Blvd. (cont.)
What’s in this area?
• Traffic (Carlson Blvd., I-580)
• Railway (freight and Amtrak)
• Partially unpaved road (Spring Street)
• Various light industrial and commercial
facilities along Spring Street
• Disturbed soil, piles of dirt
Map of area around Carlson Blvd. and Spring St.
42 Google Street View of Spring St.Community Concern: Odors from Industries
• Many air quality complaints are related to odors
• Odors can come from natural sources and from human activities
• While some odors may not be associated with high levels of a
pollutant, they can still affect health and well-being
• Odors also may indicate the presence of other toxic, odorless
pollutants that are emitted at the same time
• The public can report odors and other air quality complaints
• Website: https://www.baaqmd.gov/online-services/air-pollution-complaints
• By phone at 800-334-ODOR (6367)
43Summary of Insights from Measurement Data
• Measurement data show higher levels of several pollutants in
near-road locations, especially black carbon and ultrafine particles
• Spatially dense measurements are possible for some pollutants like
PM, and show several areas with higher concentrations,
especially at the interface between industrial and residential
• Shorter-duration air quality events occur and can also have
impacts on health and well being
• While some shorter-duration examples were highlighted in this
presentation, there are many other locations that are near similar
types of sources and may experience similar impacts
44Community Concerns
Connecting to Strategies
45Connecting to Strategies
Fuel Refining
• Reductions in TAC emissions through the Rule 11-18 process
• Evaluations of opportunities for process-level improvements and controls
Industrial and Commercial Sources Near Communities
• Assess the potential impact of sources not covered by current permits (e.g.,
fugitive dust sources at Pick-n-Pull, coal dust from rail cars)
• Develop or amend District rules (e.g., Rule 6-1 for construction dust or Rule
6-2 for commercial cooking)
• Implement facility-specific controls (e.g., further dust mitigation at Levin
Terminal)
46Connecting to Strategies (cont.)
Mobile Sources
• Control road dust through street sweeping and/or reducing trackout from
construction projects and industrial sites
• Vegetative barriers where rail
lines or roadways pass near
densely populated areas
• Incentive funds to replace
trucks, engines, or equipment
47Steering Committee
Questions and Discussions
48Public Comment 49
Standing Environmental Justice
                Updates

50
Public Comment 51
Next Meeting

     • Our next Steering Committee meeting will be on Monday, June 27th, 2022, from 5:30
       p.m. to 8:00 p.m. Agenda topics will include:
        • Air District Problems to Solutions Presentation #2

52
Public Comment on
Non-Agenda Matters
53You can also read