Community Health
Needs Assessment
  2023-2025
←
→
Page content transcription
If your browser does not render page correctly, please read the page content below

Community Health Needs Assessment 2023-2025
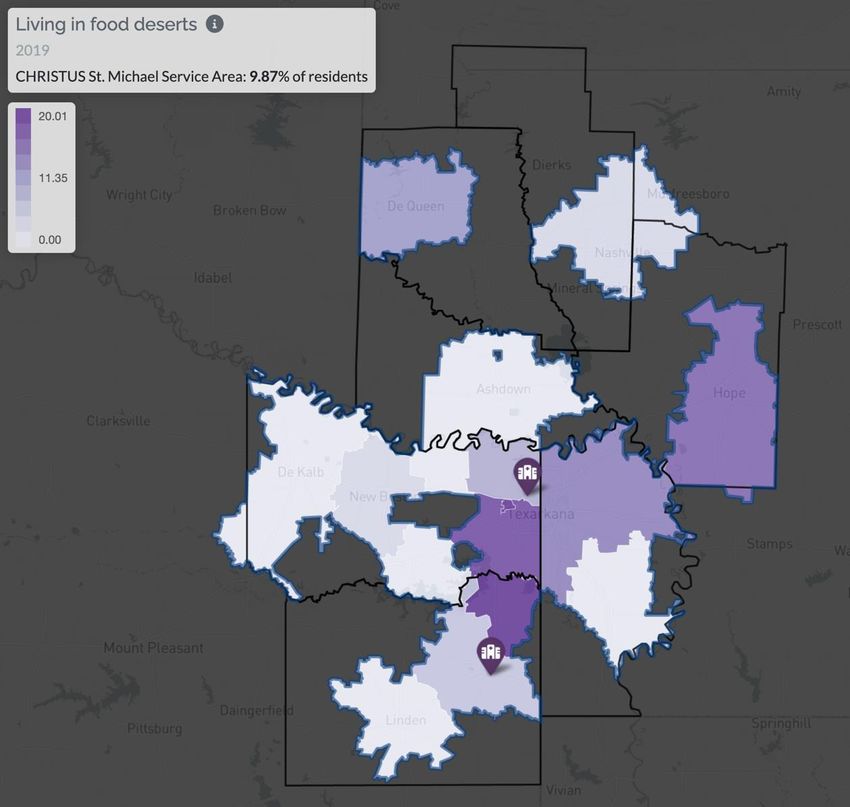
Table of Contents
Executive Summary ............................................................................................................................2
   IRS Form 990, Schedule H Compliance .................................................................................................. 2
   Health Need Priorities .......................................................................................................................... 3
Introduction: What is a Community Health Needs Assessment? ...........................................................4
   CHRISTUS St. Michael Health System Overview ..................................................................................... 5
   Community Benefit .............................................................................................................................. 5
   CHRISTUS St. Michael Health System Service Area ................................................................................ 5
CHNA Process ....................................................................................................................................7
   Stakeholder Engagement ..................................................................................................................... 7
   Data Collection .................................................................................................................................... 8
   Community Resident Surveys ............................................................................................................... 8
   Community Focus Groups and Key Informant Interviews ..................................................................... 10
   Secondary Data.................................................................................................................................. 11
   Data Needs and Limitations................................................................................................................ 12
   Consideration of COVID-19 ................................................................................................................. 13
CHNA Results ................................................................................................................................... 15
   Demographic Characteristics .............................................................................................................. 15
   Overall Community Input ................................................................................................................... 20
   Social and Structural Determinants of Health ...................................................................................... 22
   Access to Care.................................................................................................................................... 30
   Food Access ....................................................................................................................................... 35
   Violence and Community Safety ......................................................................................................... 37
Health Data Analysis ........................................................................................................................ 38
   Health Outcomes: Morbidity and Mortality ........................................................................................ 38
       Chronic Disease .................................................................................................................................................................... 38
       Maternal Health ................................................................................................................................................................... 41
       Mental Health ...................................................................................................................................................................... 42
       Leading Causes of Death ...................................................................................................................................................... 43

   Hospital Utilization ............................................................................................................................ 54
Conclusion ....................................................................................................................................... 57
Appendix 1: Evaluation of Community Health Improvement Plan (CHIP) Activities ............................. 59
Appendix 2: Primary Data Tools ....................................................................................................... 66
Appendix 3: Data Sources ................................................................................................................. 78

                                                                                            1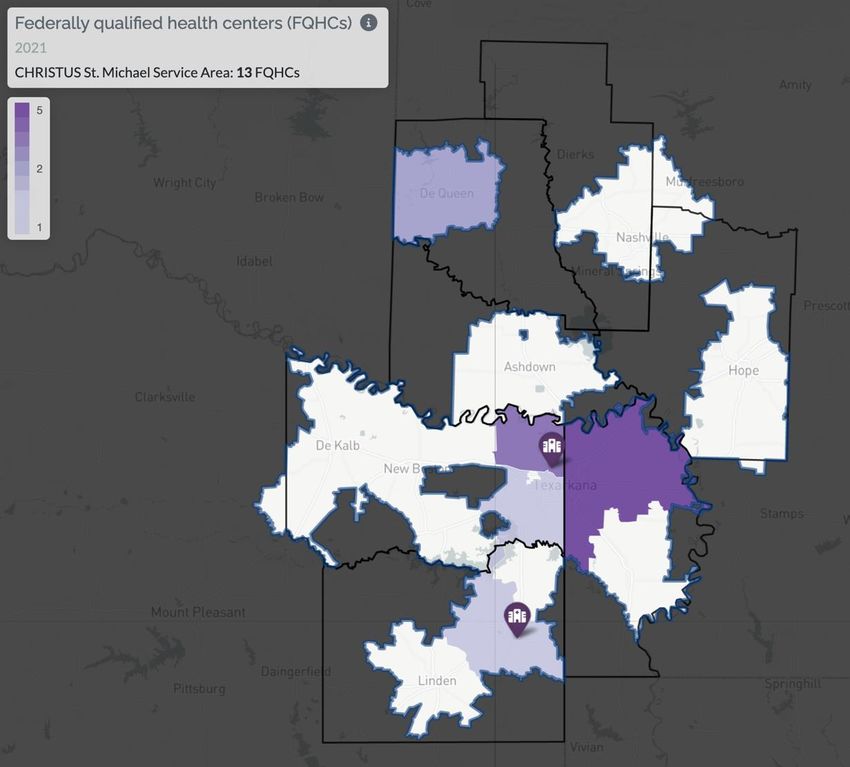
Executive Summary
CHRISTUS St. Michael Health System, which includes St. Michael Health System – Texarkana and
CHRISTUS St. Michael - Atlanta, conducted a Community Health Needs Assessment (CHNA) to
assess the greatest community health needs. The CHNA guides the hospital in selecting priority
health areas and where to commit resources that can most effectively improve community
members’ health and wellness. To complete the 2023-2025 CHNA, CHRISTUS St. Michael Health
System partnered with Metopio, health departments and regional and community-based
organizations. The CHNA process involved engagement with multiple stakeholders to prioritize
health needs. Stakeholders also worked to collect, curate and interpret the data. Stakeholder
groups provided insight and expertise around the indicators to be assessed, types of focus
group questions to be asked to the community, interpretation of results and prioritization of
areas of highest need. Primary data for the CHNA was collected via community input surveys,
resident focus groups and key informant interviews. The process also included an analysis of
secondary data from federal sources, local and state health departments and community-based
organizations.

IRS Form 990, Schedule H Compliance
For non-profit hospitals, a CHNA also serves to satisfy certain requirements of tax reporting,
pursuant to provisions of the Patient Protection & Affordable Care Act of 2010. To understand
which elements of this report relate to those requested as part of hospitals’ reporting on IRS
Form 990 Schedule H, the following table cross-references related sections.

                                                                                                 BEGINS ON
          SECTION                                      DESCRIPTION
                                                                                                   PAGE
 Part V Section B Line 3a   A definition of the community served by the hospital facility            5
 Part V Section B Line 3b   Demographics of the community                                           15
                            Existing health care facilities and resources within the community      30
 Part V Section B Line 3c   that are available to respond to the health needs of the
                            community
 Part V Section B Line 3d   How data was obtained                                                    8
 Part V Section B Line 3e   The significant health needs of the community addressed                  3
                             Primary and chronic disease needs and other health issues of           38
 Part V Section B Line 3f
                            uninsured persons, low-income persons, and minority groups
                            The process for identifying and prioritizing community health            7
 Part V Section B Line 3g
                            needs and services to meet the community health needs
                             The process for consulting with persons representing the               20
 Part V Section B Line 3h
                            community’s interests
                             The impact of any actions taken to address the significant health      59
 Part V Section B Line 3i
                            needs identified in the hospital facility’s prior CHNA(s)

                                                      2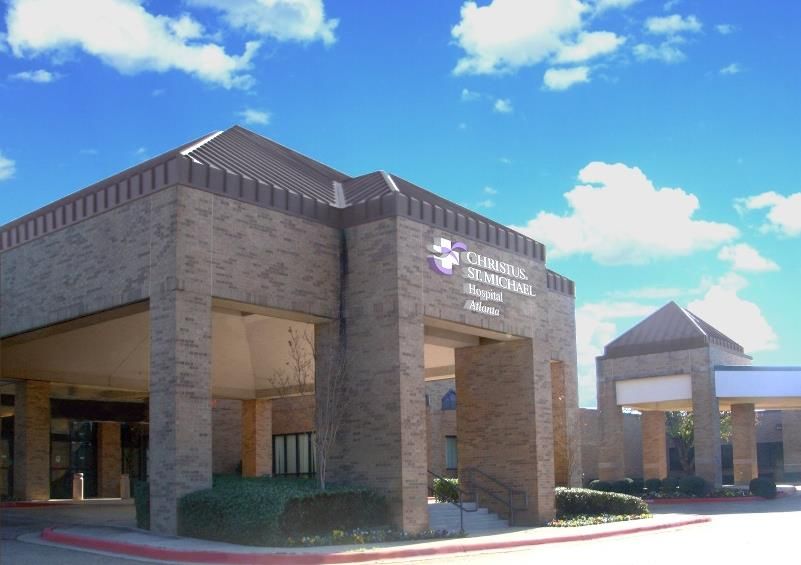
Health Need Priorities
Based on community input and analysis of a myriad of data, the priorities for the communities
served by CHRISTUS St. Michael Health System for Fiscal Years 2023-2025 fall into two domains
underneath an overarching goal of achieving health equity (Figure 1). The two domains and
corresponding health needs are:

1. Advance Health and Wellbeing by addressing
    • Chronic Illness
          o Cancer
          o Heart Disease
          o Diabetes
          o Obesity
    • Behavioral Health
          o Mental Health
          o Substance Abuse
    • Access to Care

2. Build Resilient Communities and Improve Social Determinants by
    • Reducing smoking and vaping
    • Improving employment by building education and training opportunities
    • Improving food access

Figure 1. CHRISTUS St. Michael Health System Priority Areas

This report provides an overview of the CHRISTUS St. Michael Health System process involved in
the CHNA, including data collection methods, sources, and CHRISTUS St. Michael Health System
service area. The body of the report contains results by service area zip codes, or counties when
zip code granularity is not possible, where health needs for the entire service area are assessed.

                                                              3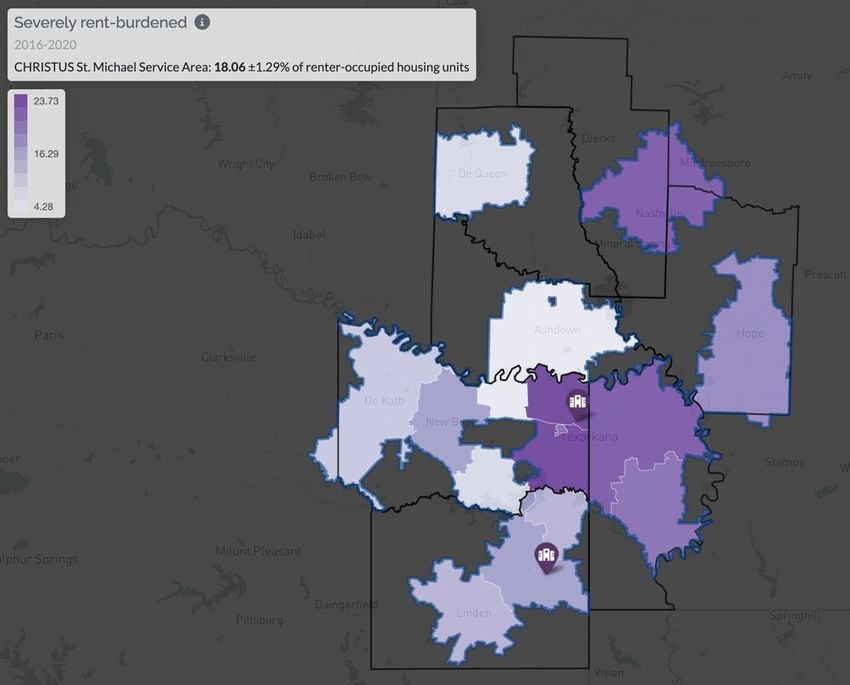
Introduction: What is a Community Health Needs Assessment?
The Community Health Needs Assessment (CHNA) is a systematic, data-driven approach to
determine the health needs in the service area of the CHRISTUS St. Michael Health System. In
this process, CHRISTUS St. Michael Health System directly engages community members and
stakeholders to identify the issues of greatest need as well as the largest impediments to
health. With this information, CHRISTUS St. Michael Health System can better allocate
resources towards efforts to improve community health and wellness.

Directing resources toward the greatest needs in the community is critical to CHRISTUS St.
Michael Health System’s work as a nonprofit hospital. The important work of CHNAs was
codified in the Patient Protection and Affordable Care Act added Section 501(r) to the Internal
Revenue Service Code, which requires nonprofit hospitals, including CHRISTUS St. Michael
Health System, to conduct a CHNA every three years. CHRISTUS St. Michael Health System
completed similar needs assessments in 2013, 2016 and 2019.

The process CHRISTUS St. Michael Health System used was designed to meet federal
requirements and guidelines in Section 501(r), including:
   • clearly defining the community served by the hospital, and ensuring that defined
       community does not exclude low-income, medically underserved, or minority
       populations in proximity to the hospital;
   • providing a clear description of the CHNA process and methods; community health
       needs; collaboration, including with public health experts; and a description of existing
       facilities and resources in the community;
   • receiving input from persons representing the broad needs of the community;
   • documenting community comments on the CHNA and health needs in the community;
       and
   • documenting the CHNA in a written report and making it widely available to the public.

The following report provides an overview of the process used for this CHNA, including data
collection methods and sources, results for CHRISTUS St. Michael Health System’s service area,
historical inequities faced by the residents in the service area and considerations of how COVID-
19 has impacted community needs. A subsequent strategic implementation plan, the
Community Health Improvement Plan (CHIP), will detail the strategies that will be employed to
address the health needs identified in this CHNA.

When assessing the health needs for the entire CHRISTUS St. Michael Health System’s service
area, the CHNA data is presented by zip code and county depending on the available data.
Providing localized data brings to light the differences and similarities within the communities
in the CHRISTUS St. Michael Health System service area.

Included in Appendix 1 is an evaluation of St. Michael Health System’s past efforts to address
the community needs identified in the 2020-2022 CHNA.

                                                4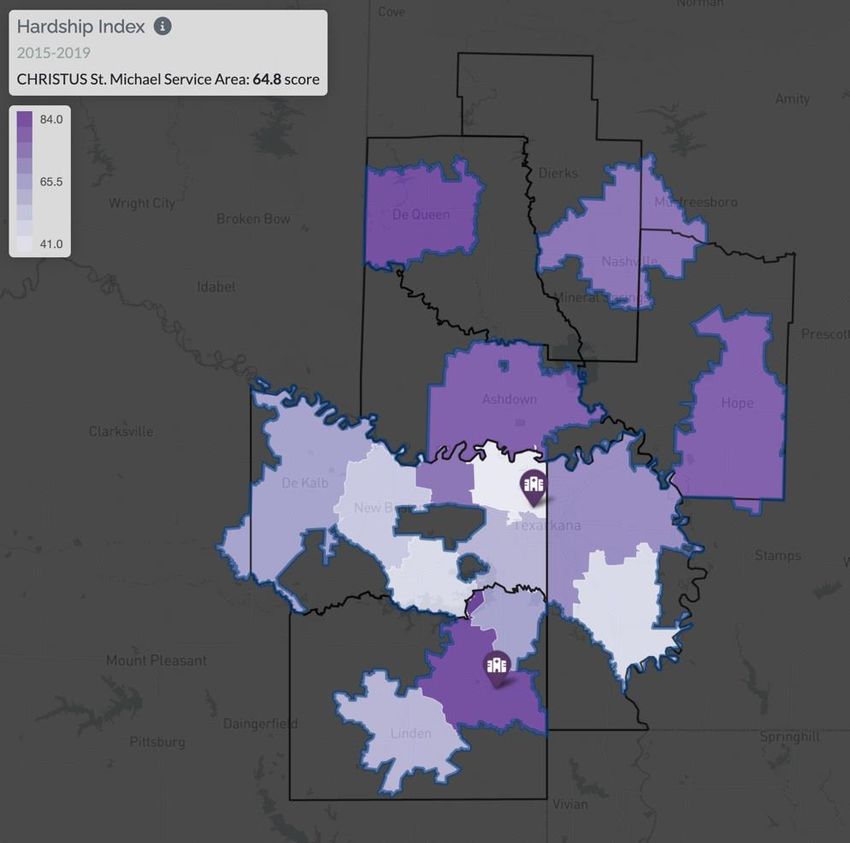
CHRISTUS St. Michael Health System Overview
CHRISTUS St. Michael Health System (CSMHS) is a non-profit hospital system serving the Upper
East Texas and Southwest Arkansas regions and includes two medical centers along with a
number of outpatient centers and medical homes. The CHRISTUS St. Michael Health System
campus in Texarkana includes the main 311-bed acute-care hospital, a 50-bed rehabilitation
hospital, an outpatient rehabilitation center and an outpatient imaging center. The campus was
designed to also address the spiritual needs of our patients by providing a healing environment
of streams, a 1-1/2 acre lake, wooded paths and water features. The CHRISTUS St. Michael
Health System campus in Atlanta has a 43-bed, acute-care hospital providing general and
medical care for inpatient, outpatient and emergency room patients. General and medical
services include radiology, laboratory, respiratory, physical and speech therapy, rehabilitation,
as well as wellness programs. This CHNA covers the service areas for both campuses in the
CHRISTUS St. Michael Health System.

CHRISTUS Health is a Catholic health system formed in 1999 to strengthen the faith-based
health care ministries of the Congregations of the Sisters of the Incarnate Word of Houston and
San Antonio that began in 1866. In 2016, the Sisters of the Holy Family of Nazareth became the
third sponsoring congregation to CHRISTUS Health. Today, CHRISTUS Health operates 25 acute
care hospitals and 92 clinics in Texas. CHRISTUS Health facilities are also located in Louisiana,
Arkansas, and New Mexico. It also has 12 international hospitals in Colombia, Mexico and Chile.
As part of CHRISTUS Health’s mission “to extend the healing ministry of Jesus Christ,” CHRISTUS
St. Michael Health System strives to be, “a leader, a partner, and an advocate in the creation of
innovative health and wellness solutions that improve the lives of individuals and communities
so that all may experience God’s healing presence and love.”

Community Benefit
CHRISTUS St. Michael Health System implements strategies to promote health in the
community and provide equitable care in the hospital. CHRISTUS St. Michael Health System
builds on the assets that are already found in the community and mobilizes individuals and
organizations to come together to work toward health equity.

CHRISTUS St. Michael Health System Service Area
Following IRS guidelines, 501(r) rules as required by the Affordable Care Act, CHRISTUS St.
Michael Health System’s CHNA primary service area includes 16 zip codes covering over
190,000 individuals (Table 1). The primary service area (PSA) is the geographic region with 80%
of hospital utilization. The primary service area zip codes are located in the following counties:
Bowie and Cass in Texas; Hempstead, Howard, Little River, Miller and Sevier in Arkansas (Figure
2).

While the hospital is dedicated to providing exceptional care to all of the residents in East Texas
and Southwest Arkansas, St. Michael Health System will use the information in this assessment
to strategically establish priorities and commit resources to address the key health issues for
the zip codes, counties and municipalities that comprise the region.

                                                 5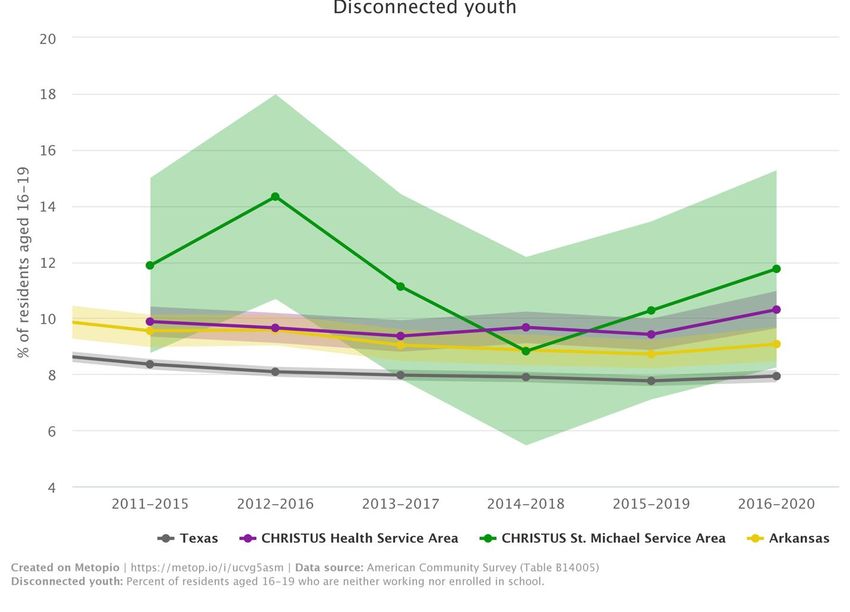
CHRISTUS St. Michael PSA Zip Codes
 Hempstead      Howard      Little River   Miller   Sevier   Bowie         Cass
 County, AR County, AR County, AR County, AR County, AR County, TX      County, TX
 71801        71852        71822         71854    71832    75501       75551
                                         71837             75503       75563
                                                           75559       75572
                                                           75561
                                                           75567
                                                           75569
                                                           75570
Table 1. Primary Service Area of CHRISTUS St. Michael Health System

Figure 2. Primary Service Area of CHRISTUS St. Michael Health System

                                                            6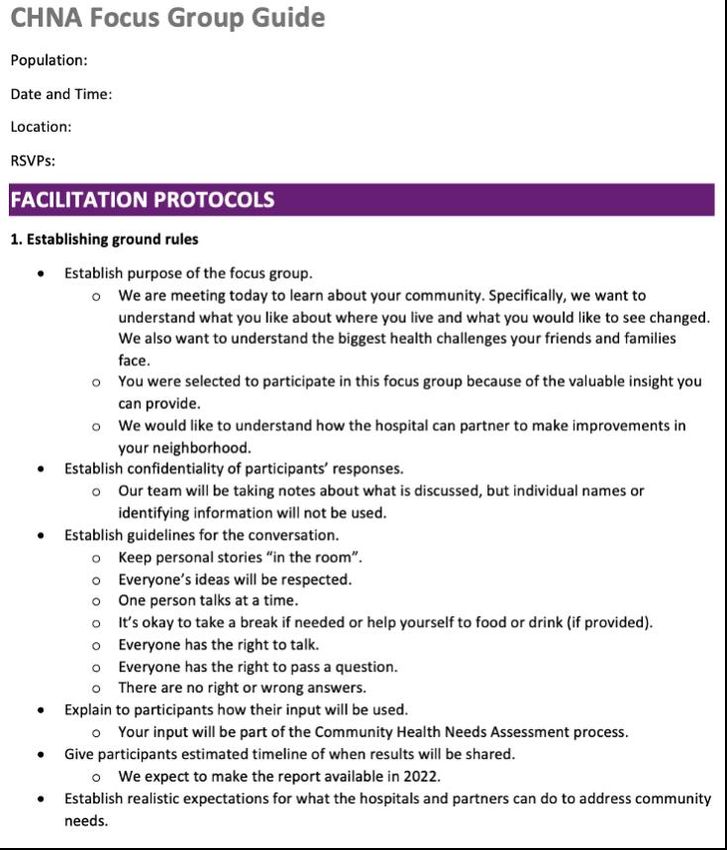
CHNA Process

Stakeholder Engagement
The CHNA process involved engagement with several internal and external stakeholders to
collect, curate and interpret primary and secondary data. That data was then used to prioritize
the health needs of the community. For this component, CHRISTUS St. Michael Health System
worked with Metopio, a software and services company that is grounded in the philosophy that
communities are connected through places and people. Metopio’s tools and visualizations use
data to reveal valuable, interconnected factors that influence outcomes in different locations.

Leaders from the CHRISTUS St. Michael Health System guided the strategic direction of Metopio
through roles on various committees and workgroups.

CHRISTUS St. Michael Health System and Metopio relied on the expertise of community
stakeholders throughout the CHNA process. The health system’s partners and stakeholder
groups provided insight and expertise around the indicators to be assessed, types of focus
group questions to be asked, interpretation of results and prioritization of areas of highest
need.

The Community Benefit Team is composed of key staff with expertise in areas necessary to
capture and report CHRISTUS St. Michael Health System community benefit activities. This
group discusses and validates identified community benefit programs and activities.
Additionally, the team monitors key CHNA policies, provides input on the CHNA
implementation strategies and strategic implementation plan, reviews and approves grant
funding requests, provides feedback on community engagement activities

Input from community stakeholders was also gathered from CHRISTUS St. Michael Health
System’s community partners. These partners played a key role in providing input to the survey
questions, identifying community organizations for focus groups, survey dissemination and
ensuring diverse community voices were heard throughout the process.

The St. Michael Health System leadership team developed parameters for the 2023-2025 CHNA
process that help drive the work. These parameters ensure that:
   ● the CHNA builds on the prior CHNA from 2020-2022 as well as other local assessments
        and plans;
   ● the CHNA will provide greater insight into community health needs and strategies for
        ongoing community health priorities;
   ● the CHNA leverages expertise of community residents and includes a broad range of
        sectors and voices that are disproportionately affected by health inequities;
   ● the CHNA provides an overview of community health status and highlights data related
        to health inequities;
   ● the CHNA informs strategies related to connections between community and clinical
        sectors, anchor institution efforts, policy change, and community partnerships; and

                                                7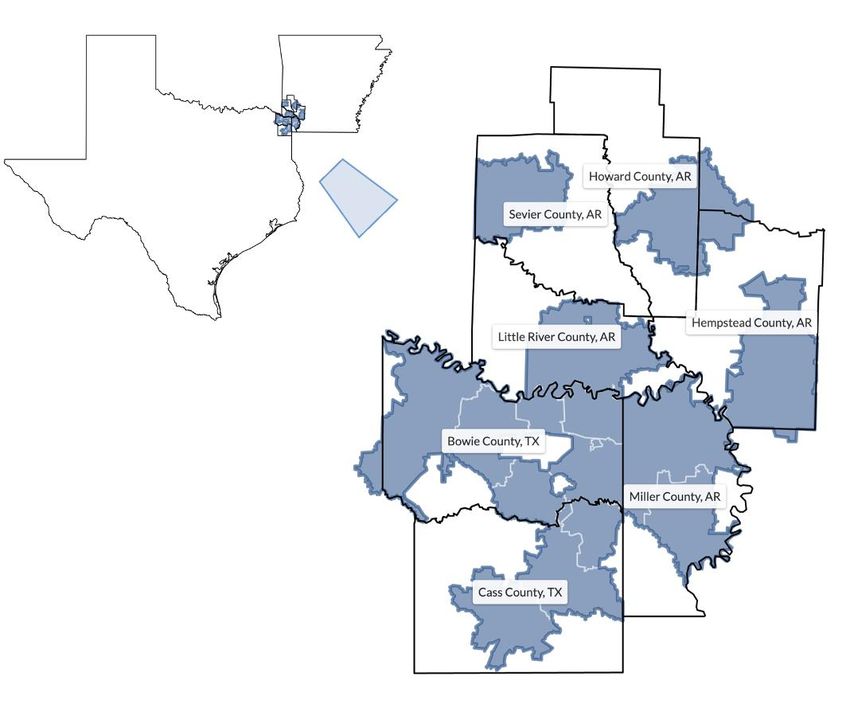
● Health inequities and their underlying root causes are highlighted and discussed
     throughout the assessment.

Data Collection
CHRISTUS St. Michael Health System conducted its CHNA process between September 2021
and March 2022 using an adapted process from the Mobilizing for Action through Planning and
Partnerships (MAPP) framework. This planning framework is one of the most widely used for
CHNAs. It focuses on community engagement, partnership development and seeking channels
to engage people who have often not been part of decision-making processes. The MAPP
framework was developed in 2001 by the National Association for County and City Health
Officials (NACCHO) and the Centers for Disease Control and Prevention (CDC).

Primary data for the CHNA was collected through four channels:
    ● Community resident surveys
    ● Community resident focus groups
    ● Health care and social service provider focus groups
    ● Key informant interviews

Secondary data for the CHNA were aggregated on Metopio’s data platform and included:
   ● Hospital utilization data
   ● Secondary sources including, but not limited to, the American Community Survey, the
      Decennial Census, the Centers for Disease Control, the Environmental Protection
      Agency, Housing and Urban Development and the Texas Department of State Health
      Services

Community Resident Surveys
Between October and December of 2021, 330 residents in the CHRISTUS St. Michael Health
System PSA provided input to the CHNA process by completing a community resident survey.
The survey was available online and in paper form in English and Spanish. Survey dissemination
happened through multiple channels led by CHRISTUS St. Michael Health System and its
community partners. The survey sought input from priority populations in the CHRISTUS St.
Michael Health System PSA that are typically underrepresented in assessment processes,
including communities of color, immigrants, persons with disabilities, and low-income
residents. The survey was designed to collect information regarding:
    ● Demographics of respondents
    ● Health needs of the community for different age groups
    ● Perception of community strengths
    ● Utilization and perception of local health services

The survey was based on a design used extensively for CHNAs and by public health agencies
across the country. The final survey included 26 questions. The full community resident survey
is included in Appendix 2. Table 2 summarizes the demographics of survey respondents in the
CHRISTUS St. Michael Health System PSA.

                                               8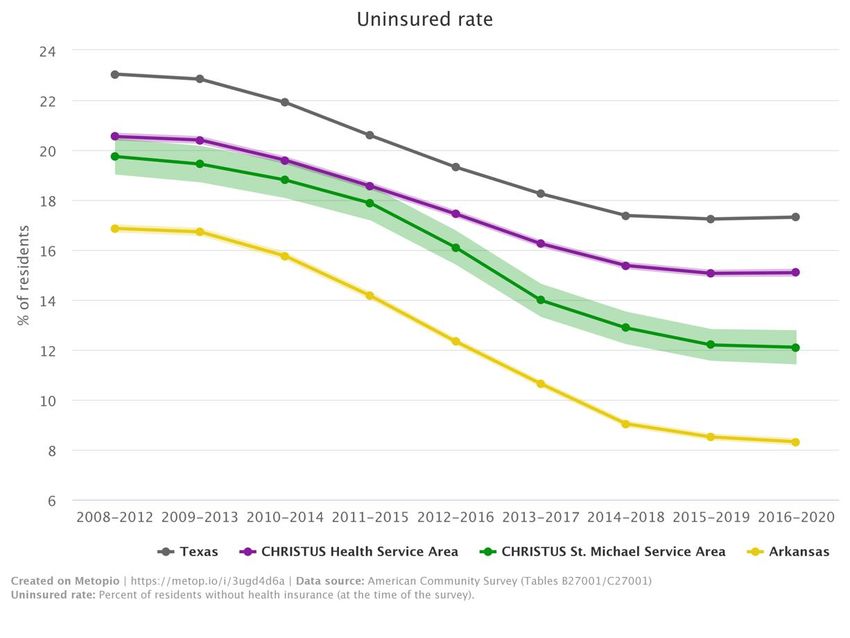
Demographic                               %
Age (N=316)
   18-24                                  0.1
   25-44                                  25.0
   45-64                                  54.6
   65 and older                           20.3
Gender (N=315)
   Male                                   19.8
   Female                                 79.1
   Choose not to answer                   1.1
Orientation (N=315)
   Straight or heterosexual               94.0
   Bisexual                               0.9
   Lesbian or gay or homosexual           1.4
   Choose not to disclose                 3.2
   Other                                  0.5
Race (N=314 (multiple answers allowed))
   American Indian or Alaska Native       3.8
   Asian                                  0.9
   Black or African American              11.4
   White                                  79.1
   Hispanic/Latino(a)                     2.8
   Native Hawaiian or Pacific Islander    0.2
   Choose to not disclose                 6.6
Education (N=316)
   Some high school                       1.4
   High school graduate or GED            9.3
   Vocational or technical school         21.3
   Some college, no degree                7.4
   College graduate                       33.7
   Advanced degree                        26.9
Current Living Arrangements (N=315)
   Own my home                            77.7
   Rent my home                           17.2
   Living with a friend or family         4.2
   Other                                  0.9
Disability in Household (N=313)           30.5
Income (N=309)
   Less than $10,000                      3.9
   $10,000 to $19,999                     6.8
   $20,000 to $39,999                     16.1
   $40,000 to $59,999                     14.6

                                    9
$60,000 to $79,999 15.6
$80,000 to $99,999 12.2
Over $100,000 30.8
Average Number of Children in Home (#) (N=462) 0.6
Table 2. Demographics of Community Resident Survey Respondents in CHRISTUS St. Michael Health System Communities
Community Focus Groups and Key Informant Interviews
A critical part of robust, primary data collection for the CHNA involved speaking directly to
community members, partners and leaders that live in and/or work in the CHRISTUS St. Michael
Health System PSA. This was done through focus groups and key informant interviews.
During this CHNA, CHRISTUS St. Michael Health System held two local focus groups in CHRISTUS
St. Michael Health System, one covering Adult Health and the other Maternal and Child Health,
and joined two systemwide focus groups. All focus groups were coordinated by CHRISTUS St.
Michael Health System and the CHRISTUS Health system office and facilitated by Metopio.
CHRISTUS St. Michael Health System sought to ensure groups included a broad range of
individuals from underrepresented, priority populations in the CHRISTUS St. Michael Health
System. Focus group health topic areas are listed below:
• Adult health
• Maternal and child health
• Health care and social service providers
• Behavioral health
CHRISTUS St. Michael Health System conducted its focus groups in person. Focus groups lasted
90 minutes and had up to 15 community members participate in each group. The following
community members participated in the focus groups:
Organization Role
National Association for the Advancement of Colored
Board President
People (NAACP)
Veterans Community Volunteer
Ark-Tex Council of Governments Transportation Planner
The Scholars Board President
Tough Cookie (Cancer Support) Cancer Survivor/Retired Educator
Area Agency on Aging Care Coordinator
Alpha Kappa Alpha Sorority, Kappa Xi Omega Chapter Sorority Member, Registered Nurse
Alpha Kappa Alpha Sorority, Kappa Xi Omega Chapter Sorority Member/Community Volunteer
Community Health Core Substance Abuse Counselor
CHRISTUS St. Michael Health System Director, Registered Nurse
CHRISTUS St. Michael Health System Director, Registered Nurse
10CHRISTUS St. Michael Health System Physician
CHRISTUS St. Michael Health System Registered Nurse
CHRISTUS St. Michael Health System Registered Nurse
CHRISTUS St. Michael Health System Registered Nurse
CHRISTUS St. Michael Health System Mobile Health, Nurse Practitioner
Support Group for infant demise Community Volunteer
Support Group for infant demise Community Volunteer
Bereavement Group for loss of children Community Volunteer
Table 3. Focus Group Participants
In addition to the focus groups, 10 key informants were identified by CHRISTUS St. Michael
Health System Management team for one-on-one interviews. Key informants were chosen
based on areas of expertise to further validate themes that emerged in the surveys and focus
groups. Each interview was conducted virtually and lasted 30 minutes.
Secondary Data
CHRISTUS St. Michael Health System used a common set of health indicators to understand the
prevalence of morbidity and mortality in the CHRISTUS St. Michael Health System PSA and
compare them to benchmark regions at the state and the full CHRISTUS Health service area.
Building on previous CHNA work, these measures have been adapted from the County Health
Rankings MAPP framework (Figure 3). Where possible, CHRISTUS St. Michael Health System
used data with stratifications so that health inequities could be explored and better articulated.
Given the community input on economic conditions and community safety, CHRISTUS St.
Michael Health System sought more granular datasets to illustrate hardship. A full list of data
sources can be found in Appendix 3.
11Figure 3. Illustration of the County Health Rankings MAPP Framework
Data Needs and Limitations
CHRISTUS St. Michael Health System and Metopio made substantial efforts to comprehensively
collect, review and analyze primary and secondary data. However, there are limitations to
consider when reviewing CHNA findings.
• Population health and demographic data are often delayed in their release, so data are
presented for the most recent years available for any given data source.
● Variability in the geographic level at which data sets are available (ranging from census
tract to statewide or national geographies) presents an issue, particularly when
comparing similar indicators and collected at disparate geographic levels. Whenever
possible, the most relevant localized data are reported.
● Due to variations in geographic boundaries, population sizes and data collection
techniques for suburban and city communities, some datasets are not available for the
same time spans or at the same level of localization throughout the county.
● Gaps and limitations persist in data systems for certain community health issues such as
mental health and substance use disorders (youth and adults), crime reporting,
environmental health, and education outcomes. Additionally, these data are often
12collected and reported from a deficit-based framework that focuses on needs and
problems in a community, rather than assets and strengths. A deficit-based framework
contributes to systemic bias that presents a limited view on a community’s potential.
With this in mind, CHRISTUS St. Michael Health System, Metopio and all stakeholders were
deliberate in discussing these limitations throughout the development of the CHNA and
selection of the 2023-2025 health priority areas.
Consideration of COVID-19
The COVID-19 pandemic touched all aspects of life for two of the last three years, which begs
the question—should COVID-19 be considered its own health issue, or did it merely expose
existing health inequities in the community?
The CHRISTUS St. Michael Health System PSA has
experienced fluctuations in case rates and case fatality “Mental health is a right
rates but was especially hard hit during the Delta surge now need because of the
in 2021. While causal factors are hard to pinpoint, pandemic. Free mental help
several important determinants of health are more should be available when
pronounced in the CHRISTUS St. Michael Health System
PSA including a lack of access to care, higher rates of people need it, not when
chronic disease and a lack of transportation options. they just happen to be
These vulnerabilities certainly exacerbated the spread available for an
and impact of COVID-19. appointment.”
As demonstrated in the survey results in Table 4, a -Survey Respondent
majority of respondents saw the pandemic as the
biggest issue their community faced over the last two
years. And while many community members did not delay care, over half did experience
challenges with feelings of hopelessness and depression. The community’s major emphasis in
focus groups and key informant interviews was on addressing the barriers to health equity, not
necessarily the pandemic itself. Because of this, the CHNA will focus more on COVID-19’s
impact on existing health disparities.
13During the pandemic (March 2020-present) have you had any of the % of
following (please check all that apply): respondents
Visited a doctor for a routine checkup or physical 85.3
Dental exam 67.2
Mammogram 46.1
Pap test/Pap smear 32.4
Sigmoidoscopy or colonoscopy to test for colorectal cancer 14.2
Flu shot 58.3
Prostate screening 4.4
COVID-19 vaccine 71.1
Because of the pandemic, did you delay or avoid medical care?
Yes 34.7
No 65.3
During this time period, how often have you been bothered by feeling
down, depressed, or hopeless?
Not at all 47.2
Several days every month 39.2
More than half the days every month 8.5
Nearly every day 5.2
What is the most difficult issue your community has faced during this time period?
COVID-19 75.7
Natural disasters (for example, hurricanes, flooding, tornadoes, fires) 2.4
Extreme temperatures (for example, snowstorm of 2021) 10.2
Other: 11.7
N=306
Table 4. Community Resident Survey Responses to COVID-19 Questions
14CHNA Results
Demographic Characteristics
Over the past decade, the CSMHS PSA has experienced a change in population. Changes
between the 2010 and 2020 Census show that the population in the PSA decreased by 2.3%
over this period. The entire CHRISTUS Health service area had a somewhat larger growth rate of
12.3%, Texas had a growth rate of 15.9%, and Arkansas experienced a slight increase of 3.3%
(Figure 4). In this report, the CHRISTUS Health service area refers to the geographic area that
encompasses all primary service areas of CHRISTUS Health hospital systems in New Mexico,
Texas, Louisiana and Arkansas. Currently, 192,516 people live in the CSMHS PSA.
Figure 4. Change in Population in the CHRISTUS St. Michael Health System PSA
15As illustrated in Figure 5, Non-Hispanic White individuals make up the majority of the CHRISTUS
St. Michael Health System PSA population at 63.3%. Non-Hispanic Black people represent the
second most populous racial/ethnic group in the PSA, comprising 23.6% of the population,
which is higher than all other benchmark regions. Hispanic or Latino people make up 9.3% of
the PSA population. 2.0% of the population identifies as two or more races. Asian or Pacific
Islander individuals account for 0.86% of the population. Native Americans make up 0.75% of
the population in the CHRISTUS St. Michael Health System PSA.
Figure 5. Demographics by Race/Ethnicity in the CHRISTUS St. Michael Health System PSA
16Females represent 50.6% of the CHRISTUS St. Michael Health System PSA population and males
represent 49.4% (Figure 6). This ratio is similar to the other benchmarks in the chart above. As
outlined in Figure 7, the median age in the CHRISTUS St. Michael Health System PSA is 39.4
years old, which is slightly higher than the entire CHRISTUS Health service area (36.3 years old),
Texas overall (34.8 years old) and Arkansas (38.3 years old).
Figure 6. Demographics by Sex in the CHRISTUS St. Michael Health System PSA
Figure 7. Median Age in the CHRISTUS St. Michael Health System PSA
17In the CHRISTUS St. Michael Health System PSA, only 1.67% of residents have limited English
proficiency. As demonstrated in Figure 8, this is much lower than the entire CHRISTUS Health
service area (4.0%) and Texas overall (7.0%), but somewhat higher than the average in Arkansas
(1.6%). The households with limited English proficiency are primarily concentrated in 71832
(10.9%) (Figure 9).
Figure 8. Limited English Proficiency in the CHRISTUS St. Michael Health System PSA
Source: American Community
Survey (Table B16004)
Figure 9. Map of Limited English Proficiency in the CHRISTUS St. Michael Health System PSA
18As shown in Figure 10, the percentage of residents with a disability in the CSMHS PSA (15.1% of
residents) is slightly higher than the entire CHRISTUS Health service area (14.8%) and Texas
(11.5%), and only lower than Arkansas (17.6%). Disability here is defined as one or more
sensory disabilities or difficulties with everyday tasks.
Figure 10. Disability in the CHRISTUS St. Michael Health System PSA
19Overall Community Input
Community residents who participated in focus groups, key informant interviews and the
survey provided in-depth input about how specific health conditions impact community and
individual health. Cross-cutting themes that emerged included:
• Access to care was a major issue that came up across the focus groups. Participants
shared that access in particularly difficult for elderly, children and the working poor
because of high costs. They also expressed a need for more physicians of color to care
for diverse residents who are underserved and disproportionately affected by chronic
health issues.
• Focus group participants shared that there is a need for mental health care in the PSA.
Current mental health services do not meet the growing need. There is also a cultural
stigma prevents some communities from seeking care. Specific mental health needs
include services for homeless people and addiction services.
• Economic opportunity and poverty came up as an area of need. Participants expressed a
need for more job training services, as well as medication and utility assistance to help
residents get back on their feet after experiencing hardship and to prevent
homelessness.
• Elements of the built environment make it difficult to be healthy. There are limited
affordable options for affordable transportation and housing. Participants reported that
public space, such as sidewalks and parks, is not available in low-income neighborhoods,
making it difficult to exercise outside.
Survey respondents were asked to rank a number of health issues on a scale of 1 to 5, with 1
being “not significant” and 5 being “very significant.” Table 5 shows the top 10 issues from the
survey in descending order.
% of respondents who ranked
Health Issue either 4 or 5
Obesity 64.2%
Mental health 50.9%
Drug, alcohol, and substance abuse 50.6%
Smoking and vaping 49.0%
Heart disease 48.8%
Cancer(s) 48.6%
Diabetes 47.7%
Chronic pain 47.6%
Exercise and physical activity 33.2%
Healthy eating 32.7%
Table 5. Ranking of Health Issues by Survey Respondents
20The primary data covered many health issues that community members see in the PSA, but
data collection also included strengths that residents see in the community. Focus group
participants and key informants shared potential that they see in expanding local farming
initiatives to meet food insecurity needs and build community.
Additionally, survey respondents were asked to select all things which they thought contributed
to health and were available in the community (Figure 11). These represent the assets that
community members take advantage of to maintain their health during challenging times.
0.0 10.0 20.0 30.0 40.0 50.0 60.0
Religion or spirituality
Good schools
Fitness (gyms, places to work out)
Parks and recreation
Cancer screening
Access to health care
Technology (internet, email, social media)
Community services
Strong family life
Clean environment and healthy air
Affordable and healthy food
Transportation
Health support services
Arts and cultural events
Inclusive and equal care for all people
Racial equity
Medication assistance
Affordable housing
Mental health services
Safety and low crime
Quality jobs and workforce development
Affordable childcare
Welcoming community
Life skill training
Figure 11. Survey Responses of Community Strengths that Support Health
21Social and Structural Determinants of Health “We have enough empty
Community residents who participated in focus groups and
the community resident surveys also provided in-depth
lots around here. Why can't
input about how social and structural determinants of we start community
health – such as education, economic inequities, housing, gardens? It would help with
food access, access to community services and resources, food, exercise and people
and community safety and violence – impact community would get to know each
and individual health. The following sections review
other which might cut down
secondary data insights that measure the social and
structural determinants of health. on tension.”
- Survey participant
Hardship
One way to measure overall economic distress in a place is with the Hardship Index. This is a
composite score reflecting hardship in the community, where the higher values indicate greater
hardship. It incorporates unemployment, age dependency, education, per capita income,
crowded housing and poverty into a single score. The Hardship Index score for the CSMHS PSA
is 64.8, which is higher than the measure of the full CHRISTUS Health service area (60.1), Texas
(55.8) and Arkansas (59.0). There are several zip codes throughout the PSA with a high hardship
index score. The highest zip codes include 71832 (84.0) and 75551 (79.6) (Figure 12).
Source: American Community Survey
Figure 12. Map of Hardship in CHRISTUS St. Michael Health System PSA
22Poverty
Poverty and its corollary effects are present throughout the CSMHS PSA. The median household
income is $52,593 and the poverty rate is 18.3% (Figure 13; Figure 14). In comparison, the
overall CHRISTUS Health service area has a median household income of $58,813 and 16.8% of
residents live in poverty; in Texas, $67,267 and 16.7%; and in Arkansas, $52,143 and 16.1%,
respectively (Figures 13; Figure 14). Within the PSA, Non-Hispanic Black and Hispanic/Latino
people disproportionately face the burden of poverty with 29.8% and 22.2% of the respective
populations living in poverty. The effects of poverty can be felt by high housing costs,
represented below as the percentage of households spending more than 50% of their income
on rent. The highest rent burden is seen in zip codes 75503 (23.7%) and 75501 (21.6%),
compared to the average of 18.1% in the CSMHS PSA (Figure 15).
Figure 13. Poverty Rate with Stratifications in the CHRISTUS St. Michael Health System PSA
23Figure 14. Median Household Income in the CHRISTUS St. Michael Health System PSA
Source: American Community Survey (Table B25070)
Figure 15. Housing Cost Burden in the CHRISTUS St. Michael Health System PSA
24Unemployment
As shown in Figure 16, the overall unemployment rate in the CSMHS PSA (6.22%) is higher than
the rate of the entire CHRISTUS Health service area (5.9%), Texas (5.3%) and Arkansas (5.2%).
When this data is stratified by race/ethnicity, there are some disparities in unemployment
rates. In particular, Non-Hispanic Blacks (9.3%) have higher rates of unemployment than the
overall population. Hispanic/Latino people experience the second highest unemployment
burden at 7.5% of the population (Figure 17). Over the past decade, the region has generally
seen a decline in the unemployment rate, even into 2020, the year that the COVID-19 pandemic
began.
Figure 16. Unemployment Rate in the CHRISTUS St. Michael Health System PSA
25Figure 17. Unemployment Rate with Stratifications in the CHRISTUS St. Michael Health System PSA
Table 6. Economic Indicators by County in the CHRISTUS St. Michael Health System PSA
26Another measure of potential economic stress is disconnected youth, defined as residents aged
16-19 who are neither in school nor employed. This measure in the CSMHS PSA (11.8%) is the
similar to the whole CHRISTUS Health service area (10.3%), but slightly higher than both Texas
(7.9%) and Arkansas (9.1%) (Figure 18).
Figure 18. Disconnected Youth in the CHRISTUS St. Michael Health System PSA
Education
Education is an important social determinant of health. Even enrollment in preschool influences
future health and social outcomes. As shown in Figure 19, preschool enrollment in the CSMHS
PSA (45.2% of toddlers) is in line with rate of Arkansas (47.9%) and just above the rate in the
entire CHRISTUS Health service area (42.9%) and Texas (42.7%). The high school graduation in
the CSMHS PSA is 87.1%, which is in line with averages of the full CHRISTUS Health service area,
Texas and Arkansas (84.7%, 84.4%, and 87.2% respectively) (Figure 20). Within the PSA, there is
some inequity in high school graduate rates for Hispanic and Latinos (63.2%) when compared to
the overall population and other racial/ethnic groups. Post-secondary education in the PSA is
lower that of the region overall. For residents 25 or older with any post-secondary education,
the higher degree graduation rate in the CSMHS PSA is 27.2% compared to 31.7% in the
CHRISTUS Health service area, 38.1% in Texas and 31.3% in Arkansas (Figure 21).
27Figure 19. Pre-School Enrollment in the CHRISTUS St. Michael Health System PSA
Figure 20. High School Graduation Rate with Stratifications in the CHRISTUS St. Michael Health System PSA
28Figure 21. Higher Degree Graduation Rate in the CHRISTUS St. Michael Health System PSA
Table 7. Education Indicators by County in the CHRISTUS St. Michael Health System PSA
29Access to Care
Being able to reliably access the health system, “I struggle with mental illness.
whether for primary care, mental health, or My husband has COPD and
specialists, is often dependent on one’s insurance. serious heart problems. My
As shown in Figure 22, the percentage of residents father had dementia. There is
covered by Medicaid in the CSMHS PSA (24.5%) is
higher than that of Texas (16.5%) and the full
little support in the community.
CHRISTUS Health service area (21.1%) but is almost It is overwhelming to be a
the same rate as Arkansas (26.4%). caregiver.”
- Survey Participant
Figure 22. Medicaid Coverage in the CHRISTUS St. Michael Health System PSA
30Figure 23. Uninsured Rate in the CHRISTUS St. Michael Health System PSA
Figure 24. Uninsured Rate with Stratifications in the CHRISTUS St. Michael Health System PSA
31The uninsured rate in the CHRISTUS St. Michael Health System PSA (11.9%) is lower than the
full CHRISTUS Health service area (15.1%) and Texas (17.3%) but higher than the rate in
Arkansas (8.3%) (Figure 23). However, it is much higher in the Hispanic or Latino population
(23.5%) (Figure 24). Additionally, there is a high uninsured rate for Native Americans (19.6%),
but it should be noted that this data has a high margin of error because of the small Native
American population in the PSA (Figure 24).
As illustrated in Figures 22 and 23, Arkansas has had the sharpest increase in Medicaid coverage
and decline in uninsured rates over the past few years. In the most recent reporting period,
only 8.3% of the population was uninsured. This may be related to the expansion of Medicaid in
that Arkansas. Texas, which has not approved Medicaid expansion, has the highest uninsured
rate amongst benchmark regions (17.3%).
Overall, nearly 40% of residents in the CSMHS service area are either uninsured or have limited
coverage through Medicaid. As demonstrated in Figure 24, the uninsured rate is highest for
Hispanic or Latinos in the service area (20.8% of Hispanics or Latinos are uninsured) and for
Native Americans (21.3%).
Mental health was raised as an issue through all channels of primary data collection. Many
residents noted a lack of access to providers, regardless of a person’s insurance. Table 8 shows
the per capita rate for types of mental health providers compared to the full CHRISTUS service
area and Texas. The PSA has a much smaller number of mental health providers per capita for
all three provider categories compared to the other benchmark regions.
Table 8. Access to Mental Health Providers in the CHRISTUS St. Michael Health System PSA
32Many low-income residents in the CSMHS PSA rely on Federally Qualified Health Centers
(FQHCs) for their care in addition to hospitals, outpatient centers and primary care offices.
FQHCs are defined based on number of federally qualified health centers, community-based
organizations recognized by the Centers for Medicare and Medicaid Services that provide
comprehensive primary and preventative care to medically underserved areas and populations,
regardless of the ability to pay. There are 13 FQHCs spread across the PSA. As shown in Figure
25, most are concentrated in zip code 71854 (5 FQHCs).
Source: Centers for Medicare & Medicaid Services
Figure 25. Heat Map of FQHC locations in the CHRISTUS St. Michael Health System PSA
Despite the specific access issues listed above, residents in the PSA are still able to receive
regular primary care. In 2019, 76.6% of adults in the CHRISTUS St. Michael Health System PSA,
aged 18 and older, report having been to a doctor for a routine checkup (e.g., a general physical
exam, not an exam for a specific injury, illness, condition) in the previous year (Figure 26). This
is in line with the rates for the rest of the CHRISTUS service area (74.3%), Texas (72.6%) and
Arkansas (77.6%) (Figure 26).
33Figure 26. Regular Doctors' Visits in the CHRISTUS St. Michael Health System PSA
Table 9. Primary Care Access Indicators by County in the CHRISTUS St. Michael Health System PSA
34Food Access
Both obesity and healthy eating were raised as top health issues by survey respondents. Often
obesity is correlated with poor food access, and about 9.9% of residents in the CSMHS PSA live
in a food desert, meaning there isn’t a grocery store with one mile for urban residents and five
miles for rural residents (Figure 27). Without easy access to fresh, healthy foods, people
sometimes rely on fast food and other unhealthy options. The map below shows that food
desert areas are spread across the PSA, but highest concentrations are found in zip codes 75569
(20.0%) and 75572 (19.0%). In addition to food deserts, about 1-in-5 residents are considered
food insecure, which is an indicator that incorporates both economic and social barriers to food
access (Figure 28).
Source: Food Access Research Atlas
Figure 27. Map of Residents Living in Food Deserts in the CHRISTUS St. Michael Health System PSA
35Figure 28. Percent of Residents who are Food Insecure in the CHRISTUS St. Michael Health System PSA
Figure 29. Food Access Indicators by County in the CHRISTUS St. Michael Health System PSA
36Violence and Community Safety
As shown in Figure 30, the rate of property crimes in the CSMHS PSA (2,487.6 crimes per
100,000 residents), which includes burglary, larceny, motor vehicle theft and arson crimes, is
lower than that of Texas (2,468.4) and Arkansas (2,970.2) and slightly higher than the rate in
the country (2,222.6). The same pattern applies to violent crime in the PSA (442.6 crimes per
1,000 residents) compared to Texas (430.5), Arkansas (586.9) and the United States (391.0)
(Figure 31). Violent crime includes homicide, criminal sexual assault, robbery, aggravated
assault and aggravated battery.
Figure 30. Property Crime Rate in the CHRISTUS St. Michael Health System PSA
Figure 31. Violent Crime Rate in the CHRISTUS St. Michael Health System PSA
37Health Data Analysis
Health Outcomes: Morbidity and Mortality
Chronic Disease
Community members noted that chronic conditions, especially heart disease and diabetes, had
an outsized impact on the community. The rate of high blood pressure in the CSMHS PSA
(39.4%) is higher than the full CHRISTUS Health service area (35.5%), Texas (32.2%) and
Arkansas (36.1%) (Figure 32). Additionally, more than 1 in 10 adults has diabetes in the
Texarkana service area. As shown in Figure 33, the rate of diabetes in the CSMHS PSA (13.4%) is
higher than the rate in Texas (12.7%), Arkansas (11.3%) and the entire CHRISTUS Health service
area (13.1%). Chronic kidney disease affects just under 3.5% of the population in the service
area, which is slightly above the other benchmarks (Figure 34). Lastly, about 10.0% of the
population lives with asthma (Figure 35). This is slightly higher than rate as the full CHRISTUS
Health service area (9.1%), Texas (8.1%) and Arkansas (9.9%) (Figure 35). The following figures
and tables illustrate these disease conditions.
Figure 32. High Blood Pressure in the CHRISTUS St. Michael Health System PSA
38Figure 33. Diagnosed Diabetes in the CHRISTUS St. Michael Health System PSA
Figure 34. Chronic Kidney Disease in the CHRISTUS St. Michael Health System PSA
39Figure 35. Residents with Asthma in the CHRISTUS St. Michael Health System PSA
Table 10. Chronic Disease Indicators by County in the CHRISTUS St. Michael Health System PSA
40Maternal Health
As shown in Figure 36, the CSMHS PSA experiences a similar number of preterm births (12.3%
of live births) as Texas (12.3%) and Arkansas (12.7%). This is particularly an issue for Non-
Hispanic Black people in the service area, who experience preterm births in 20.7% of live births,
which is much higher than any the Non-Hispanic White population. It should be noted that the
most recent data for the CSMHS PSA was from 2013, so these rates may be different today. The
teen birth rate in the service area (20.9 births per 1,000 women) is about the same as that of
the CHRISTUS service area (22.1), Texas (17.1) and Arkansas (20.7). As illustrated in Figure 37,
the teen birth rate has significantly decreased in the PSA over the past two decades.
Figure 36. Percent of Births that are Preterm in the CHRISTUS St. Michael Health System PSA
Figure 37. Teen Birth Rate in the CHRISTUS St. Michael Health System PSA
41Mental Health
More than 20% of adults in the CSMHS PSA report being depressed (Figure 38), but the
available data was collected before the pandemic. Based on the community survey as well as
pulse surveys conducted by the American Community Survey, it is likely the percentage has
increased over the last two years.
Figure 38. Depression Rate in the CHRISTUS St. Michael Health System PSA
42Leading Causes of Death
The top ten causes of death in the CSMHS PSA can be found in Table 11. The leading causes of
death will be further explored in the sections below. A report by University of Texas at Tyler
found that the Northeast Texas region, also known as the Texas Health Service Region 4/5N by
the Texas Department of State Health Services, experiences higher mortality rates than the rest
of the state or the country in each of the top five causes of death in the United States – heart
disease, cancer, unintentional injury, chronic lower respiratory diseases and stroke. As seen in
Table 11, disproportionate mortality rates in the St. Michael Health System PSA reflect those of
the Northeast Texas region.
Table 11. Leading Causes of Death in the CHRISTUS St. Michael Health System PSA
43Heart Disease
Coronary heart disease makes up the largest contributor to the heart disease mortality rate,
accounting for 253.5 deaths per 100,000 deaths. Heart disease mortality has a disparate impact
on the Black community in the CSMHS PSA (Figure 39). The mortality rate for non-Hispanic
Black people is 295.6 deaths per 100,000 deaths compared to 247.3 deaths for non-Hispanic
White people. These disparities contribute to the disproportionate heart disease mortality rates
in the region.
Figure 39. Heart Disease Mortality with Stratifications in the CHRISTUS St. Michael Health System PSA
44Cancer
Cancer represents the second leading cause of death in the CHRISTUS St. Michael Health
System PSA. Lung, trachea and bronchus cancers make up the largest portion of cancer deaths,
causing 49.9 out of 100,000 deaths. The second largest cause of cancer mortality in the PSA
comes from colorectal cancer, causing 17.5 out of 100,000 deaths.
Leading types of cancer found in the CSMHS PSA can be found in Table 12. In the CHRISTUS St.
Michael Health System PSA, there is a higher rate of cervical cancer (14.8 diagnoses per
100,000 residents) than both Texas (9.30) and Arkansas (9.50). Rates of breast cancer and
prostate cancer in the CSMHS PSA are lower than the rates in Texas and Arkansas. All other
cancer diagnosis rates lie somewhere between the two other benchmarks.
Table 12. Cancer Diagnosis Rates in the CHRISTUS St. Michael Health System PSA
45Although the lung cancer rate in the PSA (74.3 diagnoses per 100,000 people) is lower than the
rate in Arkansas (76.5), it is still much higher than the rate in Texas (49.5). Environmental
factors may contribute to the lung cancer burden in the CSMHS PSA. The Lifetime Inhalation
Cancer Risk of the Environmental Protection Agency’s Environmental Justice Index is a weighted
index of vulnerability to lifetime inhalation cancer risk. It measures estimated lifetime risk of
developing cancer as a result of inhaling carcinogenic compounds in the environment, per
million people. The Lifetime Inhalation Cancer Risk is higher in the PSA, measuring 38.4 lifetime
risk per million, compared to the full CHRISTUS Health service area (35.0 lifetime risk), Texas
(27.6 lifetime risk) and Arkansas (34.3 lifetime risk) (Figure 40).
Figure 40. Lifetime Inhalation Cancer Risk in the CHRISTUS St. Michael Health System PSA
Injury
Injuries account for the third highest cause of death in the CHRISTUS St. Michael Health System
PSA. This is, in part, because this category includes many kinds of injury. Within the injury
category, 47.2 out of 100,000 deaths come from unintentional injury, 22.5 from motor vehicle
traffic, 18.8 from firearm-related deaths, 19.7 deaths by suicide and 4.4 deaths from falls.
46Chronic Lower Respiratory Disease
This is a roll up of four major respiratory diseases—chronic obstructive pulmonary disease
(COPD), chronic bronchitis, emphysema and asthma. As demonstrated in Figure 41, there
appears to be a significant disparity with this cause of mortality when comparing the service
area (66.6 deaths per 100,000) to Texas (38.9 deaths) and Arkansas (62.0 deaths).
Figure 41. Chronic Lower Respiratory Disease Mortality in the CHRISTUS St. Michael Health System PSA
47Stroke
The mortality rate for stroke is higher in the service area (56.6 deaths per 100,000) than either
benchmark. When looking at race/ethnicity stratifications, death by strokes is much more
common in the Non-Hispanic Black population (80.5 deaths) compared to the Non-Hispanic
White population (51.9) (Figure 42).
Figure 42. Stroke Mortality with Stratifications in the CHRISTUS St. Michael Health System PSA
48Alzheimer’s Disease
The mortality rate for Alzheimer’s has been on a general incline over the last 20 years in the
service area. It is higher than the rate in other benchmark locations (49.1 deaths per 100,000) in
the PSA versus Texas (39.7) and Arkansas (41.0) (Figure 43).
Figure 43. Alzheimer's Disease Mortality in the CHRISTUS St. Michael Health System PSA
49Diabetes
The rate of mortality for diabetes in the CSMHS PSA overall (30.6 deaths per 100,000) is higher
than that of the Texas (22.7 deaths), but slightly lower than Arkansas (30.8 deaths) (Figure 44).
This is similar to the pattern in the Northeast Texas region. As illustrated in Figure 44, Non-
Hispanic Black people face the greatest burden for diabetes mortality rates (49.9 deaths versus
27.7 deaths in Non-Hispanic White people).
Figure 44. Diabetes Mortality with Stratifications in the CHRISTUS St. Michael Health System PSA
50Influenza and Pneumonia
Death from influenza and pneumonia had been on a steady decline across all benchmark
regions over time (Figure 45). In the most recent data collection period, influenza and
pneumonia mortality rates in the PSA (13.8 deaths per 100,000) surpassed the average rate in
Texas (11.8 deaths), but it still remains below the rate of Arkansas (17.9 deaths).
Figure 45. Influenza and Pneumonia Mortality in the CHRISTUS St. Michael Health System PSA
51Kidney Disease
As shown in Figure 46, death from kidney disease in the CSMHS PSA (18.2 deaths per 100,000)
lower than the rate in Arkansas (18.7 deaths), but higher than Texas (15.6 deaths). It is
currently on a downward trend, but rates in the CSMHS PSA over the past twenty years have
remained stable. As is highlighted in the next section on hospital utilization data, kidney disease
and corresponding conditions are a major reason for inpatient admissions.
Figure 46. Kidney Disease Mortality in the CHRISTUS St. Michael Health System PSA
52You can also read