Company Presentation August 2021 - Dropbox Investor ...
←
→
Page content transcription
If your browser does not render page correctly, please read the page content below
Company Presentation August 2021

Safe Harbor Statement
This presentation contains forward-looking statements. These statements may relate to, but are not limited to, plans for growth, technological capabilities and new features and products and the long-term financial
targets of Dropbox, Inc. (“Dropbox,” “we,” “us,” or similar terms), as well as assumptions relating to the foregoing. Forward-looking statements are inherently subject to risks and uncertainties, some of which cannot
be predicted or quantified. In some cases, you can identify forward-looking statements by terminology such as “may,” “will,” “should,” “could,” “expect,” “plan,” anticipate,” “believe,” “estimate,” “predict,” “intend,”
“potential,” “would,” “continue,” “ongoing” or the negative of these terms or other comparable terminology. You should not put undue reliance on any forward-looking statements. Forward-looking statements should
not be read as a guarantee of future performance or results, and will not necessarily be accurate indications of the times at, or by, which such performance or results will be achieved, if at all.
Forward-looking statements are based on information available at the time those statements are made or management’s good faith beliefs and assumptions as of that time with respect to future events, and are
subject to risks and uncertainties that could cause actual performance or results to differ materially from those expressed in, or suggested by, the forward-looking statements. In light of these risks and uncertainties,
the events and circumstances contemplated by the forward-looking statements made in this presentation may not occur and actual results could differ materially from those anticipated or implied in the forward-
looking statements. These risks and uncertainties are described in greater detail under the heading “Risk Factors” in our quarterly report on Form 10-Q for the fiscal quarter ended March 31, 2021 that we filed with
the Securities and Exchange Commission (the “SEC”) on May 7, 2021, and include, but are not limited to, our ability to realize anticipated benefits to our business from our shift to a Virtual First work model as well
as impact to our financial results and business operations as a result of this shift; the impact to our financial results, business operations, the business of our customers, suppliers, partners and the economy as a
result of the COVID-19 pandemic and related public health measures, as well as the potential for a more permanent global shift to remote work; our ability to retain and upgrade paying users, in particular paying
users impacted by the COVID-19 pandemic, and increase our recurring revenue; our ability to attract new users or convert registered users to paying users, in particular prospective paying users financially
impacted by the COVID-19 pandemic; our future financial performance, including trends in revenue, costs of revenue, gross profit or gross margin, operating expenses, paying users, and free cash flow; our history
of net losses and our ability to achieve or maintain profitability; our liability for any unauthorized access to our data or our users’ content , including through privacy and data security breaches, significant disruption
of service on our platform or loss of content, particularly from any potential disruptions in the supply chain for hardware necessary to offer our services that may result from the COVID-19 pandemic, ; any decline in
demand for our platform or for content collaboration solutions in general; changes in the interoperability of our platform across devices, operating systems, and third-party applications that we do not control;
competition in our markets; our ability to respond to rapid technological changes, extend our platform, develop new features or products, or gain market acceptance for such new features or products, particularly in
light of potential disruptions to the productivity of our employees that may result from our shift to a Virtual First work model; our ability to manage our growth or plan for future growth; our acquisition of other
businesses and the potential of such acquisitions to require significant management attention, disrupt our business, or dilute stockholder value; our ability to attract and retain key personnel and highly qualified
personnel; our capital allocation plans with respect to our stock repurchase program and other investments;; and the dual class structure of our common stock and its effect of concentrating voting control with
certain stockholders who held our capital stock prior to the completion of our initial public offering. These factors could cause actual results, performance or achievement to differ materially and adversely from those
anticipated or implied in the forward-looking statements. Additional information will be available in other future reports that we may file with the SEC from time to time, which could cause actual results to vary from
expectations. Except as required by law, Dropbox does not undertake any obligation to publicly update or revise any forward-looking statement, whether as a result of new information, future developments or
otherwise.
In addition to financial information presented in accordance with U.S. generally accepted accounting principles (“GAAP”), this presentation includes certain non-GAAP financial measures, including non-GAAP gross
margin, non-GAAP operating income, non-GAAP operating expenses (including research and development, sales and marketing and general and administrative), non-GAAP operating margin and free cash flow.
These non-GAAP measures are presented for supplemental informational purposes only and should not be considered a substitute for financial information presented in accordance with GAAP. These non-GAAP
measures have limitations as analytical tools, and they should not be considered in isolation or as a substitute for analysis of other GAAP financial measures. The non-GAAP measures Dropbox uses may differ
from the non-GAAP measures used by other companies.
This presentation also contains statistical data, estimates and forecasts that are based on independent industry publications or other publicly available information, as well as other information based on our internal
sources. This information may be based on many assumptions and limitations, and you are cautioned not to give undue weight to such information. We have not independently verified the accuracy or
completeness of the data contained in the industry publications and other publicly available information. Dropbox does not undertake to update such data after the date of this presentation.
All third-party logos appearing in this presentation are trademarks or registered trademarks of their respective holders. Any such appearance does not necessarily imply any affiliation with or endorsement of
                                                                                                                                                                                                                                 2
Dropbox.
Business Overview

                    3
Dropbox Today

Leader in file sync and share

Smart workspace for digital content collaboration

Addressing individual and team workflows

Leveraging virality and scale in go-to-market

Balanced growth and cash flow generation model

                                                    4
Global Collaboration
Platform at Scale*

700M+
registered users

550B+
pieces of content

16.14M
 paying users

80%
of subscribers use us for work
                                 5
*Data as of 6/30/21
Keeping Files in Sync   Keeping Teams in Sync

Cloud storage                   Smart Workspace
2007                             Today

Backup & sync                    Team collaboration

File sync and sharing            Content management

                                 Professional sharing

                                 Secure sharing and analytics

                                 Project management

                                 eSignature

                                 Content backup

                                                                6
Our Product Portfolio

  Individuals    Teams

  Basic          Family       HelloSign       Personal

  Plus           Standard     HelloSign API   Standard

  Professional   Advanced     HelloWorks      Advanced
                 Enterprise   HelloFax        Enterprise
                                                           7
Reinventing the Software Playbook

        Traditional playbook          What sets Dropbox apart

          Designed for IT       vs.           Designed for users

        Top-down distribution   vs.          Bottom-up adoption

           Walled garden        vs.           Open ecosystem

          Rip-and-replace       vs.           Live side-by-side

                                                                   8
Efficient Go-to-Market

                         Expand

                         Deploy fully

                                        9
Growth Drivers

Execute                                             Innovate

Convert and Retain                                  New product experiences
Drive registered users to become paying             Leverage scale and user insights to enhance
users of Individual and Team plans                  existing products and drive adoption of new ones

Upsell                                              Expand into workflows

Prompt existing users to upgrade to premium         Invest in integrations and native capabilities to
plans or purchase additional licenses and add-ons   enable more workflows

                                                                                                        10
New Products and Features
Transfer Vault
11New Products and Features
Passwords Backup
12Growing Portfolio of Add-on
Products for Teams
• Automated workflows for account capture, onboarding & off-boarding
Advanced Team and Content Controls
• Data Loss Prevention
• Recover any files deleted or changed in the last 10 years
Data Governance
• Offered with or without Legal Hold capability
• Quickly migrate files from local or cloud storage into Dropbox Business
Data Migration
• Insightful analytics & comprehensive reporting
• Secure and easy large file previews and transfers
Creative Tools • Review and aggregate frame-based commenting for large videos
• Integration with Adobe Creative Cloud
13Dropbox Family Plan
• Organize, centralize and protect your Family content
• Enhanced privacy and security features
Manage what matters most Keep your family connected Keep sensitive info safe
14Dropbox Business
• Organize and centralize content around the needs of your team
• Collaborate in shared workspaces and streamline workflows
• Secure company data through visibility into content access and sharing
Shared team workspace Data governance and audit logs Team management & centralized billing
15HelloSign Update • Native integration in Dropbox • 75%+ growth in end-user signature requests • 60%+ growth in API transactions • Available in 21 additional languages • Increasing cross-sell velocity *Note: Growth rates reflect Q2 2021 versus the year ago period 16
DocSend Update

  • DocSend is a secure self-serve document sharing and analytics product
  • Current use cases revolve around content sharing and virtual data rooms for fundraising, M&A, sales and
    marketing, and investor relations
  • Similar go to market strategy to Dropbox leveraging self-serve business
  • Full suite of self-serve products to manage end-to-end document workflow: creation, sharing, signature

                                                                                                              17
Open ecosystem 60B+
API calls /month
1M+
registered developers
35%
more spent by Dropbox
users who are active on
integrations at least
monthly, compared to
those who are not.
85%
of active, paid Dropbox
teams have linked a third-
party app
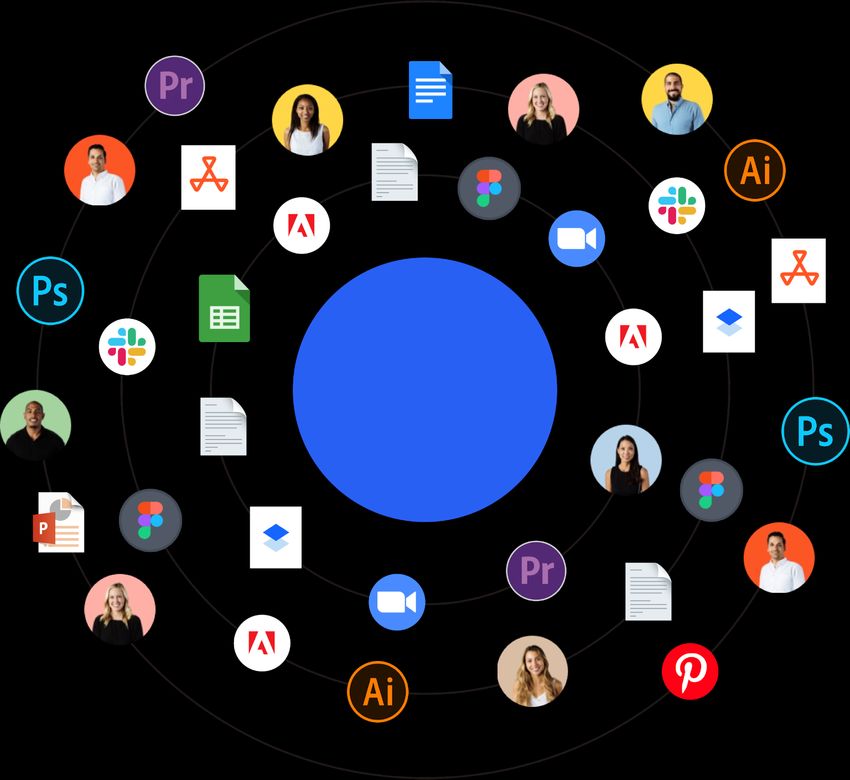
* Note: As of August, 2021 18Deep Integration
Partners
19Environmental, Social, and Governance
Environmental Social Governance
Dropbox is committed to Our DEI initiatives, workforce We’re committed to maintaining
fighting global warming and development programs, and ethical an independent and diverse
reducing our carbon footprint. business practices all play a role in board of directors. Since 2019,
We're always looking at ways driving Social Responsibility at we’ve added four directors who
we can make a difference in our Dropbox. In addition, we also are women or members of
day-to-day business practices, empower our employees to give underrepresented communities
and have set meaningful back by providing paid volunteer to our board.
sustainability goals that we plan time off, matching donations, and
to accomplish by 2030. making product donations to
nonprofits, through our Dropbox for
Good program. 20Financial Highlights
21Financial Highlights
Significant revenue and cash flow scale
Predictable and balanced financial model
Investing for continued revenue growth
Driving for strong operating leverage
22Dropbox Financial Strategy: Achieving LT Model by 2024
$1 Bn
28-30%
Free Cash Flow Reducing total
Non-GAAP
share count
Operating Margin
23
*Note: Operating margin is non-GAAP and excludes stock-based compensation expense and certain non-recurring adjustments. Free cash flow is GAAP net cash provided by operating activities less capital
expenditures. See appendix for non-GAAP reconciliation.Strong Performance at Scale
35%
81%
$800
$720 80% 30% 28.8%
80%
$700 79%
$2,500 79% 25%
$2,139 $600 21%
$2,000
$1,914 $491 78%
20%
$1,661 $500
$392 77%
$1,392 $400 $362 76% 15%
$1,500 76%
75% 12% 12%
$300
75%
$1,000 10%
$200 74%
$500 5%
$100 73%
$0 $0 72% 0%
2018 2019 2020 2021E 2018 2019 2020 2021E 2018 2019 2020 2021E 2018 2019 2020 2021E
Revenue ($M) Free Cash Flow ($M) Non-GAAP Gross Margin Non-GAAP Operating Margin
*Note: Non-GAAP gross margin and non-GAAP operating margin exclude stock-based compensation expense and certain non-recurring adjustments. Free cash flow is GAAP net cash provided
by operating activities less capital expenditures. See appendix for non-GAAP reconciliation. 24
* 2021E based off the midpoint of company guidanceKey Metrics
$128.50
$2,022
$1,811 15.48
14.31 $123.07
$1,510 12.70
$117.64
2018 2019 2020 2018 2019 2020 2018 2019 2020
ARR ($M) Paying Users (MM) ARPU ($)
25
For information on how we define each of these key metrics, see appendix.Q2’21 Financial Highlights
$540
$531
$180
$169 50%
$160 45%
$520
40%
$140
$500 35%
$120
30%
$480 $100 $96
$467 25%
$80
$460
20%
$60
15%
$440
$40
10%
$420
$20 5%
$400 $0 0%
Q2 20 Q2 21 Q2 20 Q2 21
Non-GAAP operating margin
Revenue ($M) Operating Income ($M)
26
Operating income is non-GAAP and excludes stock-based compensation expense and certain non-recurring adjustments. See appendix for non-GAAP reconciliation.Q2’21 Financial Highlights
$134.00
$2,250
$133.50
16.25
16.14 $133.15
$2,200 16.15
$133.00
$2,166 16.05
$2,150
15.95
$132.55
15.85
15.83 $132.50
$2,112
15.75
$2,100
$132.00
15.65
15.55
$2,050
15.45 $131.50
15.35
$2,000 15.25 $131.00
Q1 21 Q2 21 Q1 21 Q2 21 Q1 21 Q2 21
ARR ($M) Paying Users (M) ARPU ($)
*Note: For information on how we define each of these key metrics, see appendix. 27Mix-shift to Premium Plans
% Paying Users on Premium Plans
25%
20%
20%
15%
4x
Increase in the attach rate
10%
of users to premium plans
5%
5%
0%
2017 2020
*Note: Figures exclude HelloSign. Premium plans refer to Dropbox Professional and Dropbox Advanced.
28Operating Leverage
Proprietary Infrastructure Virtual First Workforce Optimization
29Target Model
Non-GAAP 2019 2020 Long-term target
Gross Margin 76% 79% 78 - 80%
R&D expense as % of revenue 30% 28% 23– 25%
S&M expense as % of revenue 23% 20% 18 – 20%
G&A expense as % of revenue 11% 10% 8 – 10%
Operating margin 12% 21% 28 – 30%
Annual Free Cash Flow $392M $491M $1B+
30
*Note: Margins and expenses exclude stock-based compensation expense and certain non-recurring adjustments. Free cash flow is GAAP net cash provided by operating activities less capital expenditures. See
appendix for non-GAAP reconciliation.Appendix
Dropbox subscription plans
                                                                Personal                                                                                              Business

               Basic                               Plus                            Family                        Professional                          Standard                          Advanced                          Enterprise
    Free                             $11.99 / month                    $19.99 / month                     $19.99 / month                     $15.00 / user / month             $25.00 / user / month              Negotiated pricing
                                     $119.88 / year                    $203.88 / year                     $199.00 / year                     $150.00 / user / year             $240.00 / user / year
                                                                                                                                             3 users minimum                   3 users minimum

  Dropbox Transfer*                  Everything in Basic               Everything in Plus                 Everything in Plus                 Everything in Basic               Everything in Standard             Everything in Advanced
  Dropbox Paper
  Computer Backup                    Passwords                         Up to 6 users                      Auto OCR                           Dropbox Rewind                    Premium previews                   Enterprise mobility
  File requests                      Vault*                            Family Room folder                 Image search                       Smart Sync and Smart              Time-based comments                management (EMM)
  30 day version history             Dropbox Rewind                                                       Watermarking                       Sync Auto-Evict                   Viewer history                     Network control
  HelloSign eSignatures              Smart Sync and Smart                                                 Shared link controls               Auto OCR, Image and full          Single sign-on integration         Domain insights and
                                     Sync Auto-Evict                                                                                         text search                       (SSO)                              account capture
  Passwords                                                                                               Branded sharing
                                                                                                                                             Watermarking                                                         24/7 phone support and
                                     Full text search                                                     180 day version history                                              Audit logs
                                                                                                                                             Shared link controls                                                 advanced training
                                     Priority email support                                               Premium previews                                                     Device approvals
                                                                                                                                             Branded sharing
                                                                                                          Time-based comments                                                  Tiered admin roles
                                                                                                                                             180 day version history
                                                                                                          Viewer history                                                       Business hours phone
                                                                                                                                             Team folders                      support
                                                                                                          Traffic and insights
                                                                                                                                             Admin console
                                                                                                                                             Granular permissions
                                                                                                                                             Active directory connector
                                                                                                                                             Enables HIPAA compliance
                                                                                                                                             Unlimited API access**
                                                                                                                                             Priority email + live chat

  2GB of storage                     2TB storage                       2TB storage                        3TB storage                        5TB storage                       As much storage as                 As much storage as
                                                                                                                                                                               needed                             needed
                                                                                                                                                                                                                                              32
*Vault is only available in Plus, Family, and Professional. *Size of Dropbox Transfer varies based on Dropbox plan: Basic (100MB), Plus, Family, & Standard (2GB), Professional, Advanced, and Enterprise (100GB). Professional, Advanced, and Enterprise
plans also receive advanced Transfer functionality.
**Teams have unlimited API access to productivity and security partners but may be subject to a cap on API calls to data transport partners.
HelloSign Subscription Plans
FREE ESSENTIAL STANDARD PREMIUM FREE ESSENTIAL STANDARD PREMIUM
$0 $15 / user / mo $25 / user / mo $40 / user / mo Build & $75 / mo $250 / mo $400 / mo
Test
1 user 1 user Minimum 2 users Minimum 5 users 5 Templates 15 Templates Unlimited Templates
our API for
0 Templates 5 Templates 15 Templates Unlimited Templates Free Starts 50 reqs / mo* Starts 100 reqs / mo* Starts 100 reqs / mo*
3 req / mo Unlimited reqs Unlimited reqs Unlimited reqs
Audit Trail Includes Free Includes Ess. Includes Std. API dashboard Includes Ess. Includes Std.
Notification Data validation Branding Adv. signing tools Audit trail Branding Adv. signing tools
Signer fields Multiple languages Bulk send Adv. signer fields Data validation Bulk send Adv. signer fields
and more…. Tamper-proofing Salesforce integration$ Adv. reporting SDKs in 6 languages Embedded signing Embedded templates
Template Links SMS auth. Multi-teams$ Signer fields Signer attachments White labeling$
and more…. and more…. and more…. and more…. and more…. and more….
Plans include unlimited document storage in HelloSign or
Prebuilt storage integrations with Dropbox and several others Plans include unlimited document storage in HelloSign
$ Additional cost add-on
* Higher API volume tiers available, up to 300K per month
33DocSend Subscription Plans
Personal Standard Advanced Enterprise
For business teams that need best-in-
For individuals who want secure sharing For deal management professionals that
class document sharing and team For larger teams
and document insights need advanced security or integrations
management
$10 /mo /per user billed annually $45 / month per user billed annually Includes 3 users Plans start at $5,000
$150 / month billed annually
$15 /mo /per user billed monthly $65 / month per user billed monthly Add’l users $60/ month
$250 / month billed monthly
Add’l users $60/ month
Document Analytics
Basic Document Security
(Require email, Redirect downloading, Expiration & Passwords)
Spaces
Mail Merge Links
eSignature
Integrations * Basics Only Basics plus add-ons available Basics plus add-ons available
Advanced Security Features
(1-Click NDA, Watermarking, Allowed viewer list, email auth.)
Advanced Spaces Features
(Folders, Granular Space Permission)
Campaign Links
(SSO) Integration Add-on
Sub-Team Permissions Add-on
Storage 10 GB / user 50 GB / user 50 GB / user 50 GB / user
Upload large documents 2 GB 2 GB 2 GB 2 GB
34
*Integrations note that Basics only includes Dropbox, Gmail, and Outlook. Add-ons available for additional costDefinitions
Total Annual Recurring Revenue, (“Total ARR” or “ARR”) – represents the amount of revenue that we expect to
recur, enables measurement of the progress of our business initiatives, and serves as an indicator of future growth.
We calculate Total ARR as the number of users who have active paid licenses for access to our platform as of the end
of the period, multiplied by their annualized subscription price to our platform. We adjust the exchange rates used to
calculate Total ARR on an annual basis at the beginning of each fiscal year.
Average Revenue per Paying User, (“ARPU”) – is defined as our revenue for the period presented divided by the
average paying users during the same period. For interim periods, we use annualized revenue, which is calculated by
dividing the revenue for the particular period by the number of days in that period and multiplying this value by 365
days. Average paying users are calculated based on adding the number of paying users as of the beginning of the
period to the number of paying users as of the end of the period, and then dividing by two.
Paying Users – are defined as the number of users who have active paid licenses for access to our platform as of the
end of the period. One person would count as multiple paying users if the person had more than one active license.
For example, a 50-person Dropbox Business team would count as 50 paying users, and an individual Dropbox Plus
user would count as one paying user. If that individual Dropbox Plus user was also part of the 50-person Dropbox
Business team, we would count the individual as two paying users.
35Non-GAAP reconciliation
Three Months Ended
June 30, 2020 June 30, 2021
Income from operations - GAAP $ 12.8 $ 84.4
Stock-based compensation 76.6 73.9
Acquisition-related and other
expenses 4.4 6.7
Amortization of acquired intangible
assets 2.4 3.5
Workforce reduction expense — 0.9
Income from operations - Non-GAAP $ 96.2 $ 169.4
Non-GAAP operating margin 20.6% 31.9%
36Non-GAAP reconciliation
Twelve Months Ended
December 31, 2018 December 31, 2019 December 31, 2020
Net Cash provided by operating activities $ 425.4 $ 528.5 $ 570.8
Capital expenditures (63.0) (136.1) (80.1)
Free cash flow $ 362.4 $ 392.4 $ 490.7
37Non-GAAP reconciliation
Twelve Months Ended - 2020
Acquisition- Amortization of Impairment
Stock based related and other acquired related to real
GAAP compensation expenses intangible assets estate assets Non-GAAP
Gross profit $ 1,499.3 $ 17.1 $ — $ 3.9 $ — $ 1,520.3
Gross margin 78.3 % 0.9 % — 0.2 % — 79.4 %
Research and development 727.5 (174.1) (16.8) — — 536.6
Research and development margin 38.0 % (9.1%) (0.9%) — — 28.0 %
Sales and marketing 422.8 (33.7) — (5.6) — 383.5
Sales and marketing margin 22.1 % (1.8%) — (0.3%) — 20.0 %
General and administrative 227.8 (36.6) (0.1) — — 191.1
General and administrative margin 11.9 % (1.9%) — — — 10.0 %
Impairment related to real estate assets 398.2 — — — (398.2) —
Impairment related to real estate assets
margin 20.8 % — — — (20.8%) —%
Income (loss) from operations (277.0) 261.5 16.9 9.5 398.2 409.1
Operating margin (14.5%) 13.7 % 0.9 % 0.5 % 20.8 % 21.4 %
Note: % may not foot due to rounding
38Non-GAAP reconciliation
Twelve Months Ended - 2019
Acquisition-related Amortization of
Stock based and other acquired intangible
GAAP compensation expenses assets Non-GAAP
Gross profit $ 1,250.3 $ 15.8 $ — $ 3.4 $ 1,269.5
Gross margin 75.3 % 1.0 % — 0.2 % 76.4 %
Research and development 662.1 (147.6) (14.5) — 500.0
Research and development margin 39.9 % (8.9) % (0.9) % — 30.1 %
Sales and marketing 423.3 (31.4) — (5.0) 386.9
Sales and marketing margin 25.5 % (1.9) % — (0.3%) 23.3 %
General and administrative 245.4 (66.4) (1.4) — 177.6
General and administrative margin 14.8 % (4.0%) (0.1%) — 10.7 %
Income (loss) from operations (80.5) 261.2 15.9 8.4 205.0
Operating margin (4.8) % 15.7 % 1.0 % 0.5 % 12.3 %
Note: % may not foot due to rounding
39Non-GAAP reconciliation
Twelve Months Ended - 2018
Employer payroll
Stock based related to the release
GAAP compensation of two-tier RSUs Non-GAAP
Gross profit $ 997.0 $ 47.0 $ 1.1 $ 1,045.1
Gross margin 71.6 % 3.4 % 0.1 % 75.1 %
Research and development 768.2 (368.2) (8.3) 391.7
Research and development margin 55.2 % (26.5)% (0.6%) 28.1 %
Sales and marketing 439.6 (94.3) (2.2) 343.1
Sales and marketing margin 31.6 % (6.7)% (0.2)% 24.7 %
General and administrative 283.2 (140.6) (2.3) 140.3
General and administrative margin 20.3 % (10.0)% (0.2%) 10.1 %
Income (loss) from operations (494.0) 650.1 13.9 170.0
Operating margin (35.5)% 46.7 % 1.0 % 12.2 %
Note: % may not foot due to rounding
40Non-GAAP reconciliation
Twelve Months Ended
2018 2019 2020
Loss from operations - GAAP $ (494.0) $ (80.5) $ (277.0)
Stock-based compensation 650.1 261.2 261.5
Employer payroll taxes related to the release of two-
teir RSUs 13.9 — —
Acquisition-related and other expenses — 15.9 16.9
Amortization of acquired intangible assets — 8.4 9.5
Impairement related to real estate assets — — 398.2
Income from operations - Non-GAAP $ 170.0 $ 205.0 $ 409.1
41You can also read