Company Presentation Full Year Results 2019 - Global Ports ...
←
→
Page content transcription
If your browser does not render page correctly, please read the page content below
Company Presentation Full Year Results 2019
GPH Crisis Management

Mehmet Kutman, Co-Founder and Chairman
Covid-19- Management actions to date

Inherently flexible business model
• Significant percentage of costs expand and contract with cruise traffic or cargo volumes
• Costs can contract by up to 30% on no volume

Action to reduce costs
• $11m reduction in non volume related costs per annum
      • Board fees, reduced marketing and consultancy fees, salary deferrals
• New port project expenses reduced by c$6.5m
• Costs at Commercial operations are being tightly controlled

Capital expenditure
• Essential maintenance capex only
• Antigua & Nassau capex largely unaffected, funded through agreed loans or planned bond issuance

Financing and concession fees
• Agreed $2.6m of fixed minimum concession fees deferred
• No deferral or postponement of financial liabilities, with the exception of one agreed loan deferral
• Dividend suspended

Government support
• Numerous Government schemes available and being explored but not yet assumed
Covid-19- Key assumptions of severe downside scenario planning
 Numerous scenarios modelled and considered

 Among those: severe downside scenario
      • Zero cruise passengers at Caribbean ports until end 2020, Jan-April 2021 50% of budget
      • Zero cruise passengers at all other ports until end April 2021
      • Port Akdeniz marble volumes, -35% v 2019 to end Dec 2020 and 25% below budget until end April 2021

 Volume related reduction maximised (operating costs reduced by $18.8m)
       • Stevedoring, security, luggage handling etc

 Cost savings of $12.1m from non volume related costs, additional $1.1m from already agreed actions

 Capital expenditure
        • Essential maintenance capex only
        • Antigua & Nassau capex largely unaffected, funded through agreed loans or planned bond issuance

 Assumes no support from Government facilities

 Outcome of severe scenario at end April 2021
       • Sufficient cash resources to remain in operation at end April 2021
       • GLI $250m Eurobond would rise above Gross Debt/EBITDA restrictive covenant but not breach
       • Other loan covenants either not breached or waivers already agreed

 Opportunities to improve liquidity still further
       • Successfully accessing numerous Government schemes
       • Successfully suspend or defer additional fixed minimum concession fees
       • Further management actions to reduce costs
2019 Operating Review

   Emre Sayin, CEO
FY 2019 Key Financial and Operating Highlights

Record Cruise results, offset by weak Commercial performance
• Revenue of $117.9m, a decline of 5.6%, Cruise revenue of $63.0m +14.8%, Commercial revenue of $54.8m, -21.5%
• In constant currency, revenue declined 3.0%, Cruise revenue rose 19.8%, Commercial revenue fell 21.0%

Record cruise passenger volumes
• Consolidated and managed portfolio passenger volumes +17.7%, to 5.3m
• Record Cruise EBITDA of $44.4m, up 18.0%, ccy +23.1%

Weak commercial volumes
• General & Bulk Cargo volumes -49.7% and Containers TEU volumes -15.9%
• Commercial EBITDA of $39.1m, down 26.4%, ccy -23.1%

Segmental EBITDA of $83.4m, a decline of 8.0%, ccy -5.8%

Adjusted EBITDA of $77.0m down 8.0%, ccy -5.6%

Group strategic review announced and ongoing

Significant progress made on our new port investment strategy
• New concessions signed in Nassau; Antigua; 50:50 JV acquired La Goulette cruise port operator and management agreement
  signed in Ha Long Bay, Vietnam
The Future

Transformation of Nassau / Bahamas
Further expansion in Mediterranean and Asia
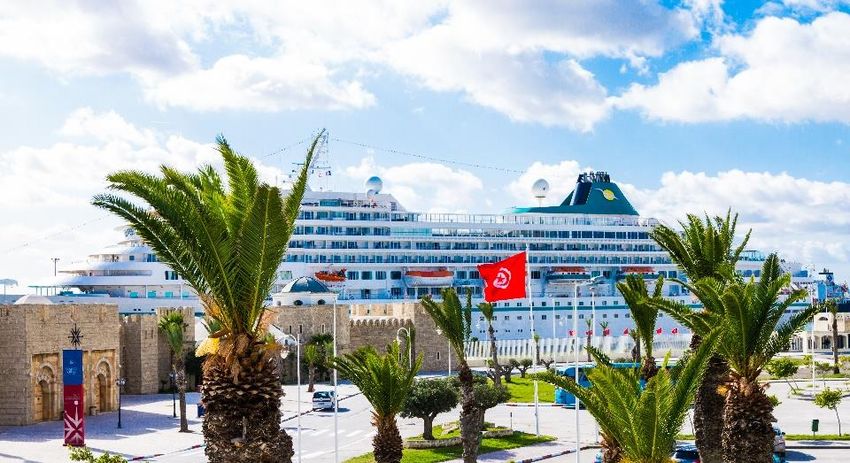
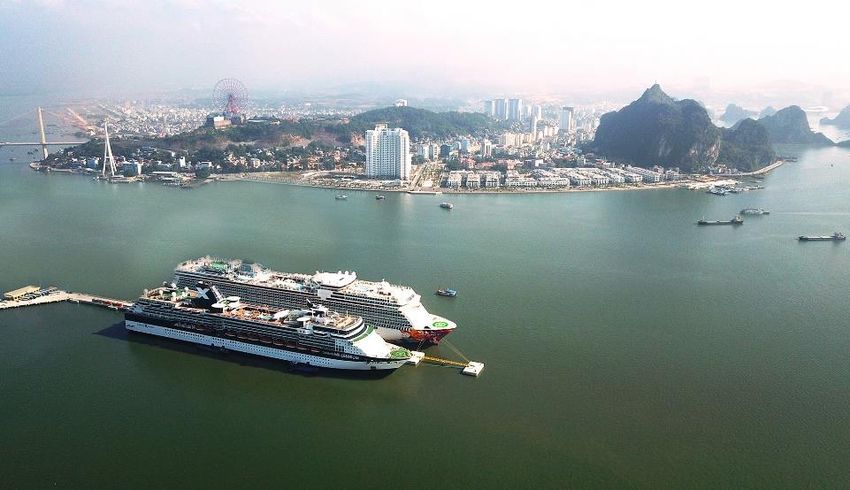
La Goulette, Tunisia Ha Long Bay, Vietnam
JV successfully acquired current operator Signed 15 year management services agreement
Concession runs until 2036 First purpose-built cruise port in Vietnam
Option to extend Recent $44m investment
900k PAX in 2010 Part of Sun World Halong Complex
Avg 440k PAX 2011-14 Current PAX c75k
Currently almost non existent PAX volumes Close to China, Hong Kong, Indonesia, Malaysia and
Land based tourism growing strongly Singapore
Strong retail potential
Appendix
Financial Highlights

             ($m)                          FY 2019 FY 2019 FY 2018  YoY
                                         Reported     CCY     CCY Change
             Total Revenue                   117.9     121   124.8  -5.6%
             Segmental EBITDA                 83.4    85.5    90.7  -8.0%
             Group Costs                       -6.4    -6.4    -7.0 -8.3%
             Adjusted EBITDA                  77.0    79.0    83.7  -8.0%

             Operating profit                 15.3            35.9   -57.4%
             Net finance costs              (34.3)          (32.3)     6.2%
             Underlying profit for the
             period                           27.3           59.0    -53.7%

             Operating cash flow              65.1            68.5    -4.9%
             Net Cash from operating          37.1            61.1   -39.3%
             Capex                          (24.0)          (14.8)    62.2%

             Adjusted EPS (c)                 43.5           94.0    -52.9%
             Dividend per share (c)           19.9           55.5    -64.1%

             Net Debt                        389.2          267.2    45.7%
             Net Debt LFL (Ex IFRS 16)       324.3          267.2    21.4%
FY 2019 Segmental Performance
$m FY 2019 FY 2019 FY 2018 YoY YoY
Reported CCY Reported Chge CCY Chge
Revenue $(m) $(m ) $(m) % %
Cruise 63.0 65.8 54.9 14.8% 19.8%
Commercial 54.8 55.2 69.9 -21.5% -21.0%
Total 117.9 121.0 124.8 -5.6% -3.0%
EBITDA
Cruise 44.4 46.3 37.6 18.0% 23.1%
Commercial 39.1 39.2 53.1 -26.4% -26.3%
Segmental EBITDA 83.4 85.5 90.7 -8.0% -5.8%
Group -6.4 -6.5 -7.0 -8.6% -7.1%
Adjusted EBITDA 77.0 79.0 83.7 -8.0% -5.6%
Cruise EBITDA Mgn 70.4% 68.5%
Commercial EBITDA Mgn 71.2% 76.0%
Segmental EBITDA Mgn 70.8% 72.7%
Adjusted EBITDA Mgn 65.3% 67.1%
* Performance at constant currency calculated by translating € earnings from our consolidated cruise ports for the current period into $ at the average exchange rates used over the same period in the prior year.P&L Reconciliation –Full Year 2019
$m FY 2019 FY 2018 Difference
EBITDA 77.0 83.7 (6.7)
Amortisation of port operating rights (32.0) (31.6) (0.4)
Depreciation of right of use assets (2.4) -- (2.4)
Amortisation (13.3) (13.0) (0.3)
Share of Equity Associate (5.6) (5.6) 0.1
One off Adjustments (8.4) 2.5 (10.9)
Operating Profit 15.3 35.9 (20.6)
Finance Income 8.6 28.0 (19.4)
Finance Costs (42.8) (60.9) 18.1
Total Finance Expenses (34.3) (32.9) (1.3)
FX Finance cost impact (5.7) (8.0) 2.3
Interest Exp on Lease ob (Inc IFRS 16) (2.4) -- (2.4)
Share of Equity Accounted 5.6 5.6 (0.1)
(Loss)/ Profit before tax (13.4) 8.6 (22.0)
Tax Expense (1.9) (1.5) (0.4)
(Loss)/ Profit for the period (15.2) 7.1 (22.4)
Amortisation of port operating rights 32.0 31.6 0.4
Depreciation of right of use assets 2.4 -- 2.4
Hedge accounting impact 5.2 17.6 (12.3)
Gain / loss on foreign currency translation - equity 0.4 14.4 (14.0)
Reversal of replacement provisions -- (12.2) 12.2
Noncash reversal basis income / expenses 2.5 0.5 2.0
Underlying Profit 27.3 59.0 (31.7)FY 2019 Cash Flow Net Debt Start of Period (267.2) (227.5) Adjusted EBITDA 77.0 83.7 (6.7) Working Capital (20.7) 0.1 (20.8) Other (11.9) (15.2) 3.3 Operating cash flow 44.3 68.6 (24.3) Net interest expense (29.2) (24.9) (4.3) Tax (7.2) (7.3) 0.1 Net Capital Expenditure (24.2) (14.7) (9.5) Free cash flow (16.3) 21.7 (38.0) Investments (7.9) (12.4) 4.5 Exceptionals (1.9) 0.1 (2.0) Dividends (31.4) (38.1) 6.7 Other (0.0) (0.1) 0.1 Net cash flow (57.5) (28.8) (28.7) FX 0.4 (10.8) Net Debt End of Period (324.3) (267.2) (57.1)
Debt & Facilities

                     Gross Debt by Currency ($m)                                                                                Net Debt of $389.2m (Dec 2018: $267.2m)

                                                                                                                                          Like for Like Net Debt of $324.3m
                                                      2%

                   30%
                                                                                                                                                                                    Net Debt (USD m)
                                        135                                                                                   Gross Debt of $453.0m (Dec 2018: $347.1m)                3.2x                   4.2x

                                                                                                                                                                                                            324.3
                                                                                    68%                                                Like for Like Gross Debt of $388.2m            267.2
                                                                      308

                                                                                                                                    Net Debt/EBITDA 5.1x (Dec 2018: 3.2x)
                                      USD              EUR               Other
                                                                                                                                        Like for Like Net Debt/EBITDA 4.2x          FY 2018               FY 2019
                                                                                                                                                                                                 Net Debt/EBITDA

            Debt Repayment ($m)                                                                                                        Like for like Gross Debt/EBITDA 5.0x
                                           295.3
                                                                                                                                                 Eurobond $250m Nov 2021
                                                                                                                                                                                    Capex ($m)
                                                                                                                                                         Cash conversion 68%

                                                                                                                                                                                                                   24.0
                  36.2
                                                                                                                                                                                          14.8
                                                                       12.7                       8.7                        8.4                      14.6                   12.4

                                                                                                                                                                                      F Y 2018              F Y 2019
            2020                         2021                       2021                      2023                       2024                       2025                2026-2037

   1 Calculated   as loans and borrowings including finance lease obligations – cash and cash equivalents – other short term investments. Includes $6.5m repaid in Q1 2020
Disclaimer
THIS PRESENTATION CONTAINS INSIDE INFORMATION FOR THE PURPOSES OF ARTICLE 7 OF REGULATION (EU) NO 596/2014
NOT FOR RELEASE, PUBLICATION OR DISTRIBUTION, IN WHOLE OR IN PART, IN OR INTO OR FROM ANY JURISDICTION WHERE TO DO SO WOULD
CONSTITUTE A VIOLATION OF THE RELEVANT LAWS OF SUCH JURISDICTION
This announcement does not constitute an invitation and should not be taken as an inducement to engage in any investment activity and is for the purpose of providing information about
the Company. Certain information contained in this announcement constitutes "forward-looking statements," which can be identified by the use of forward-looking terminology such as
"may," "will," "should," "expect," "anticipate," "target," "intend," "continue" or "believe," or the negatives thereof, other variations thereon or comparable terminology. Due to various
risks and uncertainties, actual events or results or the actual performance of the Company described herein may differ materially from the events, results or performance reflected or
contemplated in such forward-looking statements. Any projections, forecasts and estimates contained herein are based upon certain assumptions that the Company considers
reasonable. Projections are necessarily speculative in nature, and it can be expected that some or all of the assumptions underlying the projections will not materialise and/or that actual
events and consequences thereof will vary significantly from the assumptions upon which projections contained herein have been based. The inclusion of projections herein should not be
regarded as a representation or guarantee regarding the reliability, accuracy or completeness of the information contained herein, the Company is under no obligation to update or keep
current such information. Unless otherwise indicated, the information provided herein is based on matters as they exist as of the date of preparation and not as of any future date.
Certain data in this announcement, including financial, statistical, and operating information has been rounded. As a result of the rounding, the totals of data presented and the
percentages in tables changes in this announcement may vary slightly from the actual arithmetic total or percentages as calculated from the rounded dataYou can also read