COMPANY PRESENTATION SEPTEMBER 2020 - CIE Automotive
←
→
Page content transcription
If your browser does not render page correctly, please read the page content below

COMPANY PRESENTATION
         SEPTEMBER 2020
1
DISCLAIMER
             • This document has been prepared by CIE Automotive, S.A. ("CIE Automotive"), and is for information purposes only. No reliance may or should be placed
               for any purposes whatsoever on the information contained in this document or on its completeness, accuracy or fairness. This document and the
               information contained herein are strictly confidential and are being shown to you solely for your information. The information may not be copied,
               distributed, reproduced or passed on, directly or indirectly, in whole or in part, or disclosed by any recipient, to any other person (whether within or
               outside such person's organization or firm) or published in whole or in part, for any purpose or under any circumstances.

             • This document is an advertisement and not a prospectus for the purposes of applicable measures implementing EU Directive 2003/71/EC (such Directive,
               together with any applicable implementing measures in the relevant home Member State under such Directive, the "Prospectus Directive") and as such
               does not constitute or form part of any offer to sell or issue or invitation to purchase or subscribe for, or any solicitation of any offer to purchase or
               subscribe for, any securities of CIE Automotive or any of its affiliates or subsidiaries, nor shall it or any part of it nor the fact of its distribution form the
               basis of, or be relied on in connection with, any contract or investment decision. Investors should not subscribe for or purchase any securities referred to
               in this advertisement except on the basis of the information contained in any prospectus eventually published in accordance with the Prospectus
               Directive. The information and opinions contained in this document are provided as at the date of the document and are subject to change.

             • This document is not an offer of securities for sale in the United States, Australia, Canada or Japan. The information contained herein does not constitute
               an offer of securities for sale in the United States, Australia, Canada or Japan. Securities may not be offered or sold in the United States unless they are
               registered or are exempt from registration. No money, securities or other consideration is being solicited and, if sent in response to the information
               contained herein, will not be accepted. Copies of this document are not being, and should not be, distributed or sent into the United States. This
               document does not constitute an offer of securities to the public in the United Kingdom or in any other jurisdiction. The distribution of this document in
               other jurisdictions may also be restricted by law and persons into whose possession this document comes should inform themselves about and observe
               any such restrictions.

             • Certain financial and statistical information contained in this document is subject to rounding adjustments. Accordingly, any discrepancies between the
               totals and the sums of the amounts listed are due to rounding. Certain management financial measures included in this document have not been subject
               to a financial audit.

             • The information and opinions contained in this document are provided as at the date of the document and are subject to verification, completion and
               change without notice. Neither CIE Automotive nor any of its parent or subsidiary undertakings, or the subsidiary undertakings of any such parent
               undertakings, or any of such person's respective directors, officers, employees, agents, affiliates or advisers, undertakes any obligation to amend, correct
               or update this document or to provide the recipient with access to any additional information that may arise in connection with it.

             • CIE’s management uses recurrently and in a consistent way during business management certain Alternative Performance Measures, APM which include
               terms about results, balance sheet and cash flow. CIE understands that those APMs are helpful to explain its activity evolution, so they are presented,
               defined and reconciled with financial statements in this presentation’s Appendix.

     2
INDEX
        1.   WHAT IS CIE AUTOMOTIVE?

        2.   CIE CULTURE

        3.   UPDATE ON RESULTS

        4.   CIE IN STOCK EXCHANGE

        5.   APPENDIX

  3
1.0 WHAT IS
CIE AUTOMOTIVE?

CIE AT A GLANCE   INTEGRATION AND MANAGEMENT OF PROCESSES IN A
                  SUSTAINABLE AND PROFITABLE WAY

                                                      EBIT 2019:                         CURRENT
                     SALES 2019:                                                         MKT CAP:
                                                     427.1 M€
                    3,461.1 M€                       >12% over sales                    ≈1,900 M€
                                                                       NET RESULT
                                   EBITDA 2019:                          2019:
                                   594.4 M€                            287.5 M€
                                   >17% over sales                     >8% over sales

                        Unique business model developed successfully since 1996, with a
                        solid track record and an IRR over 20%.
                        Carried forward in the context of the necessary consolidation of the
                        automotive Tier 2 sector.
       5
HISTORY   A SUCCESSFUL INTEGRATION STORY OF > 20 YEARS

                   Almost 100 companies and over 28,000 people integrated in Europe,
                           North America, South America and Asia since 1996.
   6
GLOBALISATION   GLOBAL FOOTPRINT WITH ESTABLISHED LOCAL PRESENCE

      7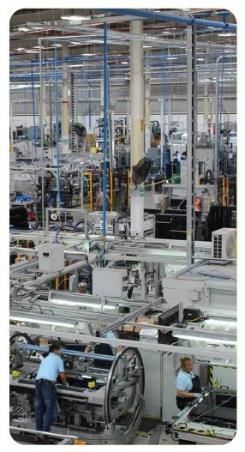
SUSTAINED AND PROFITABLE GROWTH Turnover (M€) EBITDA (M€)
CAGR 2002-2019: 12% CAGR 2002-2019: 15%
17% 17% 17%
3.461
700
16% 16% 16% 17% 18%
15% 15% 15% 15% 15% 16% 594
14% 14% 14% 16%
600
3.029
2.843 12% 529 14%
471
500
11% 12%
2.221
2.051 400 358 10%
320
1.811
300
276 8%
1.479 222 207 223
1.3221.3961.308 192 191
1.158 6%
1.057 200 156
893 969 116 131 120 4%
782 80 91
670
481 570 53
100
2%
0 0%
EBIT (M€) Net Income (M€)
350
8% 8% 9%
600
CAGR 2002-2019: 15% 13% 14%
CAGR 2002-2019: 31%
300
7%
7%
287 8%
12%
12%
11% 11% 6% 7%
12% 243
500
10% 250
10% 10% 427
10% 5% 5%
4% 5%
9% 399 202
6%
9% 8%
10%
4% 5% 4%
400
8% 200
8% 339 4% 5%
8%
3% 151
6% 6% 3% 4%
300
249 150
118
215 6% 2%
3%
172 1% 78
200
152
132 142
100
117 60 59
4%
112 1% 51 54 56 2%
73 90 42 41
100
59 59 50 35
42 2%
13 20 11
1%
3
0 0% 0 0%
Automotive Business comparable following 2018 accounting perimeter.
8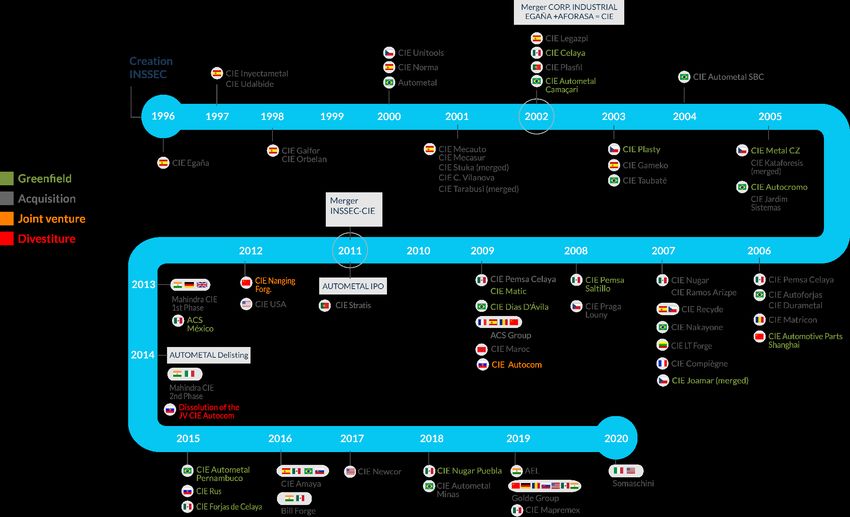
SUSTAINED AND PROFITABLE GROWTH
EARNINGS PER SHARE (€) DIVIDEND PER SHARE (€)
& EPS YIELD & DIVIDEND YIELD
CAGR 2016-2019: 21% CAGR 2016-2019: 22%
+19%
+19% 0,80 0,74 17,80%
2,50
+11%
17,80%
2,23
+13% 15,80% 0,70
0,62
15,80%
1,88
(1)
+37%
2,00
+33% 13,80% 0,60 0,56 13,80%
1,67
10,58% 11,80%
0,50
11,80%
1,50 0,41
1,26 8,77% 9,80%
9,80%
0,40
6,90% 7,80%
7,80%
1,00 0,30
5,80%
6,81% 5,80%
3,51%
0,20
2,21% 2,31% 2,89% 3,80%
3,80%
0,50
0,10 1,80%
1,80%
- -0,20%
- -0,20%
33% 33% 33% 33%
PAY-OUT
High double digit Earnings growth over the POLICY
+ A dividend in kind in 2018 valued in more than
period of the last Strategic Plan has allowed
400€ or more than 3€/share.
significant growth of dividends.
Note: EPS yield and dividend yield are calculated with year end closing share prices.
(1) EPS 2018 is calculated with the normalized automotive business net income (Dominion shares were paid as dividend in kind as of July 3rd, 2018).
9
2.0 CIE CULTURE
       2.1 GEOGRAPHICAL BALANCE

       2.2 COMMERCIAL
       DIVERSIFICATION
       2.3 MULTI –TECHNOLOGICAL
       PORTFOLIO

       2.4 INVESTENT DISCIPLINE

       2.5 DECENTRALIZED
       MANAGEMENT

       2.6 ESG
2. OUR BUSINESS MODEL
NON USUAL
MULTI-
A NECESSARY COMMERCIAL TECHNOLOGICAL
GEOGRAPHICAL DIVERSIFICATION, PORTFOLIO,
BALANCE AS A DEFENSE A FLEXIBILITY
TOOL INSTRUMENT
INVESTMENT DECENTRALIZED ESG
DISCIPLINE MANAGEMENT, INTEGRATED IN OUR
AND RETURN FOR VALUE BUSINESS MODEL
EXIGENCE GENERATION
112.1 GEOGRAPHICAL BALANCE SALES BY GEOGRAPHY 2019 • Healthy geographical balance in sales and
results.
• Defensive tool against different cycle
26,9% momentum in the diverse geographies.
26,5% EUROPE • Represents a key competitive advantage
NORTH AMERICA when servicing global platforms.
• 112 production sites.
• ≈ 28,000 employees.
• 10 R&D centres.
TOTAL • 4 main markets.
3,461.1 • > 7,000 references.
million euros
2018
18% 11%
BRAZIL
ASIA
9,4% 21,9%
BRAZIL ASIA TOTAL
25%
18% 3,029.5 NORTH
MCIE million euros AMERICA
EUROPE
15,3%
MCIE EUROPE 28%
EUROPE
EX MCIE
122.2 COMMERCIAL DIVERSIFICATION SALES BY CUSTOMER 2019
• Limited dependence on single customer,
platform or car model enabling price
defense.
• Both direct sales to OEMs and Tier 1s (circa
70% - 30%).
• Clients focused on different end market
segments which provides additional
diversification.
• Solvent, assorted and continuous quotation
requests, which allows us investment
choice by profitability return criteria.
TOTAL
3,461.1 2018
million euros
*OTHERS: JTEKT, TATA, DAF, MAN, AAM,
BMW, SCHAEFFLER GROUP, THYSSEN
KRUPP, ACI Y DACIA, TRW, KS,
KOLBENSCHMIDT, AUDI, MARUTI-SUZUKI,
BROSE, HYNDAI, KIA, OPEL, SCANIA,
LEAR…
*Includes 3% of BBAC (BAIC-DAIMLER JV) sales.
**Includes 1% of SGM (SAIC-GM JV) sales.
132.3 MULTI-TECHNOLOGICAL PORTFOLIO SALES BY TECHNOLOGY 2019
• One-stop shop for customers, offering the
21% whole range of the existing technologies
METAL to produce components.
STAMPING AND
• Enabling the selection of the technology
21% TUBE FORMING
that better fulfills changing customers
FORGING
needs.
TOTAL
18% • Allowing CIE to direct investments on
3%
3,461.1 MACHINING winning technologies anytime.
• Allowing to produce multi-technological
CASTING million euros parts.
10%
4%
ALUMINIUM CASTING 2018
16%
9%
11% ROOF SYSTEMS ALUMINUM
PLASTICS
26%
FORGING
16% TOTAL
PLASTIC &
ROOF SYSTEMS
3,029.5
million euros
TECHNOLOGY BY GEOGRAPHICAL AREA
TOTAL MACHINING STAMPING FORGING PLASTIC ALUMINIUM ROOF SYSTEMS CASTING
23%
EUROPE 44 15 5 6 5 7 6 22% MACHINING
STAMPING &
NORTH AMERICA 19 6 5 2 3 1 2 TUBE FORMING
BRAZIL 15 3 4 1 5 1 1
ASIA (INDIA & CHINA) 32 3 6 8 1 3 9 2
TOTAL 110 27 20 17 14 12 17 3
142.3 MULTI-TECHNOLOGICAL PORTFOLIO
FORGING CRANKSHAFT
Engine
CV- JOINTS
Transmission
CV- JOINTS
Transmission
AXLE SHAFT
Transmission
AXLE BEAM
Commercial
Vehicles
ALUMINIUM
GEARBOX HOUSING eREDUCER HOUSING LADDER FRAME STEERING HOUSINGS CAMSHAFT COVER
Gearbox xEV Gearbox Engine Steering Engine
CASTING
TURBO HOUSING CRANKSHAFT DIFFERENTIAL HOUSING BRAKE DRUM AXLE ARM
Engine Engine Transmission Brakes Structural Parts
MACHINING
HUBS, OUTER RINGS EPS COMPONENT DIFFERENTIAL CASE FLANGE AXLE SHAFT
Chassis Steering Transmission Transmission Commercial
Vehicles
152.3 MULTI-TECHNOLOGICAL PORTFOLIO
TUBE FORMING
STAMPING & STEERING COLUMNS BRAKE BOOSTER / BATTERY PACK COVER STRUCTURAL PARTS POWER ELECTRONIC
Steering I-BOOSTER xEV Chassis & Chassis & COVER
Brakes Structural Parts Structural Parts xEV Electronics
PLASTIC
EMBLEMS & INMOLD CONNECTORS & LOAD FLOOR ARM REST, CUP HOLDER, WHEEL COVERS,
DECORATION JUNCTION BOXES Composite Spray Molding & Thermoforming PILARS, GRAB HANDLES, REAR-VIEW MIRRORS,
Interior & Exterior Trim Electronics Interior trim SPEAKER GRILLS… DOOR HANDLES
Interior Trim Exterior Trim
TECHNOLOGY ROOF SYSTEM
ROOF SUNSHADES FIXED ROOF MODULES OPENING ROOF FLUSH WINDOWS SUNSHADES
Shading Roofs MODULES Doors & Windows Shading
Roofs
MULTI-
BATTERY BOX BATTERY BOX BATTERY BOX DIESEL & GASOLINE DIESEL & GASOLINE
PLASTIC - COMPOSITE STAMPING ALUMINIUM INJECTION RAILS INJECTION RAILS
FORGING AND TUBE FORMING
xEV Chassis & xEV Chassis & xEV Chassis & MACHINING
Structural Parts Structural Parts Structural Parts Engine
Engine
162.4 INVESTMENT DISCIPLINE
STANDARD Valid to produce for different customers and platforms,
allowing high saturation of productive capacity.
FLEXIBLE
MACHINERY ≈4% recurrent investment level that allows maintenance and
market organic growth.
STRICT Investment analysis discipline, always requiring high returns.
INVESTMENT Investments ≥ 20% ROI.
DISCIPLINE Operating Working Capital ≈0.
EBITDA Operational efficiency, together with capex control and
finance/tax strategies, enables a high average conversion of
CONVERSION the EBITDA into Cash.
INTO CASH
> 55% conversion level target.
172.5 DECENTRALIZED MANAGEMENT
CASH FLOW
FOCUS
INDIRECT
TEAM PEOPLE
COMMITMENT PRODUCTIVITY
FAST AND DECENTRALIZED
OBJECTIVE:
SIMPLE MANAGEMENT
DECISION STRUCTURE
VALUE
MAKING
UNIVERSAL,
GENERATION NETWORK
SERVICES
FLEXIBLE,
MULTITASK SUPPORT
ENTREPRENEURS
VARIABLE AND
LEAN
LONG-TERM
HEADQUARTERS GLOCAL INCENTIVES
PRESENCE
AND
ORDERS
1819
2.5 DECENTRALIZED MANAGEMENT
ORGANIZATION CHART2.6 ESG - ENVIRONMENTAL
TRIPLE CERTIFICATION
Closing in Triple Certification at all factories: IATF 16949, ISO
14001 and OSHAS 18001.
ENVIRONMENTAL FOOTPRINT
Development of advanced calculations of the Environmental
Footprint of the company’s products.
CARBON EMISSION COST
Inclusion of the Carbon Emission Cost as a new environmental
performance indicator.
CIRCULAR ECONOMY MODEL
Moving towards a Circular Economy Model with the aim of
reducing the intake of materials and the production of virgin
waste by closing economic and ecological loops.
Balancing industrial activity with minimum environment impact:
Skilled knowledge on production processes enables us for
CONSUMPTION OPTIMIZATION AND MATERIALS REUSE
202.6 ESG - ENVIRONMENTAL SUSTAINABLE R&D
CIE Automotive collaborates with a number of associations on a range of research programs.
Every year we earmark approx. 2% of our revenue to this effort across its 10 R&D centers, taking
a multi-technological and multi-materials approach.
The R&D roadmap initiatives are focused on tackling the challenges posed by the transformation unfolding in the sector:
SLOW BUT
VEHICLE PRODUCT AND NEW MOBILITY STEADY
EMISSION PROCESS CONCEPTS ELECTRIFICATION
STANDARDS DIGITALISATION (COMFORT) OF THE
SECTOR
212.6 ESG - SOCIAL COMMITMENT TO STAKEHOLDERS
IDENTIFICATION OF NINE GROUPS OF STAKEHOLDERS
Stakeholders: shareholders, professionals, customers, business partners, suppliers, society, public
authorities, automotive sector and financiers.
GLOBAL ROLL OUT OF OUR CSR WORKSHOPS
• Attended by local executives and managers.
• External and internal analysis of the key issues in the ESG arena.
• Prioritization of the issues identified as relevant.
DECENTRALISED MANAGEMENT MODEL
• Model that eases community engagement decisions and aligns them with each country’s
specific needs.
• More than 90% of plant managers are local.
STRATEGIC ALLIANCE WITH SAVE THE CHILDREN
First community project at corporate level: “Caminando hacia el futuro” (“Walking towards the
future”). A collaborative agreement for training support to youth in Mexico.
222.6 ESG - SOCIAL HUMAN RESOURCES
ZERO TOLERANCE WITH DISCRIMINATION
• Work environment free of bias on the grounds of gender, race, religion, age, sexual orientation, nationality, civil
status or socio-economic background.
• Approval of Corporate Equality Plan in order to reduce the salary gap and to get closer to effective gender equality
by job category.
ZERO TOLERANCE STANCE ON CHILD AND FORCED LABOUR
COLLECTIVE BARGAINING AGREEMENTS
• Employees’ freedom of association and right to collective bargaining.
• All of the agreements make special mention of workplace health and safety matters.
PEOPLE MANAGEMENT MODEL
• Creation of employee skill profiles.
• Evaluation of executive, middle management and skilled workers' job performance.
• Identification of areas for improvement. Continuous training.
• Career Development Programme.
• Global training on human rights matters.
EMPLOYEE ASSISTANCE MEASURES
• In 2019, over €30 million spent in employee support measures in the areas of health, food services, transport and
education.
• Compliance with and often exceeding the minimum wage requirements in each country.
• Development of work-life balance measures.
232.6 ESG - SOCIAL
GREEN SUPPLY CHAIN
A SUPPLIER
PORTAL We share
to facilitate end- OVER 90% OF information Standardisation
to-end SUPPLIERS OVER 20% OF about our supply of the global
management and of the product SUPPLIERS chain and requirement to
to ensure that families deemed of productive FOSTER EMBED ESG
the procurement subject to material have TRAINING CRITERIA INTO
model is framed assessment are ENVIRONMENTAL at small and AUDITS OF
by the criteria of IATF 16949 or MANAGEMENT medium sized SUPPLIERS
OBJECTIVITY, ISO 9001 CERTIFICATIONS. enterprises by of productive
IMPARTIALITY CERTIFIED. leading by material.
AND EQUAL example.
OPPORTUNITIES.
242.6 ESG - GOVERNANCE
CORPORATE GOVERNANCE DRIVEN BY PRINCIPLES OF ETHICS AND
TRANSPARENCY.
Responsibility for oversight of due compliance with the Code of Conduct and the various emanating
corporate policies are vested in the Corporate Social Responsibility Committee, which reports to the Board
of Directors.
CIE Automotive, S.A. makes it possible for all people who are part of the organization and its stakeholders
to submit doubts and notify irregularities or breaches against ethics or integrity or that infringe the
guidelines established in the Code of Conduct through the Whistle-Blowing Channel.
Upholding Spanish Law and international Directives on non-financial information and diversity.
CLOSING OF THE 2018-2019 CORPORATE STRATEGIC PLAN, DESIGNED TO
STANDARDIZE AND EMBED ESG CRITERIA ACROSS THE GROUP.
Consolidation of the compilation process of non-financial information.
External assurance for GRI indicators.
Development of ESG targets for each department.
Implementation of a CSR working methodology that can grow with CIE Automotive.
Development of a communication methodology with stakeholders.
252.6 ESG - GOVERNANCE
1 Signatory Member of the United Nations Global Compact and its Spanish Network,
for the implementation of the 10 Universally Accepted Principles to encourage
business social responsibility in the areas of human rights, labour, environment
conservation and anticorruption.
2 Pledge to contribute to sustainable development by upholding 8 of the 17
Sustainable Development Goals at the heart of the 2030 Agenda for Sustainable
Development.
3
Commitment to ethical and sustainable development in the management model.
262.6 ESG - FTSE4GOOD FTSE4Good INDEX SERIES CONSTITUENT
FTSE Russell confirms that CIE Automotive S.A. has been
independently assessed according to the FTSE4Good criteria,
and has satisfied the requirements to become a constituent of
the FTSE4Good Index Series.
Created by the global index provider FTSE Russell, the
FTSE4Good Index Series is designed to measure the
performance of companies demonstrating strong Environmental,
Social and Governance (ESG) practices.
The FTSE4Good indices are used by a wide variety of market
participants to create and assess responsible investment funds
and other products.
272.6 ESG - SUSTAINABLE FINANCING
CIE AUTOMOTIVE ARRANGED AN €80 MILLION
BILATERAL SUSTAINABLE LOAN WITH BBVA
Score provided by ESG performance A fresh milestone
Terms tied to
Vigeo Eiris an will be evaluated in our CSR
the ESG score
environmental during the life of commitment
consultant the loan
283.0 UPDATE ON
RESULTS:
3.1 RESULTS
3.2 BALANCE SHEET
3.3 CASH FLOW
3.4 FORECASTS 2020JUNE 2020 HIGHLIGHTS H1 2020
01 EBITDA Q2 2020
+13.2 €Mio CIE MARKET
QUARTER DROP >60%
02 Net Income
H1 2020 58.3 €Mio CIE MARKET
HALF-YEAR DROP >40%
03 Operating Cash +64.2 €Mio MANAGEMENT MODEL
FOCUSED ON
Generation H1 2020 46% OPERATING CASH / CASH GENERATION
EBITDA
04 TARGET PRICE
Analyst
recommendation
100% DO NOT SELL CONSENSUS
22.33€
1,130 €Mio
Cash and temporary financial
05 Liquidity Reserve investments: 568 €Mio
Undrawn funding: 562 €Mio
MAINTAINING OUR
06 Dividends and own
shares acquisition
106.5 €Mio COMMITMENT WITH
SHAREHOLDERS
07 Workforce
24,078
Vs 28.124
(Dec 2019)
EMPLOYEES
CIE Market: Motor vehicles production IHS JUNE 2020 (6 months 2020) (growth % in units), weighing the markets in which CIE has production plants
30JUNE 2020 HIGHLIGHTS H1 2020
JUST TWO CRITICAL MONTHS
April with 20% production(*) and May with 35%. In June, with 60% of production(*) we
achieve important net income
DEBT REDUCTION
The debt peak reached in May has already begun to decrease in June with the large cash
generation
FINANCIAL STRATEGY
With our income statement and our cash generation capacity, we have not had to change
the Group's financial strategy, focused on three areas:
• Remuneration of our shareholders: dividends and repurchase of own shares for
capital reduction
• Organic and inorganic growth plan: we are the integrating company in the sector that
will allow us to continue increasing our market share and value generation
• Net Working Capital Growth
WE ARE A BENCHMARK WITHIN THE INDUSTRY
At 60% of production level(*) in the first half of the year we have achieved Ebitda close to
13%, the standard margin of the sector in a normal situation
(*) Production on normalized conditions
31JUNE 2020 RESULTS SALES EVOLUTION 2020 – 2019
CONSTANT EXCHANGE RATE CIE MARKET CIE
NORTH
CHINA 68.0%
AMERICA
EUROPE
-34.3%
-19.6%
-39.9%
-31.5%
-40.5% INDIA
BRAZIL
-41.5% -40.8%
-51.2% -51.0%
CIE Market -40.4%
+12.6 P.P.
CIE -27.8%
Source: Motor vehicles production IHS JUNE 2020 (6 months 2020) (growth % in units).
32 The evolution of the production volume is calculated by weighing the markets in which CIE has production plantsJUNE 2020 RESULTS RESULTS H1 2020
(€ Mio) 30/06/2019 30/06/2020
Turnover 1,702.4 1,208.2
EBITDA 308.0 153.5
% EBITDA on turnover 18.1% 12.7 %
EBIT 226.6 90.2
% EBIT on turnover 13.3% 7.5%
Profit for the year 168.7 56.9
Net income 150.1 58.3
Despite the global paralysis of the economy, the strength of CIE model allows for positive closing
in all the lines of the income statement
Ebitda margin ≈ 13%, falls only 3 p.p. on CIE’s operating margins (Ebitda pro forma ≈16%; Ebit
Pro forma ≈ 11%)(*)
33 (*) Ebitda y Ebit proforma 2019, diluted after the last integrationsJUNE 2020 RESULTS RESULTS Q2 2020
(€ Mio) 2Q 2019 2Q 2020
Turnover 890.3 386.2
EBITDA 157.0 13.2
% EBITDA on turnover 17.6% 3.4 %
EBIT 113.7 (14.1)
% EBIT on turnover 12.8% -3.7%
Profit for the year 86.0 (20.1)
Net income 77.5 (14.5)
In the worst market context, CIE closes a second quarter with positive Ebitda
34JUNE 2020 RESULTS 2020 DIVISIONS CONTRIBUTION
6.5% 6.5%
25.3% 24.5% 25.6% 34.2%
TURNOVER EBITDA
3.5%
13.2%
30.5% 30.2%
Brazil North America Europe MCIE Asia (*)
Europe (India/China)
(*) China turnover: 182 €Mio.
35JUNE 2020 RESULTS 2020 DIVISIONS PROFITABILITY
NORTH BRAZIL EUROPE MCIE ASIA (INDIA &
AMERICA EBITDA EUROPE CHINA)
EBITDA 17.7% 12.6% EBITDA 12.6% EBITDA 3.4% EBITDA 12.9%
EBIT 12.5% EBIT 7.6% EBIT 6.6% EBIT -1.3% EBIT 8.2%
Despite the effects of COVID-19, half-year margins demonstrate the excellence of CIE's
management model and team
We have faced this great crisis with a socially responsible attitude, proof of our constant
and firm commitment to society
363.1 RESULTS 2014-2020 QUARTERLY EVOLUTION
Net income (M€)
1Q 2Q 3Q 4Q
History supports our growing path and our commitment to
growth: 25 consecutive quarters beating quarterly record
37BALANCE SHEET
BALANCE SHEET EVOLUTION
€ Mio 31/12/2019 30/06/2020
FIXED ASSETS 3,393.5 3,405.7
NET WORKING CAPITAL (275.5) (196.7)
TOTAL NET ASSETS 3,118.0 3,209.0
EQUITY 1,235.0 1,051.1
NET FINANCIAL DEBT 1,522.0 1,778.3
OTHERS (NET) 361.0 379.6
TOTAL NET LIABILITIES 3,118.0 3,209.0
Non-recourse factoring 222.2 € Mio 125.8 € Mio
38BALANCE SHEET CASH FLOW
EBITDA 153.5 (€Mio) 31/12/2019 30/06/2020
Financial Expenses (17.7)
Maintenance Capex (37.1) NFD 1,522.0 1,778.3
Tax Payments (21.4)
IFRS 16 Leases (1) (13.1) Adjusted NFD 1,505.3 1,770.8
OPERATING CASH FLOW 64.2
NFD/EBITDA
% EBITDA (4) 45.7% NFD/EBITDA NORMALIZED
3.91X 2.67X
Growing Capex (37.1)
Net Working Capital Variation (87.4)
Payments of Dividends (47.7) 18 months of covenant waiver for
Transactions with own shares (58.8) financial covenants up to 30/06/2021
Payments of previous acquisitions (2) (17.2)
Business Combination of the year (3) (79.0)
Exchange rate effect in NFD (12.4) LIQUIDITY RESERVE
Other movements 19.1 30/06/2020:
FINANCIAL CASH FLOW (256.3)
(1) Payment of rental fee accounted in EBITDA according to the new IFRS 16 regulation.
1,130 €Mio
(2) Pending payments from the acquisition of the solar roof systems of Inteva in 2019.
(3) Acquisition of the gear business of Somaschini S.p.A. (70 € Mio) and additional shares of Mahindra CIE Ltd.
(4) Operating cash flow on the Ebitda value corrected with the effect of IFRS 16.
(*) NFD and Ebitda data adjusted considering 50% of JV China SAMAP
39 39FORECASTS 2020
COVID-19 comes at an
optimal time for CIE, with all
the integrations finished and
the production plants with
high levels of profitability
and operating cash
generation.
40FORECASTS 2020
The worst of this crisis is over, our clients have returned to
business, and CIE is in a favorable competitive position
based on the strenghts of its business model:
FLEXIBILITY DECENTRALIZATION GEOGRAPHICAL
MULTILOCATION DIVERSIFICATION
We have the fixed The local Our global demand
cost structure and management of our does not depend
the management companies avoids the on the volume of a
model that best problems derived single country
adapt to variable from the lack of
volumes mobility of people in
all countries
41FORECASTS 2020
With current market estimates, the
second half of the year will be
better in sales and margins and
will allow us to continue with our
financial strategy focused on
shareholders’ remuneration
(dividend payments and
repurchase program) and debt
reduction
424.0 CIE IN STOCK
EXCHANGECIE IN STOCK EXCHANGE SHARE EVOLUTION VS NET RESULT EVOLUTION
CIE Share Price Evolution (Cumulative) CIE Net Result Evolution (Cumulative)
450%
413%
400%
334%
350%
300% 261% 249pp
250%
200% 170%
203%
150% 111% 168% 164%
100% 131%
39% 93%
50%
41%
0%
-50%
2013 2014 2015 2016 2017 2018 2019
…but a significant mismatch
has arisen during the 2017-
CIE’s share price evolution has performed almost in line with net
2019 period, with CIE’s
income evolution during the period from 2013 through 2017…
valuations severely and
baselessly decreasing.
44CIE IN STOCK EXCHANGE CIE SHARE PRICE PERFORMANCE 2018-2020YTD
60%
CIE Automotive IBEX 35 STOXX Europe 600 Automobiles & Parts (1)
40%
20%
0%
-20%
-31 %
-32 %
-40% -32 %
-60%
Since mid-2018 and coinciding with the entry of CIE Automotive in Ibex 35, financial markets and Auto sector have been
heavily impacted both by geopolitical and macroeconomic issues (US-China and US-EU trade war, Brexit, global
economic slowdown) as well as Auto sector specific issues (new emissions regulations, postponement of purchases
due to lack of clarity in time horizons, drop in demand for economic uncertainty).
Despite this extremely complex context, CIE Automotive has delivered quarter after quarter outstanding financial
results, what, clearly, hasn’t been reflected in its share price performance.
But in beginning 2020, environment has become even more complicated due to Covid-19 worldwide crisis, which is
severely affecting both economic activity and financial markets.
STOXX Europe 600 Automobiles & Parts includes: OEMS: BMW ST, Daimler, Ferrari NV, Fiat, Peugeot,
(1)
Porsche, Renault & Volkswagen. SUPPLIERS: Faurecia, Michelin, Nokian, Plastic Omnium, Rheinmetall, Schaeffler,
Valeo.
45CIE IN STOCK EXCHANGE
EVOLUTION IN STOCK EXCHANGE
2020
2019 2018 2017(1) 2016(1) 2015(1) 2014(1)
Until 31/08
Market Cap (€ Mio) 1,871 2,719 2,766 3,123 2,388 1,993 1,453
Number of shares (Mio) 129 129 129 129 129 129 129
Last price of period (€) 14.50 21.08 21.44 24.21 18.52 15.45 11.27
Maximum price of period (€) 21.98 26.08 36.30(1) 26.20 18.98 15.46 12.29
Minimum price of period (€) 9.71 19.31 19.90 17.15 11.98 10.65 7.21
Volume (thousand shares) 57,266 57,296 87,149 59,318 59,065 60,619 62,970
Effective (€ Mio) 0,925 1,328 2,327 1,244 940 814 600
Source: Madrid Stock Exchange.
(1)Upon such dates, CIE Automotive’s subsidiary “Global Dominion Access S.A.” (Dominion) was still within CIE Automotive’s perimeter. CIE Automotive’s shares of Dominion where distributed as dividend
in kind to CIE Automotive’s shareholders upon July 3rd, 2018, with a consequential reduction in CIE Automotive’s share price from that date.
46ANALYSTS RECOMMENDATIONS
# COMPANY ANALYST RECOMMENDATION PRICE
1 Alantra Equities Álvaro Lenze BUY €20.60
2 Bankinter Esther Gutiérrez BUY €21.80
3 BBVA David Díaz Rico OUTPERFORM €24.90
4 Caixabank BPI Bruno Filipe Bessa HOLD €21.00
RECOMMENDATIONS
5 Exane BNP Paribas Francisco Ruiz HOLD €16.50
6 Fidentiis Enrique Yáguez UNDER REVIEW - Under Review Buy +
13% Outperform
7 Intermoney Valores Virginia Pérez BUY €22.00 67%
8 JB Capital Markets José María Cánovas BUY €31.00
9 Kepler Alexandre Raverdy BUY €20.00 Hold
20%
10 Link Securities Iñigo Isardo UNDER REVIEW -
11 Mirabaud Gonzalo De Cueto BUY €21.30
12 Nau Securities Pedro Baptista BUY €27.00
13 Renta 4 Iván San Félix OUTPERFORM -
14 Sabadell Alfredo Del Cerro BUY €20.97
15 Santander Robert Jackson HOLD €17.50
CONSENSUS - - €21.71
475.0 APPENDIX
APPENDIX I   ALTERNATIVE PERFORMANCE MEASURES (APMs)
              In addition to the financial information prepared in accordance with generally accepted accounting standards (IFRS), CIE Automotive Group uses in the
              management of the business recurrently and consistently certain Alternative Performance Measures (‘APMs’), which include concepts about result,
              balance and cash flow, understanding that they are useful to explain the evolution of their activity. Below is a breakdown of all the APMs used in this
              document, as well as their definition and reconciliation with the financial statements.

             PERFORMANCE MEASURES                 DEFINITION

              EBITDA                              Net Operating Income + Recurrent Depreciation.

              Adjusted EBITDA                     Annualized EBITDA of 12 last months in those companies incorporated to the perimeter during the period. It includes
                                                  50% of the Ebitda of Chinese JV SAMAP, which based on the current agreements with the partner, is consolidated by
                                                  the equity method.
              EBIT                                Net Operating Income.
              EBT                                 Earnings Before Taxes.
              Net Income                          Profit attributable to the company´s shareholders.
              Net Financial Debt                  Debt with banks and other financial institutions – Cash and equivalents – Other current and non-current Financial
                                                  Assets.
              Adjusted Net Financial Debt         Net Financial Debt including 50% of Chinese JV SAMAP net financial debt, consolidated by the equity method as per the
                                                  current partner agreements reached.
              Normalized NFD/EBITDA               Net Financial Debt including 50% of Chinese JV SAMAP net financial debt, on the las 12 months Ebitda, eliminating the
                                                  negative effects of 1Q due to Covid-19.
              RONA = “Return on Net Assets”       EBIT last 12 Months/ Net Assets (Fixed Assets + Net Working Capital - Goodwill not associated to cash outs).

              Fixed assets                        Tangible assets and Intangible Assets, including Goodwill and without including rights of use over leased assets (IFRS
                                                  16).
              Maintenance CAPEX                   The one related to the renovation of the facilities to face market growth.

              Operating cash flow (%)             EBITDA – Financial expenses paid – Tax payments – Maintenance CAPEX – Leases under IFRS 16

    49
APPENDIX II – 2019 ACQUISITIONS CIE GOLDE
PROFILE TRANSACTION
Specialisation Rationale
Design, engineering and • To reinforce its commitment to comfort systems and
manufacture of roofs for vehicles. increase its presence in the roof system segment. The
Footprint target company’s customers, markets and products
United States, Mexico, Germany, notably complement those of Advanced Comfort Systems
Slovakia, Romania, China and India. (ACS), the roof system unit CIE Automotive acquired in
No. of facilities 2009, since when it has doubled its revenue and boosted
12 factories. its EBITDA margin by 10 points.
6 R&D centres. • To become one of the top three global players in the
No. of employees roof system niche, which has been growing consistently
in recent years and not been affected by the
>2,700 employees.
hybridisation/ electrification processes.
Customers • To consolidate its strategic commitment to innovation
Top automotive OEMs.
and high-tech engineering by gaining access to new
2018 revenue highly complex and sophisticated products and
Almost 850 M€, including 50% of processes.
the SAMAP joint venture Price paid
Approx. 741 M€ (Enterprise Value ≈ 670 M€).
Transaction announcement date
17 September 2018.
CIE Transaction close
6 May 2019.
GOLDE
Roof Systems
Division of Inteva
50APPENDIX II – 2019 ACQUISITIONS AEL
PROFILE TRANSACTION
Specialisation Rationale
Aluminium injection • To add aluminium injection moulding technology in one
moulding. of the most promising markets - India - and diversify
Footprint MCIE India’s business, strengthening its presence in the
India. two-wheel segment.
No. of facilities • AEL is a key supplier for a considerable number of
3 factories. OEMs and Tier 1 suppliers in the passenger and two-
wheel vehicles segments in India and internationally. It
No. of employees
makes a large variety of bodywork, brake and engine
>2,300 employees.
parts using high-pressure and gravity injection processes.
Customers AEL also has machining, thermal treatment, coating,
OEMs and Tier 1 suppliers. assembly and leak testing capabilities, as well as modern
Passenger and two-wheel vehicles. tools and moulds.
2018 revenue Price paid
Approx. 108 M€ Approx. 111 M€ (Enterprise Value ≈ 111 M€).
Transaction announcement date
12 March 2019.
Transaction close
9 April 2019.
AEL
Aurangabad
Electricals Ltd.
51APPENDIX II – 2019 ACQUISITIONS CIE MAPREMEX
PROFILE TRANSACTION
Specialisation Rationale
Machined parts. • To leverage the acquired companies’ universe of
Footprint productive assets to complement CIE Automotive’s
México. existing manufacturing activities in Mexico and enable
No. of facilities physical and customer expansion going forward.
1 factory. Price paid
No. of employees Approx. 37 M€ (Enterprise Value ≈ 59 M€).
≈ 400 employees. Transaction announcement date
Customers 24 June 2019.
Tier 1 suppliers. Transaction close
2018 revenue 19 September 2019.
Almost 36 M€.
CIE
MAPREMEX
Maquinados de Precisión de
México S. de R.I. de C.V.
Cortes de Precisión de
México S. de R.I. de C.V.
52APPENDIX II – 2020 ACQUISITIONS CIE SOMASCHINI
PROFILE TRANSACTION
Specialisation Rationale
High precision gear systems and • Becoming a top global player within the
transmission solutions. precision gears segment, having presence within
Footprint the world’s largest 3 markets (Northamerica,
Italy and United States. Europe and Asia) and within various segments
No. of facilities (trucks, passenger vehicles, offroad, etc.). Being a
3 factories. global player means a clear competitive
No. of employees advantage when dealing with our clients.
• Somaschini provides further geographical
≈ 300 employees.
diversification and best in class technology with a
Customers very high degree of automatization.
OEMs, Tier 1s and Others │ Trucks,
passenger vehicles, industrial, and
Price paid
Approx. Enterprise Value 77 M€.
robotics.
2018 revenue Transaction announcement date
25 September 2019.
Almost 70 M€.
Transaction close
9 January 2020.
CIE
SOMASCHINI
SOMASCHINI-Somaschini
S.p.A.
SOM_NA-Somaschini North
America
SOM_SRL- Somaschini
Automotive SRL
53M A N A G I N G H I G H VA LU E A D D E D P R O C E S S E S 54
You can also read