Comparative analysis of the alveolar microbiome in COPD, ECOPD, Sarcoidosis, and ILD patients to identify respiratory illnesses specific microbial ...
←
→
Page content transcription
If your browser does not render page correctly, please read the page content below
www.nature.com/scientificreports
OPEN Comparative analysis
of the alveolar microbiome
in COPD, ECOPD, Sarcoidosis,
and ILD patients to identify
respiratory illnesses specific
microbial signatures
Shashank Gupta1,6,7, Malini Shariff2,7, Gaura Chaturvedi3,4,7, Agrima Sharma2,
Nitin Goel5, Monika Yadav6, Martin S. Mortensen1, Søren J. Sørensen1, Mitali Mukerji3 &
Nar Singh Chauhan6*
Studying respiratory illness-specific microbial signatures and their interaction with other micro-
residents could provide a better understanding of lung microbial ecology. Each respiratory illness
has a specific disease etiology, however, so far no study has revealed disease—specific microbial
markers. The present study was designed to determine disease-specific microbial features and their
interactions with other residents in chronic obstructive pulmonary diseases (stable and exacerbated),
sarcoidosis, and interstitial lung diseases. Broncho-alveolar lavage samples (n = 43) were analyzed by
SSU rRNA gene sequencing to study the alveolar microbiome in these diseases. A predominance of
Proteobacteria followed by Firmicutes, Bacteroidetes, Actinobacteria, and Fusobacteria was observed
in all the disease subsets. Shannon diversity was significantly higher in stable COPD when compared
to exacerbated chronic obstructive pulmonary disease (ECOPD) (p = 0.0061), and ILD patient samples
(p = 0.037). The lung microbiome of the patients with stable COPD was more diverse in comparison
to ECOPD and ILD patients (p < 0.001). Lefse analysis identified 40 disease—differentiating microbial
features (LDA score (log10) > 4). Species network analysis indicated a significant correlation (p < 0.05)
of diseases specific microbial signature with other lung microbiome members. The current study
strengthens the proposed hypothesis that each respiratory illness has unique microbial signatures.
These microbial signatures could be used as diagnostic markers to differentiate among various
respiratory illnesses.
Chronic obstructive pulmonary disease (COPD), interstitial lung diseases (ILD), sarcoidosis are dynamic, debili-
tating lung diseases with multiple comorbidities that affect millions of people w
orldwide1–3. COPD is character-
ized by persistent respiratory symptoms and airflow limitations due to airway and/or alveolar a bnormalities4.
Infections can further weaken the airway function and lead to the exacerbations of C OPD5. ILD is a heteroge-
neous group of respiratory disorders presenting with dyspnea, cough, and/or impaired pulmonary f unction6.
Radiologic and histopathologic evaluation of the lungs shows patterns of inflammation and fibrosis among ILD
patients7,8.
1
Section of Microbiology, Department of Biology, University of Copenhagen, 2100 Copenhagen,
Denmark. 2Department of Microbiology, Vallabhbhai Patel Chest Institute, University of Delhi, Delhi 110007,
India. 3Genomics and Molecular Medicine, CSIR-Institute of Genomics and Integrative Biology (CSIR -IGIB),
South Campus, Sukhdev Vihar, Mathura Road, New Delhi 110025, India. 4Academy of Scientific and Innovative
Research (AcSIR), Ghaziabad 201002, India. 5Department of Pulmonary Medicine, Vallabhbhai Patel Chest
Institute, University of Delhi, Delhi 110007, India. 6Department of Biochemistry, Maharshi Dayanand University,
Rohtak, Haryana 124001, India. 7These authors contributed equally: Shashank Gupta, Malini Shariff and Gaura
Chaturvedi. *email: nschauhan@mdurohtak.ac.in
Scientific Reports | (2021) 11:3963 | https://doi.org/10.1038/s41598-021-83524-2 1
Vol.:(0123456789)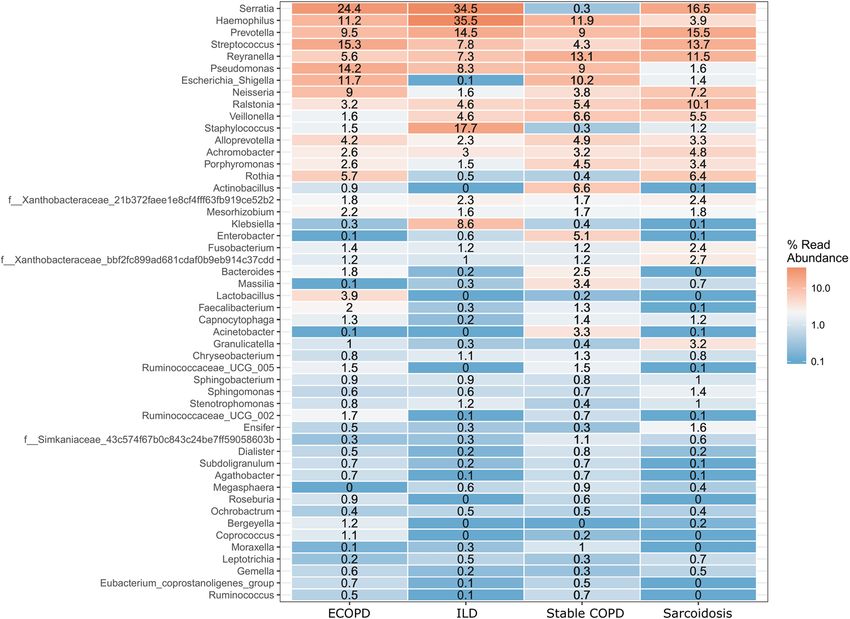
www.nature.com/scientificreports/
ECOPD (n = 13) Stable COPD (n = 14) Sarcoidosis (n = 8) ILD (n = 8)
Age, years 63.6 ± 5.79 53.6 ± 14.3 44.5 ± 13.1 53.5 ± 10.9
Sex (% male) 76.9 100 62.5 37.5
Smoker (n) 8 10 (3NA*) 1 (1NA*) 2
BME 5 (2NA*) 0 (3NA*) 3 (1NA*) 2
Table 1. Characteristics of the participants in this study. Data are presented as percentage value or mean ± SD
as appropriate. BME: Biomass Exposure. *Data not available.
These pathophysiological disorders alter lung physiology and could induce lung microbial dysbiosis9. Studies
have been initiated to define lung microbiome composition in health and disease subsets to identify microbial
markers for disease prognosis and timely therapeutic interventions10–13. Assessment of the temporal and spatial
organization of lung m icrobes14 and the disease-associated key microbes have also been r eported15,16. Several
studies have indicated lung microbial dysbiosis during the onset of various pathophysiological diseases when
compared to healthy c ontrols11,14–22. For instance, an abundance of Streptococcus, Corynebacterium, Alloiococ-
cus, Prevotella, Veillonella, Rothia, Porphyromonas, and Moraxella were associated with COPD patients14,15,17.
Haemophilus, Pseudomonas, and Moraxella microbial groups are reported to be enriched in the lung microbiome
during the onset of exacerbated COPD14,15,17,18. Similarly, an abundance of Veillonella, Megasphaera, Streptococcus,
Prevotella, Acidovorax was observed in the lung microbiome of patients with lung c ancer19. Lung microbiome of
the asthma patients showed enrichment of Haemophilus, Moraxella, Neisseria, Streptococcus, and Staphylococcus
microbial species20. Streptococcus, Prevotella, Veillonella, Rothia, Actinomyces, Gemella, Granulicatella, Fusobac-
terium, Neisseria, and Atopobium species are abundant in the lung microbiome of the Cystic fibrosis p atients21.
The lung microbiome of the sarcoidosis patients has the enrichment of Atopobium and Fusobacterium species22.
These studies have indicated lung microbial dysbiosis during the onset of various pathophysiological dis-
orders. Despite varied etiology, different pathophysiological conditions showed enrichment of almost simi-
lar microbial groups in each disease subset. Streptococcus, Prevotella, Veillonella, Rothia, and Moraxella are
over-represented in the lung microbiome of patients with COPD, cystic fibrosis, asthma, and lung c ancer14–22.
Similarly, Atopobium and Fusobacterium are found enriched within the lung microbiome of patients with cystic
fibrosis, sarcoidosis, and ILD21,22. These overlapping results limit the applicability of this information to develop
respiratory illness-specific molecular diagnostics. We hypothesized that patients with stable COPD, ECOPD
(exacerbated COPD), sarcoidosis, and other ILDs have varied disease etiology and each disease could have a
unique lung microbiome profile. The current study was designed to explore the composition and distribution of
microbial phylotypes in the disturbed physiological states of the lungs. A comparative lung microbiome analysis
between diseases, instead of comparison with healthy individuals could help to identify respiratory illness-specific
microbial markers that can be used for diseases-specific diagnosis. This attempt is a first of its kind to conduct
an alveolar lung microbiome comparison among disease subsets.
Results
Quality of the sequencing dataset. Fourteen patients with stable COPD, thirteen patients with exac-
erbations of COPD, eight patients with ILD, and eight patients with sarcoidosis were enrolled in this study
(Table 1, Supplementary Tables S1, S2, S3). A total of 1,282,459 raw reads were passed through the quality filter
and chimera detection resulting in 772,133 (mean per sample: 17,956 ± 1651) high quality and non-chimeric
reads. Based on dada2, amplicons were clustered into 2329 amplicon sequence variants (ASVs). The coverage of
our sequencing was assessed by rarefaction curves (Supplementary Fig. S1). ASV tables were rarefied to 4,351
reads per sample to remove the sequencing biases and represent 2162 ASVs across the 43 samples.
Alveolar microbiome composition. Microbial diversity analysis among different disease groups iden-
tified the prevalence of 19 bacterial phyla representing 120 families and 286 genera. Proteobacteria held an
overwhelming predominance with an average relative abundance of 58.67%, followed by Firmicutes (20.6%),
Bacteroidetes (15.11%), Actinobacteria (3.13%), and Fusobacteria (1.1%). The remaining 14 phyla were only
observed in a fraction of the samples with a combined average abundance of less than 1% (Fig. 1). Proteobacte-
ria were abundant in ILD patients with a relative abundance of 65.71% compared to exacerbated COPD, stable
COPD patients, and sarcoidosis patients, accounting for 56.54%, 59.68%, and 52.77%, respectively. In contrast,
Firmicutes were abundant in stable COPD and ECOPD patients, (17.43% and 23.89% of the relative abundance),
compared to ILD and sarcoidosis patients (Supplementary Table S4). At the family level, we observed the dif-
ference between the disease groups (Table 2 & Supplementary Table S5). The most abundant genera in the four
disease groups were visualized in a heat map (Fig. 2). A range of genera showed relatively lower abundance but
had high prevalence. These included Serratia, Prevotella, Streptococcus, Reyranella, Escherichia-Shigella, Neis-
seria, and Ralstonia (Fig. 2). Escherichia-Shigella, Haemophilus, Pseudomonas, and Serratia showed high vari-
ability among the four disease groups. Serratia was the most common genus in all groups except stable COPD.
Escherichia-Shigella was also consistent among COPD groups along with Pseudomonas. Enterobacter was dif-
ferentially abundant in stable COPD patients while Klebsiella and Staphylococcus were abundant in ILD patients.
Scientific Reports | (2021) 11:3963 | https://doi.org/10.1038/s41598-021-83524-2 2
Vol:.(1234567890)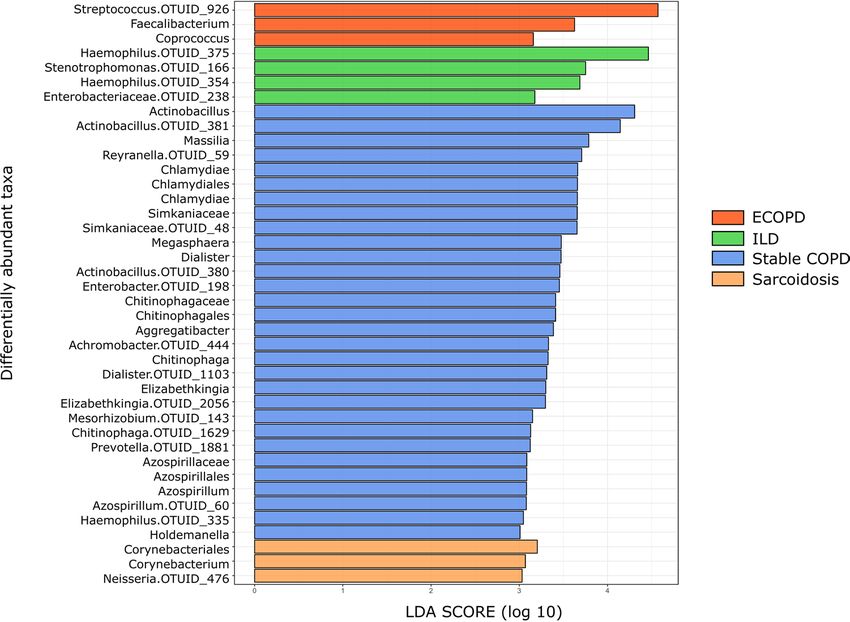
www.nature.com/scientificreports/

                                  Figure 1.  Microbiota composition at phylum level in each disease group. Stacked bar plot showing the mean
                                  relative abundance, at phylum level, for each disease. Phyla with a mean relative abundance below 1% for all
                                  diseases were excluded from the plot.

                                                      Exacerbation
                                   Family             COPD            Family              ILD     Family               Stable COPD   Family             Sarcoidosis
                                   Enterobacteriaceae 19.53           Enterobacteriaceae 22.98    Pasteurellaceae      12.61         Prevotellaceae     13.43
                                   Streptococcaceae   11.69           Pasteurellaceae     15.36   Reyranellaceae       11.90         Burkholderiaceae   12.09
                                   Prevotellaceae      8.02           Prevotellaceae       8.30   Prevotellaceae       10.92         Streptococcaceae   11.34
                                   Pseudomona-
                                                       7.96           Staphylococcaceae    7.77   Burkholderiaceae     10.10         Enterobacteriaceae 10.14
                                   daceae
                                   Pasteurellaceae     7.81           Streptococcaceae     7.34   Enterobacteriaceae    9.61         Reyranellaceae      8.62

                                  Table 2.  The five families most commonly identified from each disease groups and their percentage.

                                  Alpha diversity among disease groups. We found no significant difference in observed richness
                                  between the diseases (Fig. 3A; p = 0.099, Kruskal–Wallis test). However, using Shannon diversity index, we
                                  observed statistically significant differences between diseases (Fig. 3B; p = 0.001, Kruskal–Wallis test) with post
                                  hoc tests revealing higher diversity in stable COPD compared to ILD (p = 0.037), and sarcoidosis (p = 0.004)
                                  respectively; Mann–Whitney test, Bonferroni adjustment).

                                  Beta diversity among disease groups. Bray–Curtis based PCA plots were analyzed at the genus level
                                  to understand the community ordination (Fig. 4). This approach revealed extensive overlap in membership
                                  between the bacterial communities of the ECOPD, stable COPD, ILD, and sarcoidosis disease groups. The first
                                  two principal components accounted for 29.5% of variance explained, but we did not observe clear clustering.
                                  The PERMANOVA test was used to assess how much the overall variation could be explained in groups, indicat-
                                  ing no notable separation among the groups (p = 0.0610).

                                  Microbial taxa associated with disease groups. LEfSe identified 40 discriminative features, out of
                                  which, thirty taxa were discriminative for stable COPD patients, four taxa for ILD patients, and three taxa
                                  for ECOPD and sarcoidosis patients (Fig. 5). Taxa belonging to Firmicutes were significantly more abundant
                                  (p < 0.05) among ECOPD patients. Proteobacteria were more abundant among ILD patients, while Actinobac-
                                  teria and Proteobacteria were significantly more abundant (p < 0.05) in sarcoidosis patients. On the other hand,
                                  Chlamydiae along with Firmicutes and Proteobacteria were significantly more abundant (p < 0.05) in ECOPD
                                  patient’s lungs (Supplementary Table S6). In ECOPD patients, the microbiome was characterized by a prepon-
                                  derance of Streptococcus (LDA score [log10] > 4), whereas in the stable COPD patients, there was a preponder-
                                  ance of Actinobacillus (LDA score [log10] > 4). However, ILD patient`s microbiome showed a very high abun-
                                  dance of Haemophilus (LDA score [log10] > 4), while Corynebacterium was abundant in the sarcoidosis patient`s
                                  (LDA score [log10] > 3).

Scientific Reports |   (2021) 11:3963 |                   https://doi.org/10.1038/s41598-021-83524-2                                                                  3

                                                                                                                                                                Vol.:(0123456789)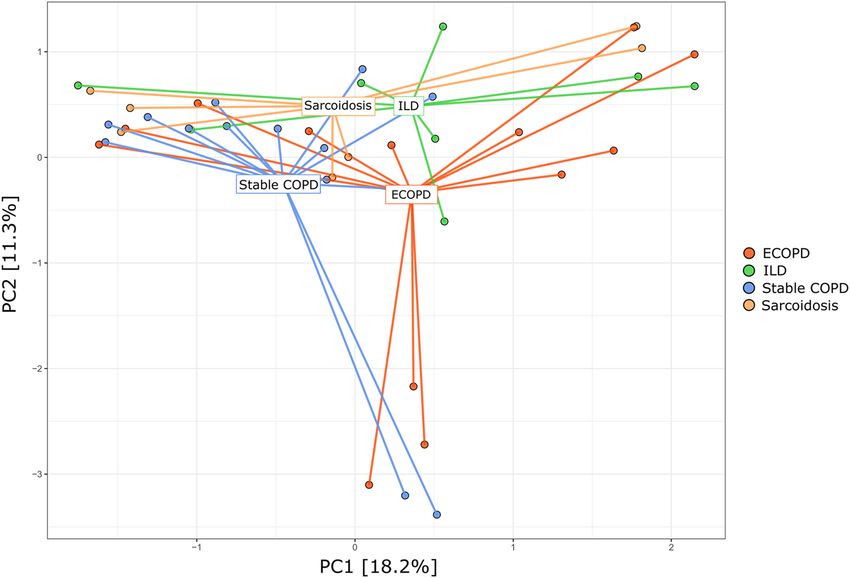
www.nature.com/scientificreports/

                                            Figure 2.  Heat map showing 50 most abundant genera in the four groups of samples. Columns represent the
                                            groups and rows the genera and their relative abundance. The color key represents the relative abundance of
                                            each genus.

                                            Figure 3.  Observed richness (A) and Shannon diversity index (B). Comparing two groups using Mann–
                                            Whitney test; ^comparing two or more groups using Kruskal–Wallis test. p < 0.05 denotes statistical significance.

          Scientific Reports |   (2021) 11:3963 |               https://doi.org/10.1038/s41598-021-83524-2                                                 4

Vol:.(1234567890)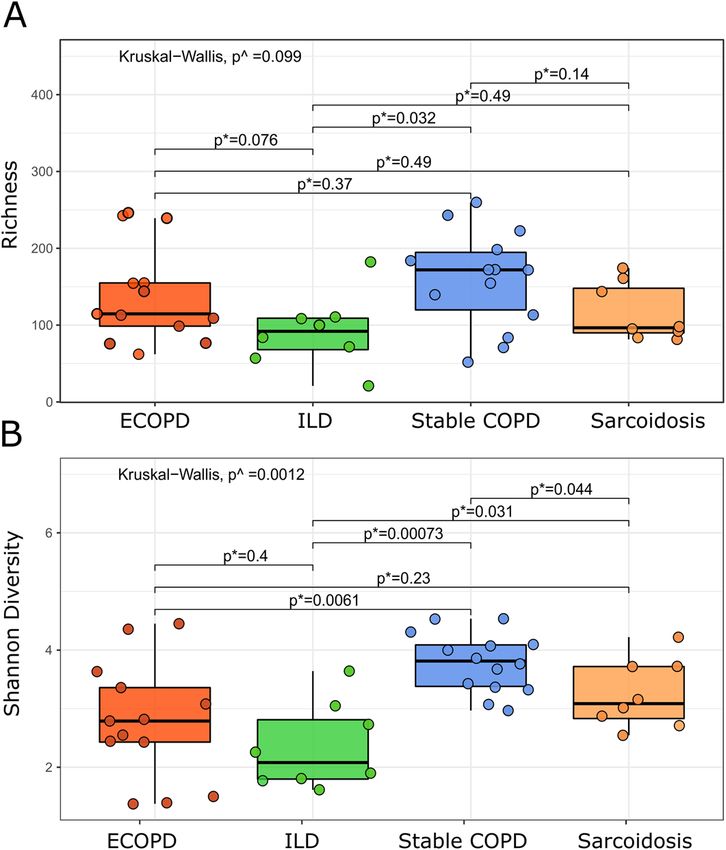
www.nature.com/scientificreports/

                                  Figure 4.  Principal component analysis. Dots represent samples and color represents different disease groups.
                                  First two principal components (PC) explained 29.5% of the variance.

                                  Figure 5.  LDA shows distinct lung microbiome composition associated with ECOPD, stable COPD, ILD and
                                  sarcoidosis. LDA scores as calculated by LEfSe of taxa differentially abundant in different disease group. Only
                                  taxa with LDA scores of more than three and p value < 0.05 are shown here.

                                  Functional annotation of the lung microbiome. Predicated phenotypes based on taxonomic classifi-
                                  cation indicated that the majority of microbes were mesophilic (> 65%), gram-negative (> 74%) Bacillus (> 62%).
                                  A majority of the lung microbes were generally considered to be associated with humans (> 60%), while the
                                  remaining microbes were not commonly associated with a specific environment (> 30%). The majority of the
                                  identified lung microbes predict a higher potential for the onset of various human disorders. The percentage of

Scientific Reports |   (2021) 11:3963 |               https://doi.org/10.1038/s41598-021-83524-2                                                    5

                                                                                                                                             Vol.:(0123456789)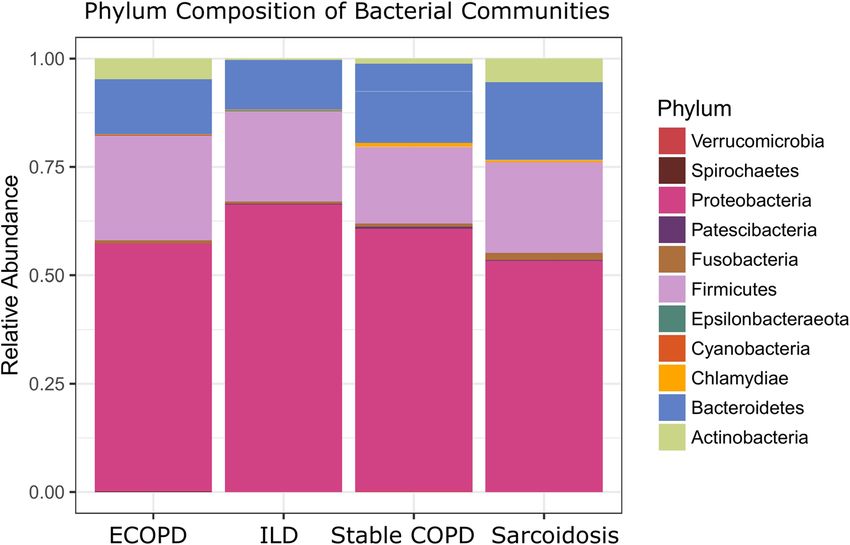
www.nature.com/scientificreports/
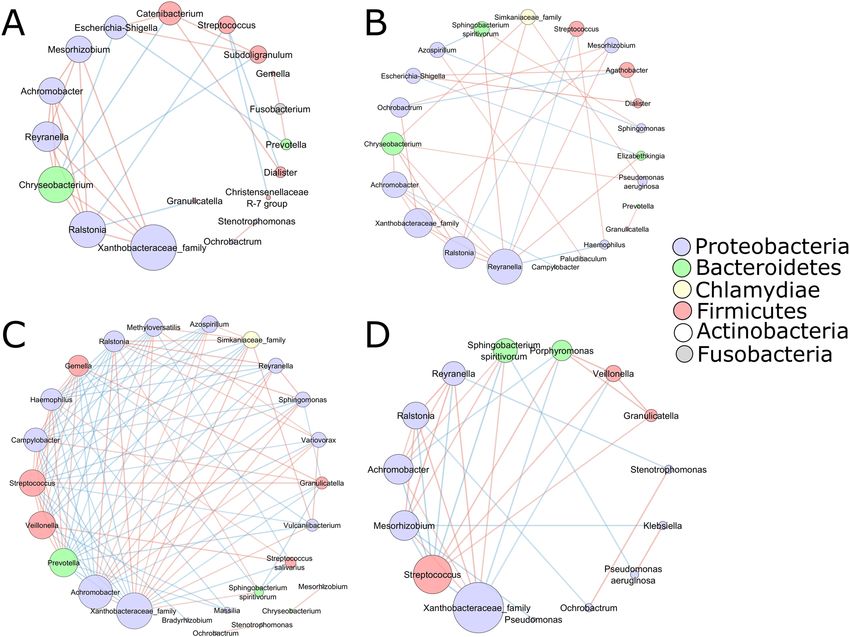
Figure 6. Bacterial co-existence and co-exclusion relationships with ASVs and different diseases. Each node
represents ASVs. Each edge represents a significant correlation colored by co-existence (orange) or co-exclusion
relationships (blue). The size of the node corresponds to its degree of connectivity, while edge lengths are
arbitrary. ECOPD (A), stable COPD (B), sarcoidosis (C), and ILD (D).
such microbes was higher in the samples from sarcoidosis and other ILD groups (> 71–85%) as compared with
the COPD group (62–70%). The majority of the microbes from COPD lung were found to play a significant role
in ammonia oxidation, sulfur metabolism, and complex carbohydrate catabolism. Lung microbes in sarcoidosis
and other ILD groups seemed to play a significant metabolic role in polyphenol metabolism and dehalogenation
reactions in addition to the function carried out by COPD inherent microbes.
Core microbiome and its association with diseases. Common members of a microbial commu-
nity often perform moderate functioning of the host-microbial symbiotic system. We estimated a high degree
of similarity between the core microbiome for each of the four diseases. Ten ASVs were shared among all of
them; these belonged to the genera Reyranella, Ochrobactrum, Mesorhizobium, Ralstonia, Achromobacter, Pseu-
domonas, Streptococcus, Granulicatella, and two unclassified genera belonging to Xanthobacteraceae. Moreover,
there were 11 ASVs unique to patients with sarcoidosis, three to ECOPD, 12 ASVs to stable COPD, and only two
ASVs to ILD (Supplementary Table S7, Supplementary Fig. S3).
To gain insight into the interaction between bacterial species in the lung microbiome, we performed a spe-
cies network analysis (only correlations with an absolute value of 0.60, p < 0.05). Examination of the microbial
network revealed that Xanthobacteraceae were highly connected with multiple other ASVs among all the disease
groups (Fig. 6).
In ECOPD patients Escherichia-Shigella (Fig. 6A) positively correlated with Subdoligranulum, Catenibacte-
rium, and negatively correlated with Chryseobacterium and Prevotella. Conversely, one of the most abundant
genera i.e., Streptococcus showed a negative correlation with Dialister, Ralstonia, and Christensenellaceae R-7
groups. However, the rest of the most abundant genera i.e., Serratia, Haemophilus, and Pseudomonas did not
correlate with any other genera. In the stable COPD subjects (Fig. 6B), the most abundant genus was Reyranella,
which was negatively correlated with Haemophilus and Streptococcus whereas positively correlated with seven
other genera that belong to Achromobacter, Chryseobacterium, Mesorhizobium, Elizabethkingia, Sphingobacte-
rium, Ralstonia, Xanthobacteraceae family. The other two most abundant genera were Escherichia-Shigella and
Scientific Reports | (2021) 11:3963 | https://doi.org/10.1038/s41598-021-83524-2 6
Vol:.(1234567890)www.nature.com/scientificreports/
Haemophilus, both of which belong to the Proteobacteria phylum. Escherichia-Shigella showed a strong positive
correlation with Dialister and Agathobacter, whereas it was negatively correlated with Elizabethkingia. On the
other hand, Haemophilus showed no correlation with any other genera.
The sarcoidosis disease group (Fig. 6C) had the most negative connections with other members of the micro-
biota. Most abundant genera belonged to Serratia, Prevotella, Streptococcus, Reyranella, and Ralstonia. Except
for the Serratia, which did not show any correlation, all other dominant genera showed a strong correlation
with other genera in the group. Prevotella and Streptococcus genera were mostly negatively correlated, whereas
Reyranella and Ralstonia showed a positive correlation.
In the ILD subjects (Fig. 6D), the most abundant genus, Hemophilus, did not show any correlation with others.
Moreover, Streptococcus sp. showed correlation with 11 out of 14 genera in this group. It was found to be posi-
tively correlated with three genera and negatively correlated with eight different genera. Despite the abundance
of the Klebsiella genera, it was positively correlated only with Pseudomonas aeruginosa and negatively correlated
with Mesorhizobium sp.
Discussion
The present results confirm earlier reports that the human respiratory tract contains a diverse microbiome23. Lung
microbiome composition is influenced by the onset of respiratory illness, as well as with the usage of steroids,
aerosols, and a ntibiotics24,25. During airway diseases, lung microbiome can exacerbate the diseases, leading to
increased levels of morbidity and mortality15. Using the NGS platform, diverse non-cultivable bacteria were found
in the respiratory tract10. This study has explored the alveolar microbiome of the patients with COPD (stable and
exacerbation), ILD, and sarcoidosis to understand the similarities & differences between the disease-associated
microbial phylotypes. We have accessed the composition, diversity, and core microbiome for each disease and
identified which aspects are related to lung diseases in general and which are diseases specific. Additionally, to
our knowledge, this is the first alveolar microbiome report among the Indian population.
It was found that the microbial members of the bronchial microbiome do not change significantly in
COPD patients26,27. However, the predominance of Proteobacteria in the present study is in line with previous
studies14,15,17,18. We observed a higher abundance of Firmicutes in stable COPD and ECOPD subjects compared
to ILD and sarcoidosis groups. We found a higher alpha diversity in the stable COPD group in comparison to
the other groups. A similar observation was found in previous s tudies14,28. Three taxa show a significant abun-
dance in ECOPD patients- Streptococcus, Faecalibacterium, and Coprococcus. Streptococcus is the most widely
recognized microbe found in COPD p atients14,17. Faecalibacterium is a common resident of the human gut, while
Coprococcus is usually found in the sputum, however, what role the latter two play in humans in the human lung
is still unexplored.
Few efforts have been made to explore lung microbiome in the patients with sarcoidosis and other types
of ILD23,29 and these studies were unable to differentiate the lung microbiome structure among these disease
subtypes23. We were able to identify differences in their microbial composition. We found an increase in Act-
inobacteria and a decrease in Proteobacteria in sarcoidosis patients as compared to ILD subjects. The increased
relative abundance of Streptococcus and Staphylococcus has been reported to contribute to disease progression
in idiopathic pulmonary fibrosis29. Similarly, we also observed a higher relative abundance of Streptococcus and
Staphylococcus in the ILD groups, as well as an increased alpha diversity in sarcoidosis compared to ILD patients.
Besides, PCA showed differences in microbial variation between COPD (stable and exacerbation), ILD, and sar-
coidosis patients. Moreover, current data show a significantly higher abundance of taxa belonging to the genera
Haemophilus, Stenotrophomonas, and Enterobacteriaceae family in the ILD group, whereas Corynebacterium and
Neisseria are more abundant in the sarcoidosis group. However, Haemophilus, known as pathogenic-bacteria, is
usually observed in COPD patients30.
ILD groups have enriched unique microbial groups. Moreover, we also observed a significantly higher abun-
dance of Haemophilus in stable COPD groups. These deviations could be seen as a possible outcome of diverse
ethnicity, as commonly observed in other human microbiome s tudies31,32.
When we compared the core microbiome of COPD (stable and exacerbation), ILD, and sarcoidosis patients,
we observed that eleven taxa were shared among these disease groups. This supports the idea that many features
shared between microbiota differ compositionally between these disease groups. Additionally, the core alveolar
microbiome in respiratory illness was found altered as compared to that of a healthy lung microbiome. Core lung
microbiome of a healthy individual harbors nine microbial genera33,34 of which only Pseudomonas, Streptococ-
cus, Prevotella, and Sphingobacterium were shared within the studied core microbiomes. This result supports
the hypothesis that the microbiome biotransformation may lead to the onset of pathophysiological d isorders35.
Furthermore, in the genus-level abundance network analysis, Xanthobacteraceae were highly connected with
multiple other nodes between all the disease groups, indicating it as a keystone microbial taxon. Most of the
genera in stable COPD, ECOPD, ILD, and sarcoidosis patients showed both positive and negative correlation;
however, ECOPD and stable COPD patients showed a more positive correlation. We also noticed many potential
clinically relevant taxa such as Streptococcus sp. (observed in all diseased groups), Haemophilus sp. (observed
in stable COPD patients), Escherichia-Shigella sp. (observed in stable and ECOPD patients), and Pseudomonas
aeruginosa (observed in stable COPD and ILD patients), show correlation with other t axa14–22. However, cor-
relations between taxa are not proof of functional relationships between members of the community. Therefore,
further studies are required to focus on the functional role of such taxa found within these communities.
The present study has used very stringent inclusion criteria for patients screening. Though it has allowed
the identification of unbiased disease-specific samples, but also reduced the number of samples (~ 50 fold) for
the downstream analysis. Due to the limitation of samples, the current study is slightly underpowered and
higher numbers of samples are required to statistically strengthen the proposed claims. However, this pilot
Scientific Reports | (2021) 11:3963 | https://doi.org/10.1038/s41598-021-83524-2 7
Vol.:(0123456789)www.nature.com/scientificreports/
study provides preliminary evidence in support of the hypothesis that there are diseases specific differences in
the microbiomes of COPD (stable and exacerbation), ILD, and sarcoidosis patients.
Moreover, our study adds further insights into the microbial composition of the lung microbiota of Indian
patients suffering from COPD, ILD, or sarcoidosis. Each disease subtype has differential microbial phylotypes that
correlate with the abundance profile of other microbial taxa to possibly remodel the lung microbiome structure.
This study enhances our understanding of lung microbial ecology in various respiratory illnesses. Identified
microbial signatures could be utilized as prognostic markers for respiratory disease diagnosis and therapeutics.
Methods
Patient recruitment and Broncho‑Alveolar Lavage (BAL) sample collection. This study was
approved by the institutional human ethics committee, Vallabhbhai Patel Chest Institute, University of Delhi,
Delhi, India. Adult patients with stable COPD, both male and female with a history of smoking (> 10 pack-years)
and/or biomass fuel exposure (> 10 years) attending Vallabhbhai Patel Chest Institute were invited to participate
in the study. Patients classified as having exacerbated COPD if they presented within increased cough or sputum
production. All patients suspected of ILD underwent clinical evaluation including detailed history and exami-
nation. The diagnosis of ILD was made based on the American Thoracic Society/European Respiratory Society
International Multidisciplinary Consensus Classification of Idiopathic Interstitial Pneumonia 2001 g uidelines36.
Similarly, the diagnosis of sarcoidosis was made based on the compatible clinical, radiological, laboratory, and
where available, histopathological parameters, as per the joint statement of the American Thoracic Society, the
European Respiratory Society, and the World Association of Sarcoidosis, and Other Granulomatous Disorders
(ATS/ERS/WASOG), and also the simultaneous exclusion of any other cause of the granulomatous disorder37.
Since Bronchoscopy was used as a diagnostic criterion, patients were excluded if they have taken antibiotics or
steroids prior to their inclusion.
After providing written informed consent, the patients underwent bronchoscopy as per the British Thoracic
Society (BTS) guidelines for bronchoscopy 2013. This study included bronchoalveolar lavage collected from
ECOPD (n = 13), stable COPD (n = 14), ILD (n = 8), and sarcoidosis (n = 8) patients, as well as saline buffer passed
through a bronchoscope to be used as negative control.
Metagenomic DNA isolation from BAL samples and 16S rRNA gene sequencing. Each BAL
sample (1.5 ml) was centrifuged at 13,000 rpm for 1 min to collect the bacterial pellet. The bacterial pellet was
processed with the alkaline lysis method38. Metagenomic DNA quantification was performed with Qubit 2.0
using high sensitivity DNA quantification kit (Invitrogen, USA). All samples were diluted to a DNA concentra-
tion of 25 ng μl-1. The V3-V4 region of the bacterial 16S rRNA gene was amplified using gene-specific primer
sequences (Fwd 5′-TCGTCGGCAGCGTCAGATGTGTATAAGAGACAGCCTACGGGNGGCWGCAG-3` and
Rev 5′-GTCTCGTGGGCTCGGAGATGTGTATAAGAGACAGGACTACHVGGGTATCTA ATCC-3`)39. Nex-
tera XT Index kit (Illumina, USA) was used to index each sample during library preparation following Illumina
technology workflow document (www.support.illumina.com). The indexed 16S rRNA amplicons were pooled in
equimolar concentration followed by paired-end sequencing on the Illumina MiSeq platform using paired-end
MiSeq 600 cycle V3 sequencing Kit following manufacturer instructions39.
Sequence and statistical analyses. Primers were removed from the MiSeq demultiplex FASTQ using
“cutadapt"40. Further, reads were analyzed by the QIIME2 p ipeline41 through dada242 to infer the presence and
relative abundance of amplicon sequence variants (ASVs) across the samples. Based on data-derived rates of
Illumina sequencing errors, dada2 estimated an abundance distribution of distinct ASVs, which may differ by
only a single nucleotide. Using read quality scores for the dataset, forward and reverse reads were truncated at
270 bp and 200 bp, followed by trimming the 5`-end till 6 bp for both forward and reverse reads, respectively;
other quality parameters used dada2 default values. Taxonomy was assigned using a pre-trained Naïve Bayes
classifier (Silva database, release 132)43. The rarefaction curves (Supplementary Fig. S1) show the observed rich-
ness and Shannon diversity. To avoid the bias due to sampling depth, we rarefied our dataset to 4351 high-quality
sequences per sample (90% of the minimum sample reads) using an in-house script. The function rarefies each
sample 100 times, calculates the mean and standard deviation for observed richness and Shannon diversity
index, and returns the ASV counts for the iteration with the lowest mean Bray–Curtis distance among the 100
iterations.
All downstream analyses were performed on this rarefied ASVs table unless otherwise mentioned. We used
two diversity indices i.e., observed richness, the number of taxa present in a sample at a particular taxonomic
level, and Shannon diversity index, a composite measure of both species richness and evenness. Alpha and beta
diversity was calculated using phyloseq v1.20.044 and visualized with ggplot2 v2.2.1in R v3.4.1.45. Comparison
of community richness and diversity between the four disease groups was assessed by the Kruskal–Wallis test,
with post hoc tests, performed using the Mann–Whitney test with Bonferroni adjustment applied. Significance
testing between the disease groups for beta diversity was assessed using the PERMANOVA (permutational
multivariate analysis of variance). LEfSe was used to identify the microbiological markers associated with stable
COPD, ECOPD, ILD, and sarcoidosis disease groups by linear discriminate analysis (LDA) effect size of 3, and
for multiclass analysis one-against-all option was used with default parameters46.
Functional annotation of the lung microbiome. The taxonomically affiliated OTU table was used to
annotate physiological functions and the lifestyle of human lung microbes associated with various disease sub-
sets with the METAGENassist server47.
Scientific Reports | (2021) 11:3963 | https://doi.org/10.1038/s41598-021-83524-2 8
Vol:.(1234567890)www.nature.com/scientificreports/
Core microbiota and bacterial co‑occurrence. Considering the variable nature of metagenomic com-
positional data, we performed further analysis only for conserved taxa. Towards this, we estimated core micro-
biota within the samples with a presence in at least 50% of the samples within each disease group on the non-
rarefied data. We examined co-occurrence patterns using network analysis on the core microbiota using Sparse
Correlations for Compositional data algorithm (SparCC) with a bootstrap procedure repeated 100 times48. Co-
occurrence was considered robust when the correlations (either positive or negative) were both ≥ 0.6 and corre-
lation coefficients with two-tailed p values smaller than 0.05. The correlation was imported into Cytoscape v3.6.0
to build the co-occurrence network, where each node represents taxa and the edges between the nodes represent
the correlation coefficients between taxa49.
Ethics approval and consent to participate. This study was carried out by following the recommenda-
tions of the Indian Council of Medical Research, India guidelines for biomedical research, with written informed
consent from all subjects. All subjects gave written informed consent under the Declaration of Helsinki. The
protocol was approved by the Institutional human ethics committee, Vallabhbhai Patel Chest Institute, Univer-
sity of Delhi, Delhi, India.
Consent for publication. The manuscript has been read and approved for submission by the named
authors.
Data availability
Sequence data generated in this study have been deposited at NCBI with an SRA submission ID SUB4935309
and Bio project accession ID PRJNA512576.
Received: 16 July 2020; Accepted: 1 February 2021
References
1. Schwarzkopf, L., Witt, S., Waelscher, J., Polke, M. & Kreuter, M. Associations between comorbidities, their treatment and survival
in patients with interstitial lung diseases—a claims data analysis. Respir. Res. 19, 73. https://doi.org/10.1186/s12931-018-0769-0
(2018).
2. May, S. M. & Li, J. T. C. Burden of chronic obstructive pulmonary disease: Healthcare costs and beyond. Allergy Asthma. Proc. 36,
4–10. https://doi.org/10.2500/aap.2015.36.3812 (2015).
3. Gerke, A. K., Judson, M. A., Cozier, Y. C., Culver, D. A. & Koth, L. L. Disease burden and variability in sarcoidosis. Ann. Am.
Thorac. Soc. 14, S421–S428. https://doi.org/10.1513/AnnalsATS.201707-564OT (2017).
4. Papi, A. et al. Infections and airway inflammation in chronic obstructive pulmonary disease severe exacerbations. Am. J. Respir.
Crit. Care. Med. 173, 1114–1121. https://doi.org/10.1164/rccm.200506-859OC (2006).
5. Sethi, S. & Murphy, T. F. Bacterial infection in chronic obstructive pulmonary disease in 2000: A state of the art review. Clin.
Microbiol. Rev. 14, 336–363. https://doi.org/10.1128/CMR.14.2.336-363.2001 (2001).
6. Salisbury, M. L., Han, M. K., Dickson, R. P. & Molyneaux, P. L. The microbiome in interstitial lung disease: From pathogenesis to
treatment target. Curr. Opin. Pulm. Med. 23, 404–410. https://doi.org/10.1097/MCP.0000000000000399 (2017).
7. Segal, L. N., Rom, W. N. & Weiden, M. D. Lung microbiome for clinicians. New discoveries about bugs in healthy and diseased
lungs. Ann. Am. Thorac. Soc. 11, 108–116. https://doi.org/10.1513/AnnalsATS.201310-339FR (2014).
8. Travis, W. D. et al. An official American Thoracic Society/European Respiratory Society statement: Update of the international
multidisciplinary classification of the idiopathic interstitial pneumonias. Am. J. Respir. Crit. Care. Med. 188, 733–748. https://doi.
org/10.1164/rccm.201308-1483ST (2013).
9. Pragman, A. A. et al. Chronic obstructive pulmonary disease upper airway microbiota alpha diversity is associated with exacerba-
tion phenotype: A case-control observational study. Respir. Res. 20, 114. https://doi.org/10.1186/s12931-019-1080-4 (2019).
10. Aho, V. T. E. et al. The microbiome of the human lower airways: A next generation sequencing perspective. World Allergy Organ
J. 8, 1–13. https://doi.org/10.1186/s40413-015-0074-z (2015).
11. Kiley, J. P. Advancing respiratory research. Chest 140, 497–501. https://doi.org/10.1378/chest.11-0774 (2011).
12. Dickson, R. P. et al. Spatial variation in the healthy human lung microbiome and the adapted island model of lung biogeography.
Ann. Am. Thorac. Soc. 12, 821–830. https://doi.org/10.1513/AnnalsATS.201501-029OC (2015).
13. Dickson, R. P., Martinez, F. J. & Huffnagle, G. B. The role of the microbiome in exacerbations of chronic lung diseases. Lancet 384,
691–702. https://doi.org/10.1016/S0140-6736(14)61136-3 (2014).
14. Pragman, A. A., Kim, H. B., Reilly, C. S., Wendt, C. & Isaacson, R. E. The lung microbiome in moderate and severe chronic obstruc-
tive pulmonary disease. PLoS ONE 7, e47305. https://doi.org/10.1371/journal.pone.0047305 (2012).
15. O’Dwyer, D. N., Dickson, R. P. & Moore, B. B. The lung microbiome, immunity, and the pathogenesis of chronic lung disease. J
Immunol. 196, 4839–4847. https://doi.org/10.4049/jimmunol.1600279 (2016).
16. Sibley, C. D. et al. Culture enriched molecular profiling of the cystic fibrosis airway microbiome. PLoS ONE 6, e22702. https://doi.
org/10.1371/journal.pone.0022702 (2011).
17. Pragman, A. A. et al. The lung tissue microbiota of mild and moderate chronic obstructive pulmonary disease. Microbiome. 6, 7.
https://doi.org/10.1186/s40168-017-0381-4 (2018).
18. Millares, L. et al. Bronchial microbiome of severe COPD patients colonised by Pseudomonas aeruginosa. Eur. J. Clin. Microbiol.
Infect. Dis. 33, 1101–1111. https://doi.org/10.1007/s10096-013-2044-0 (2014).
19. Ramírez-Labrada, A. G. et al. The influence of lung microbiota on lung carcinogenesis, immunity, and immunotherapy. Trends.
Cancer. 6, 86–97. https://doi.org/10.1016/j.trecan.2019.12.007 (2020).
20. Hilty, M. et al. Disordered microbial communities in asthmatic airways. PLoS ONE 5, e8578. https://doi.org/10.1371/journ
al.pone.0008578 (2010).
21. Surette, M. G. The cystic fibrosis lung microbiome. Ann. Am. Thorac. Soc. 1, S61–S65. https://doi.org/10.1513/AnnalsATS.20130
6-159MG(2014).
22. Zimmermann, A. et al. Atopobium and Fusobacterium as novel candidates for sarcoidosis-associated microbiota. Eur. Respir. J. 50,
1600746. https://doi.org/10.1183/13993003.00746-2016 (2017).
23. Becker, A. et al. The composition of the pulmonary microbiota in sarcoidosis—an observational study. Respir. Res. 20, 46. https://
doi.org/10.1186/s12931-019-1013-2 (2019).
Scientific Reports | (2021) 11:3963 | https://doi.org/10.1038/s41598-021-83524-2 9
Vol.:(0123456789)www.nature.com/scientificreports/
24. Le, N. V. et al. Modulation of pulmonary microbiota by antibiotic or probiotic aerosol therapy: A strategy to promote immuno-
surveillance against lung metastases. Cell Rep. 24, 3528–3538. https://doi.org/10.1016/j.celrep.2018.08.090 (2018).
25. Contoli, M. et al. Long-term effects of inhaled corticosteroids on sputum bacterial and viral loads in COPD. Eur. Respir. J. 50,
1700451. https://doi.org/10.1183/13993003.00451-2017 (2017).
26. Huang, Y. J. et al. Airway microbiome dynamics in exacerbations of chronic obstructive pulmonary disease. J. Clin. Microbiol. 52,
2813–2823. https://doi.org/10.1128/JCM.00035-14 (2014).
27. Molyneaux, P. L. et al. Outgrowth of the bacterial airway microbiome after rhinovirus exacerbation of chronic obstructive pulmo-
nary disease. Am. J. Respir. Crit. Care. Med. 188, 1224–1231. https://doi.org/10.1164/rccm.201302-0341OC (2013).
28. Sze, M. A. et al. The lung tissue microbiome in chronic obstructive pulmonary disease. Am. J. Respir. Crit. Care. Med. 185,
1073–1080. https://doi.org/10.1164/rccm.201111-2075OC (2012).
29. Han, M. K. et al. Lung microbiome and disease progression in idiopathic pulmonary fibrosis: An analysis of the COMET study.
Lancet. Respir. Med. 2, 548–556. https://doi.org/10.1016/S2213-2600(14)70069-4 (2014).
30. Osman, K. L. et al. Patients with chronic obstructive pulmonary disease harbour a variation of Haemophilus species. Sci. Rep. 8,
14734. https://doi.org/10.1038/s41598-018-32973-3 (2018).
31. Chauhan, N. S. et al. Western Indian rural gut microbial diversity in extreme Prakriti endo-phenotypes reveals signature microbes.
Front. Microbiol. 9, 118. https://doi.org/10.3389/fmicb.2018.00118 (2019).
32. Verma, M. K. et al. Functional metagenomics identifies novel genes ABCTPP, TMSRP1 and TLSRP1 among human gut enterotypes.
Sci. Rep. 8, 1397. https://doi.org/10.1038/s41598-018-19862-5 (2019).
33. Beck, J. M., Young, V. B. & Huffnagle, G. B. The microbiome of the lung. Transl. Res. 160, 258–266. https://doi.org/10.1016/j.
trsl.2012.02.005 (2012).
34. Erb-Downward, J. R. et al. Analysis of the lung microbiome in the “healthy” smoker and in COPD. PLoS ONE 6, e16384. https://
doi.org/10.1371/journal.pone.0016384 (2011).
35. Duvallet, C., Gibbons, S. M., Gurry, T., Irizarry, R. A. & Alm, E. J. Meta-analysis of gut microbiome studies identifies disease-specific
and shared responses. Nat. Commun. 8, 1784. https://doi.org/10.1038/s41467-017-01973-8 (2017).
36. The American Thoracic Society/European Respiratory Society International. Multidisciplinary consensus classification of the
idiopathic interstitial pneumonias. Am. J. Respir. Crit. Care Med. 165, 277–304 (2002).
37. American Thoracic Society, European Respiratory Society, World Association of sarcoidosis and Other Granulomatous Disorders.
Statement on sarcoidosis. Am. J. Respir. Crit. Care Med. 160, 736–755 (1999).
38. Kumar, J. et al. An improved methodology to overcome key issues associated with the methods of human fecal metagenomic DNA
extraction. Genom. Proteom. Bioinf. 14, 371–378. https://doi.org/10.1016/j.gpb.2016.06.002 (2016).
39. Klindworth, A. et al. Evaluation of general 16S ribosomal RNA gene PCR primers for classical and next-generation sequencing-
based diversity studies. Nucleic. Acids. Res. 7, e1. https://doi.org/10.1093/nar/gks808 (2013).
40. Martin, M. Cutadapt removes adapter sequences from high-throughput sequencing reads. EMBnet J. 17, 1. https: //doi.org/10.14806
/ej.17.1.200 (2011).
41. Bolyen, E. et al. Reproducible, interactive, scalable, and extensible microbiome data science using QIIME 2. Nat. Biotechnol. 37,
852–857. https://doi.org/10.1038/s41587-019-0209-9 (2020).
42. Callahan, B. J. et al. DADA2: High-resolution sample inference from Illumina amplicon data. Nat. Methods 13, 581–583. https://
doi.org/10.1038/nmeth.3869 (2016).
43. Quast, C. et al. The SILVA ribosomal RNA gene database project: Improved data processing and web-based tools. Nucleic. Acids.
Res. 41, D590–D596. https://doi.org/10.1093/nar/gks1219 (2013).
44. McMurdie, P. J. & Holmes, S. Phyloseq: An R package for reproducible interactive analysis and graphics of microbiome census
data. PLoS ONE 8, e61217. https://doi.org/10.1371/journal.pone.0061217 (2013).
45. Wickham, H. ggplot2, Elegant Graphics for Data Analysis (Springer, New York, 2016). https://doi.org/10.1007/978-3-319-24277-4.
46. Segata, N. et al. Metagenomic biomarker discovery and explanation. Genome. Biol. 12, R60. https://doi.org/10.1186/gb-2011-12-
6-r60 (2011).
47. Arndt, D. et al. METAGENassist: A comprehensive web server for comparative metagenomics. Nucleic. Acids. Res. 40, W88-95.
https://doi.org/10.1093/nar/gks497 (2012).
48. Friedman, J. & Alm, E. J. Inferring correlation networks from genomic survey data. PLoS Comput. Biol. 8, e1002687. https://doi.
org/10.1371/journal.pcbi.1002687 (2012).
49. Otasek, D., Morris, J. H., Bouças, J., Pico, A. R. & Demchak, B. Cytoscape automation: Empowering workflow-based network
analysis. Genome Biol. 20, 185. https://doi.org/10.1186/s13059-019-1758-4 (2019).
Acknowledgements
We hereby acknowledge the sequencing facility support from CSIR-IGIB and UGC fellowship to GC.
Author contributions
N.G., M.S., and A.S. performed sample recruitment and DNA isolation. G.C., M.Y., M.M., and A.S. performed
sequencing of samples. S.G., N.S.C., S.J.S., and M.S.M. interpreted the data. S.G., M.S., M.M., and N.S.C. wrote
the manuscript. This project was conceived and designed by M.S. and N.S.C. All the authors have read, revised,
and approved the manuscript.
Funding
The current study was funded by Department of Biotechnology grant vide BT/PR10801/MED/29/826/2014.
Competing interests
The authors declare no competing interests.
Additional information
Supplementary Information The online version contains supplementary material available at https://doi.
org/10.1038/s41598-021-83524-2.
Correspondence and requests for materials should be addressed to N.S.C.
Reprints and permissions information is available at www.nature.com/reprints.
Publisher’s note Springer Nature remains neutral with regard to jurisdictional claims in published maps and
institutional affiliations.
Scientific Reports | (2021) 11:3963 | https://doi.org/10.1038/s41598-021-83524-2 10
Vol:.(1234567890)www.nature.com/scientificreports/
Open Access This article is licensed under a Creative Commons Attribution 4.0 International
License, which permits use, sharing, adaptation, distribution and reproduction in any medium or
format, as long as you give appropriate credit to the original author(s) and the source, provide a link to the
Creative Commons licence, and indicate if changes were made. The images or other third party material in this
article are included in the article’s Creative Commons licence, unless indicated otherwise in a credit line to the
material. If material is not included in the article’s Creative Commons licence and your intended use is not
permitted by statutory regulation or exceeds the permitted use, you will need to obtain permission directly from
the copyright holder. To view a copy of this licence, visit http://creativecommons.org/licenses/by/4.0/.
© The Author(s) 2021
Scientific Reports | (2021) 11:3963 | https://doi.org/10.1038/s41598-021-83524-2 11
Vol.:(0123456789)You can also read