Comparison the Effects of Three Forms of Ketogenic Diet on Adult Male Diabetic
←
→
Page content transcription
If your browser does not render page correctly, please read the page content below
OPEN     ACCESS Freely available online
              iology: Cur
            ys
                                         Anatomy & Physiology:
            h

                        re
   atomy & P

                          nt R
                              e searc
                                         Current Research
An

                                     h
         ISSN: 2161-0940
                                                                                                                                                Research Article

Comparison the Effects of Three Forms of Ketogenic Diet on Adult Male
Diabetic Albino Rats
Ahmed El-Sayed Nour El-Deen 1*, Abd El-Megeed Mansour 1, Abdallah Mohammed Ramadan Elsamahy 1
, Ali Abdeslam 2 , Dr. Ahmad Mahmoud Mohammed Gad-Allah 1
Department of Physiology, Faculty of Medicine, Al-Azhar University, Assuit, Egypt. 2Department of Pharmacology, Faculty of Medicine, Al-Azhar
1

University, Assuit, Egypt

                             ABSTRACT
                             Ketogenic diet are being highly effective line of treatment for metabolic syndrome and DM. This study aimed to
                             compare the effect of three different forms of KD on diabetic rats. Fifty adult male albino rats grouped into five
                             equal groups control groups (1) Normal (2) Diabetic control receives normal diet. Experimental (3) Diabetic receive
                             classic Ketogenic diet (4:1). Experimental (4) Diabetic receive Ketogenic diet (3:1). Experimental (5) Diabetic receive
                             Ketogenic diet (2:1). Fasting samples were collected at the end of the study for analysis.
                             Biochemical analyses were done using spectrophotometric method. A significant decrease in blood glucose, serum
                             total cholesterol, LDL, and triglycerides, serum urea and creatinine were observed while Insulin level and HDL were
                             significantly increased. The major findings in our study is that the classic KD (4:1) is the most effective form of three
                             main types of Ketogenic diets in this study. There was no significant difference in the histological finding between
                             three experimental groups with minimal histological changes on pancreases, liver and kidney. These findings have
                             clearly shown that intake of Ketogenic diet is not harmful to the liver, pancreases and kidney.
                             Keywords: Ketogenic die; Diabetes Mellitus; Metabolic syndrome

INTRODUCTION                                                                               body shifts its primary fuel source from carbohydrates to fatty acids
                                                                                           in response to a scarce supply of glucose [6]. Ketosis induced by the
Nutrition is key for preventing Type 2 Diabetes (T2D) and obesity                          KD is hypothesized to have an appetite suppressing effect, which
[1], but there are no evidence-based data defining the best dietary                        has intrigued many individuals to try this diet to lose weight [1].
approach to prevent and treat these conditions [2]. In the last                            Interestingly, the consumption of a high-fat diet and high intake of
decades, Low Carbohydrate Diets (LCD) and Ketogenic Diet s (KD)                            saturated fat used to be associated with an increased risk of type 2
have become widely known and popular ways for weight loss [1], not                         diabetes, but this association disappears when combined with a low
only within the scientific community, but also among the general                           or non-carbohydrate diet [3]. The KD has also gained interest in the
public, with best-selling dedicated books or intense discussion on                         diabetes community, particularly for its effect on blood glucose and
social media networks staying at the top of the diet trend list for years                  weight [7]. Several studies have shown positive health outcomes in
[3]. KD was first reported as a kind of high-fat, adequate-protein,                        individuals with diabetes who have followed the Ketogenic diet such
and low-carbohydrate diet for treatment for epilepsy in the 1920s                          as weight loss [1], improved glycemic control [7], and decreases in
[1]. There are a number of different types of ketogenic diet but the                       medication dosages[1]. Despite the significant increase in literature
end goal of these diets is the same, the different types of ketogenic                      investigating the KD in diabetes, its long-term safety and efficacy
diet usually share a number of similarities, notably in being low in                       still remains unknown and there is no research on the long-term
carbohydrate and high in dietary fat [4]. The classical KD provides                        risks and benefits for individuals with diabetes following the KD
90% of calories from long chain fatty acids, a minimum of 1 g/kg of                        such as the risk of developing nutritional deficiencies (vitamin
protein and minimal carbohydrates, resulting in the generation of                          B-complex, vitamin D, beta- carotene, calcium, and antioxidants)
ketone bodies evoke nutritional ketosis [5]. Ketosis is the metabolic                      [1]. The objective of this study is to compare the effect of three
formation of ketone bodies by the liver, which occurs when the                             different forms of KD on diabetic rats.

Correspondence to: Ahmed El-Sayed Nour El-Deen, Department of physiology, Faculty of Medicine, Al-Azhar University, Assuit, Egypt, Telephone: +2-
0882148103; E-mail: drnoor83@hotmail.com
Received: October 10, 2020; Accepted: October 25, 2020; Published: January 31, 2021
Citation: El-Deen AEN, Mansour AE , Elsamahy AMR , Dr.Gad-Allah AMM , Abdeslam A (2020) Comparison the effects of three forms of Ketogenic
diet on diabetic albino rats. Anat Physiol 10:336.
Copyright: ©2020 El-Deen AEN, et al. This is an open-access article distributed under the terms of the Creative Commons Attribution License, which
permits unrestricted use, distribution, and reproduction in any medium, provided the original author and source are credited.

Anat Physiol, Vol. 10 Iss. 6 No: 336                                                                                                                        1
Nour El-Deen AES, et al. OPEN ACCESS Freely available online
MATERIALS AND METHODS mg/kg b.wt . Streptozotocin dissolved in citrate buffer pH 4.518.
Seven days, rats were be screened for serum glucose levels. Rats
Ethical consideration having serum glucose ≥ 200 mg/dl, after 2 hours of glucose intake,
Institutional Animal Care and Use Committee (IACUC) at Al- were be considered diabetic [8].
Azhar University, Assuit, Egypt have approved the experimental Experimental diet
protocol at, 10/12/2018. The protocol were considered official
after the acceptance by ethical comity of the faculty and the KD was formed as in (Table 1) to meet the nutritional requirements
Physiology department. of adult rats as recommended by the American Institute of
Nutrition (AIN-93M).
Experimental animals
The level of blood glucose were be estimated daily using Accu-Chek
Fifty adult male albino rats, eight weeks of age, weighting about glucometer (Roche, Germany).
150-225 g were used as experimental animals in this study. Rats
were obtained from The Nile Co. For Pharmaceuticals and At the end of the 12 weeks and After 12 hours over night fasting,
Chemical Industries (Cairo). The animals were housed in standard morning blood samples were collected from retro-orbital venous
polypropylene cages with stainless steel good aerated covers and plexus. Blood was collected into a dry clean graduated glass
maintained under controlled room temperature with 12 hours light centrifuge tube, and serum was separated by centrifugation at 5000
- dark cycle and were fed a standard diet of known composition. rpm for 10 minutes. The separated serum was aliquotted and stored
The experimental animals were kept for 10 days to adapt a new frozen in epindorffs, tube at 20°C until used for the determination
condition before start of experiment. of Insulin, Lipid profile: (Triglycerides (TG), Total Cholesterol (TC),
High-Density Lipoprotein (HDL), and Low-Density Lipoprotein
Rats were divided into five equal groups, each group comprising (LDL)), blood urea, creatinine, ALT and AST. Under ether
ten rats designated as follow: anesthesia, abdomen of the animal was opened after reaching the
Group 1: Normal control rats. stage of surgical anesthesia, as evident by loss of withdrawal reflex.
Specimens from pancreas, liver, kidney were fixed immediately in
Group 2: Diabetic control receives normal diet. 10% neutral buffered formalin, embedded in paraffin, prepared as
Group 3: Diabetic receive classic Ketogenic diet (4:1). 5-μm thick sections, and stained with Hematoxylin and Eosin (HE)
to assess the histopathological examination.
Group 4: Diabetic receive Ketogenic diet (3:1)
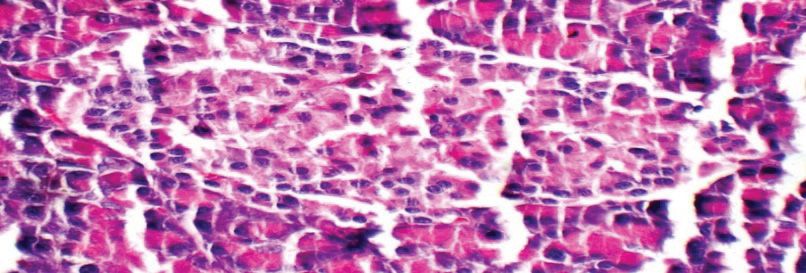
Group 1 (Control group): Pancreas showed average-sized pale-
Chemicals staining islets of Langerhans composed of predominating beta cells
Streptozotocin (STZ) was purchased from Sigma Chemicals Co., with pale blue cytoplasm in and less frequently alpha cells with pink
St. Louis, MO, USA. cytoplasm in separated by average thin-walled blood capillaries,
average exocrine areas, and average ducts (Figure 1A).
Blood glucose kit (Egyptian Company for Biotechnology-Egypt).
Group 2 (Diabetic): Pancreas showed small sized hypocellular islets
Insulin kit (Sigma-Aldrich Co. LLC-USA). of Langerhans with scattered apoptotic beta cells and mildly dilated
Serum cholesterol kit (Egyptian company for biotechnology- congested intervening blood capillaries, mildly dilated congested
Egypt). interstitial blood vessels, average exocrine areas, and average ducts
(Figure 1B).
Serum triglycerides kit (Egyptian Company for Biotechnology-
Egypt). Group 3 (Diabetic+ketogenic diet 4:1): Pancreas showed small-
sized hypocellular islets of Langerhans with scattered apoptotic beta
Serum high density lipoprotein (HDL) kit (Egyptian Company for cells and mildly dilated congested intervening blood capillaries,
Biotechnology-Egypt). mildly congested interstitial blood vessels, average exocrine areas,
Serum urea kit (Egyptian Company for Biotechnology). and average ducts (Figure 1C).
Serum creatinine kit (Biolabo reagents kits – France). Group 4 (Diabetic+ketogenic diet 3:1): Pancreas showed average-
sized hypocellular islets of Langerhans with scattered apoptotic
Induction of diabetes mellitus beta cells and mildly dilated intervening blood capillaries, average
Type 2 diabetes was induced by an interapritoneal injection of 50 exocrine areas, and average ducts (Figure 1D).
Table 1: Nutritional composition of the experimental diets [9]
Macronutrient Micronutrient Control Classic KD Type 2 KD Type 3 KD
Casein 87.225 142.09 4.887 142.09
Protein
L-Cystine 3 4.887 - 4.887
Corn Starch 465.7 - - -
Carbohydrate Sucrose 137.5 - 30 -
Dextrin 165 30 114.03 30
Fat Soybean Oil 70 114.03 116.9 114.03
Lard - 187.8 300 94
Butter - 406 4.887 260
Anat Physiol, Vol. 10 Iss. 6 No: 336 2
Nour El-Deen AES, et al. OPEN ACCESS Freely available online
Table 2: Blood glucose (mg/dl) and Insulin (IU/ml) in adult male albino rats subjected to different treatment
G1 G2 G3 G4 G5
Glucose Mean ± S.E 90.7 ± 0.63a 204.9 ± 1.03b 107.3 ± 0.76c 119.3 ± 0.63d 128.8 ± 0.42e
(mg/dl) % -- 125.9 18.3 31.5 42.0
Mean ± S.E 20.4 ± 0.50a 12.4 ± 0.34b 22.3 ± 0.47c 17.0 ± 0.21d 14.2 ± 0.39e
Insulin(IU/ml)
% -- -39.2 9.3 -16.7 -30.4
Each value represented means of 10 records ± S.E.
a,b,c,d.e means comparison between all groups which the groups have the same letter mean there is no significance difference and which have different
letter mean there is a significance change.
%: Percent of changes from control values.
Table 2.1: Histopathological results of the pancreas
Pancreatic islets Ducts Exocrine area BV
Islet size Cellularity Beta cells Capillaries
Group 1 0 0 0 0 0 0 0
Group 2 + + + + 0 0 +
Group 3 + + + + 0 0 +
Group 4 0 + + + 0 0 0
Group 5 0 0 0 + 0 0 +
Islet size: 0: Average +: Small ++: Atrophied
Cellularity: 0: Average +: Hypocellular ++: Acellular
Beta cells: 0: Average +: Few/apoptotic ++: Necrotic/absent
Capillaries: 0: Average +: Mildly dilated ++: Markedly dilated/congested
Ducts: 0: Average +: Dilated ++: Atrophied
Exocrine area: 0: Average acini +: Small acini ++: Atrophied acini
Interstitial BV: 0: Average +: Mildly dilated ++: Markedly dilated/congested
Group 5 (Diabetic+ketogenic diet 2:1): Pancreas showed average-
sized islets of Langerhans with predominating beta cells, mildly
dilated congested intervening blood capillaries, mildly dilated
interstitial blood vessels, average exocrine areas, and average ducts
(Figure 1E).
Rats fed classic-KD had lower hepatic enzymes relative to that fed
type two or three KD (Table 2, 2.1),
Group 1 (Control group): Liver showed average portal tracts with Figure 1A: Group 1 (Control): High power view showing predominating
average portal veins, average bile ducts and average hepatocytes in beta cells with pale blue cytoplasm (black arrows) and less frequently alpha
cells with pink cytoplasm (blue arrows) separated by average thin-walled
peri- portal area, average central veins with average hepatocytes
blood capillaries (red arrow), and average exocrine areas (yellow arrow)
arranged in single-cell cords with average intervening blood (H&E × 400).
sinusoids (Figure 2A).
Group 2 (Diabetic): Liver showed mildly edematous portal tracts
with markedly dilated congested portal veins, markedly dilated
central veins with detached lining, and scattered apoptotic
hepatocytes in peri-portal and peri-venular areas (Figure 2 B)
Group 3(Diabetic + ketogenic diet 4:1): Liver showed markedly
edematous portal tracts with markedly dilated congested portal
vein, average central veins, and average hepatocytes in peri-portal Figure 1B: (Group 2 Diabetic): High power view showing hypocellular
and peri-venular areas (Figure 2C) islet with scattered apoptotic beta cells (black arrow) and mildly dilated
Group 4 (Diabetic + ketogenic diet 3:1): Liver showed average intervening blood capillaries (blue arrow), average exocrine areas (yellow
arrows), and average ducts (red arrow) (H&E × 400).
portal tracts with mild portal inflammatory infiltrate and mildly
dilated congested portal veins, mildly dilated congested central
veins, and scattered apoptotic hepatocytes in peri-venular area with
intra- lobular inflammatory infiltrate (Figure 2D)
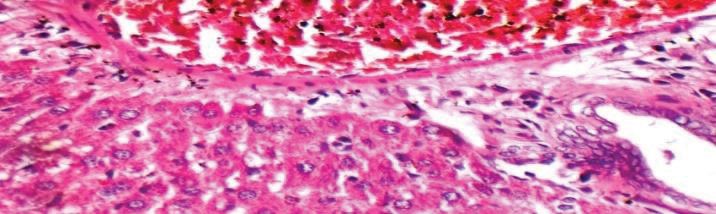
Group 5 (Diabetic + ketogenic diet 2:1): Liver showed average
portal tracts with mildly congested portal veins, markedly dilated
central veins with mildly congested blood sinusoids, hydropic
Anat Physiol, Vol. 10 Iss. 6 No: 336 3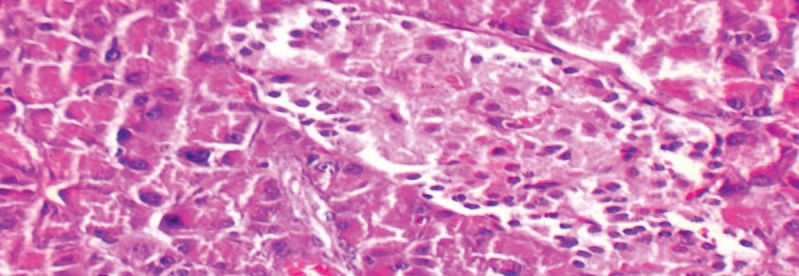
Nour El-Deen AES, et al. OPEN ACCESS Freely available online
Figure 1C: Group 3 (Diabetic + ketogenic diet 4:1): High power view change of hepatocytes, and mild micro-vesicular steatosis in peri-
showing hypocellular islet with mildly dilated intervening blood capillaries venular area (Figure 2E).
(black arrow), and average exocrine areas (blue arrow) (H&E × 400).
Rats fed classic-KD had lower Blood urea and serum creatinine
relative to that fed type two or three KD (Table 3, 3.1),
Group 1 (Control): Kidney showed average renal capsule, average
glomeruli with average Bowman’s spaces, average proximal tubules
with preserved brush borders, average distal tubules, and renal
medulla showed average collecting tubules with average interstitium
(Figure 3A) .
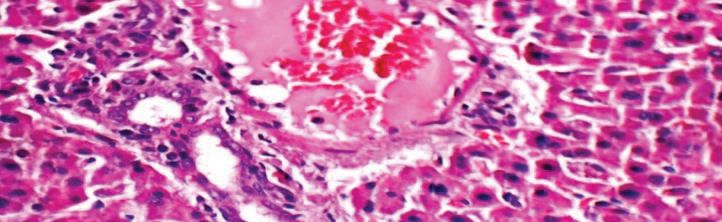
Group 2 (Diabetic): Kidney showed scattered small-sized and
Figure 1-D Group 4 (Diabetic+ ketogenic diet 3:1): High power view
congested glomeruli with widened Bowman’s spaces, scattered
showing hypocellular islet with scattered apoptotic beta cells (black arrow)
and mildly dilated intervening blood capillaries (blue arrow), and average proximal tubules with apoptotic epithelial lining and complete
exocrine areas (yellow arrow) (H&E × 400). loss of brush borders, markedly dilated congested interstitial blood
vessels, and renal medulla showed markedly congested blood
vessels (Figure 3B) .
Group 3 (Diabetic + ketogenic diet 4:1): Kidney showed average
renal capsule, few scattered small-sized glomeruli with average
Bowman’s spaces, scattered proximal tubules with partial loss of
brush borders, mildly congested interstitial blood vessels, and renal
medulla showed mildly congested blood vessels (Figure 3C).
Figure 1-E Group 5 (Diabetic+ ketogenic diet 2:1): High power view Group 4 (Diabetic + ketogenic diet 3:1): Kidney showed average
showing average islet with predominating beta cells (black arrows), mildly renal capsule, few scattered small-sized and congested glomeruli
dilated congested intervening blood capillaries (blue arrow), and average with widened Bowman’s spaces, scattered proximal tubules with
exocrine areas (yellow arrow) (H&E × 400). complete loss of brush borders, mildly congested interstitial blood
Figure 1: Histopathological results of the pancreas. vessels, and renal medulla showed mildly congested blood vessels
(Figure 3D).
Table 3: Serum ALT and AST (U/L) activity in adult male albino rats subjected to different treatment.
G1 G2 G3 G4 G5
mean ± S.E 31.3 ± 0.73a 96.5 ± 0.87b 41.0 ± 0.58c 46.6 ± 0.5d 53.1 ± 0.38e
ALT (U/L)
% -- 208.3 31.0 48.9 69.6
Mean ± S.E 21.1 ± 0.6a 93.6 ± 0.58b 42.6 ± 0.48c 47.8 ± 0.42d 54.9 ± 0.38e
AST (U/L)
% -- 341.5 101.4 125.9 160.2
Each value represented means of 10 records ± S.E.
a,b,c,d.e means comparison between all groups which the groups have the same letter mean there is no significance difference and which have different
letter mean there is a significance change.
%: Percent of changes from control values.
Table 3.1: Histopathological results of the liver
Blood Intra-lobular
Portal tract CV Hepatocyte sinusoids inflammatory infiltrate
PV Inflammatory infiltrate Edema
Group 1 0 0 0 0 0 0 0
Group 2 ++ 0 + ++ ++ 0 0
Group 3 ++ 0 + 0 0 0 0
Group 4 + + 0 + ++ 0 +
Group 5 + 0 0 ++ + + 0
Portal vein (PV): 0: Average +: Mildly Dilated/ congested ++: Markedly dilated/ congested
Inflammatory infiltrate: 0: No +: Mild ++: Moderate/marked
Edema : 0: No +: Present
Central vein (CV): 0: Average +: Dilated/ congested ++: Markedly dilated/ detached lining
Hepatocytes: 0: Average +: Hydropic change ++: Apoptotic /Necrotic
Blood sinusoids: 0: Average +: Mildly Dilated/ congested ++: Markedly dilated/ congested
Intra-lobular
inflammatory infiltrate: 0: No +: Mild ++: Moderate/marked
Anat Physiol, Vol. 10 Iss. 6 No: 336 4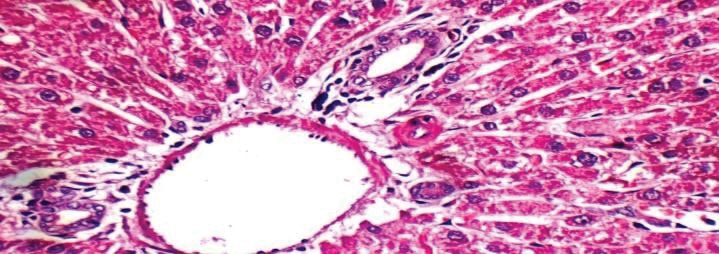
Nour El-Deen AES, et al.                                                                                             OPEN     ACCESS Freely available online

                                                                                 Group 5 (Diabetic + ketogenic diet 2:1 ): Kidney showed average
                                                                                 renal capsule, few scattered small-sized and congested glomeruli
                                                                                 with widened Bowman’s spaces, scattered proximal tubules with
                                                                                 partial loss of brush borders, markedly congested interstitial blood
                                                                                 vessels, and renal medulla showed mildly congested blood vessels
                                                                                 (Figure 3E).
                                                                                 Rats fed classic-KD had lower blood cholesterol, serum triglycerides,
                                                                                 LDL -cholesterol and high level of HDL-cholesterol relative to that
Figure 2A: (Group 1Control): High power view showing average portal
                                                                                 fed type two or three KD Table (4, 4.1, 5).
tract with average Portal Vein (PV), average bile ducts (black arrow),
average hepatic artery (blue arrow), and average hepatocytes in peri-portal
area (yellow arrow) (H&E × 400).                                                 DISCUSSION
                                                                                 As the KDs are being highly effective first line of treatment for
                                                                                 metabolic syndrome and DM. The major findings of our study are
                                                                                 that the classic KD is the most effective form of three main types
                                                                                 of Ketogenic diets in this study, these include the classic Ketogenic
                                                                                 Diet (4:1), the (3:1) Ketogenic Diet (CKD), and the (2:1) Ketogenic
                                                                                 Diet (TKD). In the present study, cumulative data have proved that
                                                                                 the classic KD significantly reduced blood glucose level, serum
Figure 2B (Group 2 Diabetic): high power view showing mildly                     total cholesterol, LDL, and triglycerides, serum urea and creatinine
edematous portal tract (black arrow) with markedly dilated congested             while Insulin level and HDL were significantly increased. The
portal vein (PV), average bile ducts (BD), and apoptotic hepatocytes in          hypoglycemic effect were explained by Morrison et al. they found
peri-portal area (blue arrow) (H&E × 400).

                                                                                 Figure 3A (Group 1 Control): High power view showing average
                                                                                 Glomerulus (G) with average Bowman’s Space (BS), average proximal
Figure 2C (Group 3): Diabetic + ketogenic diet 4:1: high power view
                                                                                 tubules (P) with preserved brush borders (black arrows) and average distal
showing markedly edematous portal tract (black arrow) with markedly
                                                                                 tubules (D) (H&E × 400).
dilated congested Portal Vein (PV), average Bile Ducts (BD), and average
hepatocytes in peri-portal area (blue arrows) (H&E × 400).

Figure 2E: Group 5: Diabetic + ketogenic diet 2:1: high power view               Figure 3B Group 2 Diabetic: High power view showing small-sized
showing average portal tract with mildly congested portal vein (black            congested Glomeruli (G) with widened Bowman’s Spaces (BS), scattered
arrow), average bile ducts (blue arrow), hydropic change of hepatocytes          Proximal tubules (P) with apoptotic epithelial lining and complete loss of
in peri-portal area (yellow arrow), and congested blood sinusoids (green         brush borders (black arrow) and markedly dilated congested Blood Vessels
arrow) (H&E X 400).                                                              (BV) (H&E × 400).
              Figure 2: Histopathological Results of the liver

                            Table 4: Blood urea and creatinine (mg/dl) in adult male albino rats subjected to different treatment.
                                                  G1                  G2                 G3                   G4                     G5
                                   Mean ± S.E     23.5 ± 0.4a         84.6 ± 0.34b       32.3 ± 0.47c         35.4 ± 0.31d           42.8 ± 0.25e
Urea (mg/dl)
                                   %              --                  260.0              37.4                 50.6                   82.1
                                   Mean ± S.E     0.75 ± 0.02a        3.08 ± 0.04b       1.10 ± 0.02c         1.20 ± 0.02d           1.80±0.03e
Creatinine (mg/dl)
                                   %              --                  310.7              46.7                 60.0                   140.0
Each value represented means of 10 records ± S.E.a,b,c,d.e means comparison between all groups which the groups have the same letter mean there is no
significance difference and which have different letter mean there is a significance change.
%: Percent of changes from control values.

Anat Physiol, Vol. 10 Iss. 6 No: 336                                                                                                                5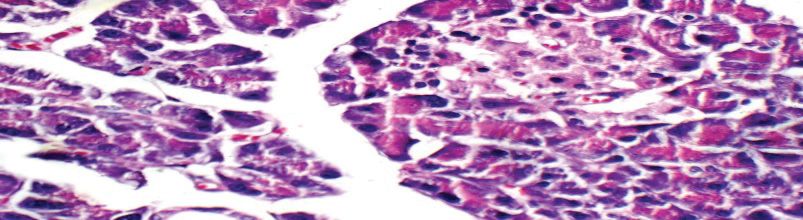
Nour El-Deen AES, et al.                                                                                          OPEN    ACCESS Freely available online

that consuming KD has been shown to cause shifts in cerebral                  human is associated with increased susceptibility to either insulin-
metabolism that are indicative of increased capacity for the                  induced hypoglycemia or fasting- induced hypoglycemia [10]. The
metabolism of non-glucose substrates, such as acetate and ketones,            Ketogenic diet significantly decrease blood glucose level and give
in both human and rodents. Increased cerebral acetate utilization in          excellent glycemic control in this study, High-fat, low-carbohydrate
                                                                              KD have been associated with beneficial effects on pancreatic
                                                                              endocrine cells and glucose metabolism on the long term this was
                                                                              evidenced by increased insulin concentrations as evidenced by
                                                                              Gupta et al, [11]. This response could be the result from beta cell
                                                                              activation, an increase of cell number, or a combination of these
                                                                              two mechanisms. Hypoglycemic effect of KD may resulted from
                                                                              decreased glucagon levels that have been observed by Granados
                                                                              et al, [12]. Gupta et al, explained hypoglycemic effect of KD by
                                                                              decreased glucagon levels that lead to less gluconeogenesis from
Figure 3C Group 3 (Diabetic + ketogenic diet 4:1): High power view            the liver, which may prevent hyperglycemia in KD-fed mice[11].
showing average-sized Glomerulus (G) with average Bowman’s Space (BS),        The results in this study strongly proved that long-term KD leads
scattered proximal tubules (P) with partial loss of brush borders (black      to increase of insulin sensitivity[13]. Interestingly, there were no
arrows) and mildly congested interstitial blood vessels (blue arrows) (H&E    great differences in pancreatic histological structure between KD
× 400)                                                                        groups that indicate the high fat diet is not harmful on pancreatic
                                                                              endocrine cells. Our finding is agreed with study of Blagosklonny,
                                                                              et al [14]. Purhonen et al, found that consuming KD leads to
                                                                              adaption of brain to utilize alternative energy substrates as well as
                                                                              to reduced hepatic glycogen content [15]. Long-term KD leads to
                                                                              decrease plasma cholesterol, LDL and triglyceride levels [16]. In
                                                                              our study, decrease plasma cholesterol, LDL and triglyceride levels
                                                                              were observed after 12 week of diet. Like fasting, KD may cause
Figure 3D Group 4 (Diabetic + ketogenic diet 3:1: High power view             the symptoms of starvation pseudo-diabetes as remembered by
showing small-sized and congested Glomeruli (G) with widened Bowman’s         Blagosklonny et al [14], they also said that starvation pseudo-diabetes
Spaces (BS), scattered proximal tubules (P) with partial loss of brush        is beneficial and is not type 2 diabetes. Thus, the warning that KD
borders (black arrows) and mildly dilated congested Blood Vessels (BV)        may cause type 2 diabetes in humans is not justified and contradicts
(H&E × 400).                                                                  what is observed in clinical practice[14]. where benefits of the diet
                                                                              appeared to strongly outweigh the challenges with positive health
                                                                              results after starting the KD, which were all related to their primary
                                                                              goals such as improved glycemic control [17], correct dyslipidemia
                                                                              [18], and weight loss [7]. The long-term safety and efficacy of the
                                                                              KD in individuals with diabetes remains unknown notably its effect
                                                                              on cardiovascular risk factors and frequency of hypoglycaemia [19].
                                                                              Our histological finding is extremely reassuring as the effects on
                                                                              the pancreas, liver and kidneys are very simple, this were agreed
                                                                              with finding of Blagosklonny et al [14, 20].
Figure 3E Group 5 (Diabetic + ketogenic diet 2:1): High power view
showing average-sized congested Glomerulus (G) with average Bowman’s          CONCLUSION
Space (BS), proximal tubules (P) with preserved brush borders (black
arrow) and markedly dilated congested interstitial Blood Vessels (BV)         A classical Ketogenic diet is very-low-carbohydrates, this diet is
(H&E X 400).

Table 5: Blood cholesterol, serum triglycerides, HDL-cholesterol and LDL-cholesterol (mg/dl) in adult male albino rats subjected to different treatment.

                                         G1                   G2                    G3                     G4                    G5
Chlo (mg/dl)           Mean ± S.E        181.2 ± 1.9a         324.0 ± 2.9b          184.6 ± 1.3c           193.6 ± 1.4d          209.6 ± 1.5e
                       %                 --                   78.8                  1.9                    6.8                   15.7
Tri . (mg/dl)          Mean ± S.E        168.2 ± 2.1a         290.9 ± 1.0b          154.7 ± 1.1c           161.9 ± 1.0d          175.0 ± 0.7e
                       %                 --                   72.9                  -8                     -3.7                  4
HDL-C                  Mean ± S.E        35.8±0.3a            33.3 ± 2.8a           51.4 ± 0.4c            44.7 ± 0.3b           41.9 ± 0.3b
                       %                 --                   -7                    43.6                   24.9                  17
LDL-C                  mean±S.E          120.8±1.3a           194.8±0.6b            140.4±0.5d             146.6±0.6c            167.5±0.6e
                       %                 --                   61.3                  21.4                   16.2                  38.7
Each value represented means of 10 records ± S.E. a,b,c,d.e means comparison between all groups which the groups have the same letter mean there is no
significance difference and which have different letter mean there is a significance change.%: Percent of changes from control values.

Anat Physiol, Vol. 10 Iss. 6 No: 336                                                                                                             6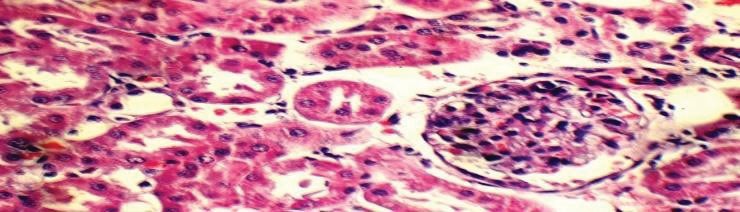
Nour El-Deen AES, et al.                                                                                           OPEN     ACCESS Freely available online

more efficiently in the this study than other types of diet as increase           perspectives. Diab/metabol Res Rev. 2017;33:2886.
total carbohydrate lead decrease ketosis and this leads to the loss of       7. Wong K, Raffray M, Roy-Fleming A, Blunden S, Brazeau AJCJOD.
the desired effect of KD.                                                       The ketogenic diet seen as a normal way of eating by adults with type
                                                                                1 and type 2 diabetes: a qualitative study. 2020.
ACKNOWLEDGEMENT
                                                                             8.    Gheibi S, Kashfi K, Ghasemi A. A practical guide for induction of
We would like to thank Prof. Dr. Mohammad Adel Shalaby Abdel-                     type-2 diabetes in rat: Incorporating a high-fat diet and streptozotocin.
Latif, Professor of Medical Physiology, Faculty of Medicine, Al-                  Biomed Pharmacother. 2017;95:605-613.
Azhar University (Cairo) for his patience, constant support and              9. Engel MM, Kusumastuty I, Anita KW, Handayani D. The Effect of
inspiration during the research, as well as Prof.Dr. ALI Khalil, Prof.          High Fat High Fructose Diet (Modification of AIN-93M) on Nuclear
Dr.Khaled Ahmed Abd El-Sater.                                                   Factor Kappa Beta Expression in the Liver Tissue of Male Sprague
                                                                                Dawley Rats. J Phy. 2019;1374:012042.
CONFLICT OF INTEREST                                                         10. Morrison CD, Hill CM, DuVall MA, Coulter CE, Gosey JL, Herrera
                                                                                 MJ, et al. Consuming a ketogenic diet leads to altered hypoglycemic
The authors declare that they have no competing interest.                        counter-regulation in mice. J Diab Complic. 2020;8:107557.

FINANCIAL SUPPORT                                                            11. Gupta L, Khandelwal D, Kalra S, Gupta P, Dutta D, Aggarwal S.
                                                                                 Ketogenic diet in endocrine disorders: Current perspectives. J Postgrad
This study was funded by Department of physiology, Faculty                       Med. 2017;63:242.
of Medicine, Al-Azhar University, Assuit, Egypt. Without any                 12. Granados-Rojas L, Jerónimo-Cruz K, Juárez-Zepeda TE, Tapia-
particular role in the study design, recruitment of individuals, data            Rodríguez M, Tovar AR, Rodríguez-Jurado R, et al. Ketogenic Diet
analysis or writing of the report.                                               Provided During Three Months Increases KCC2 Expression but Not
                                                                                 NKCC1 in the Rat Dentate Gyrus. Front Neurosci. 2020;1:14.
AUTHOR'S CONTRIBUTIONS                                                       13. Zhang X, Qin J, Zhao Y, Shi J, Lan R, Gan Y, et al. Long-term ketogenic
                                                                                 diet contributes to glycemic control but promotes lipid accumulation and
Nour El-Deen A Mansour A, and Abdallah M. involved in the
                                                                                 hepatic steatosis in type 2 diabetic mice. Nutr Res. 2016;36:349-358.
study concept, design and recruitment of animal, induction of
diabetes and follow up, and contributed to data acquisition; Ali A           14. Blagosklonny MV. The mystery of the ketogenic diet: benevolent
and Abdallah M. performed the biochemical tests; Nour El-Deen                    pseudo-diabetes. Cell Cycle. 2019;18:2157-2163.
A and Gad-Allha. A performed statistical analysis and designed               15. Purhonen J, Rajendran J, Mörgelin M, Uusi-Rauva K, Katayama S,
the figures; Nour El-Deen. A and Abdallah A. performed data                      Krjutskov K, et al. Ketogenic diet attenuates hepatopathy in mouse
interpretation; Abdallah. A, Nour El-Deen. A, Mansour A, and                     model of respiratory chain complex III deficiency caused by a Bcs1l
Gad-Allah 2 A wrote the manuscript; all the authors reviewed the                 mutation. Sci Rep. 2017;7:1-6.
manuscript and finally approved it for submission.                           16. Hippe DS, Phan BA, Sun J, Isquith DA, O’Brien KD, Crouse JR,
                                                                                 et al. Lp (a)(Lipoprotein (a)) Levels Predict Progression of Carotid
REFERENCES                                                                       Atherosclerosis in Subjects With Atherosclerotic Cardiovascular
                                                                                 Disease on Intensive Lipid Therapy: An Analysis of the AIM-HIGH
1. Bolla AM, Caretto A, Laurenzi A, Scavini M, Piemonti L. Low-carb              (Atherothrombosis Intervention in Metabolic Syndrome With Low
   and ketogenic diets in type 1 and type 2 diabetes. Nutr. 2019;11:962.         HDL/High Triglycerides: Impact on Global Health Outcomes)
2. Fatima T, Miyan Z, Naeem N, Riaz M, Basit A. Foot practices in patients       Carotid Magnetic Resonance Imaging Substudy-Brief Report.
   with type 2 diabetes: Where do we stand?. J Diabetol. 2020;11:8.              Arterioscl Thromb Vasc Bio. 2018;38:673-678.

3. Care ADAJD. Lifestyle management:standards of medical care in             17. Lichtash C, Fung J, Ostoich KC, Ramos M. Therapeutic use of
   diabetes-2019. 2019;42:46-60.                                                 intermittent fasting and ketogenic diet as an alternative treatment for
                                                                                 type 2 diabetes in a normal weight woman: a 14-month case study. BMJ
4. D’Andrea Meira I, Romão TT, Pires do Prado HJ, Krüger LT, Pires               Case Rep CP. 2020;13:234223.
   MEP, da Conceição POJFin. Ketogenic diet and epilepsy: what we
   know so far. 2019;13:5.                                                   18. Joshi S, Ostfeld RJ, McMacken M. The ketogenic diet for obesity and
                                                                                 diabetes-Enthusiasm outpaces evidence. JAMA Intern Med. 2019;
5. Cai QY, Zhou ZJ, Luo R, Gan J, Li SP, Mu DZ, et al. Safety and                179:1163-1164.
   tolerability of the ketogenic diet used for the treatment of refractory
   childhood epilepsy: a systematic review of published prospective          19. Kosinski C, Jornayvaz FR. Effects of ketogenic diets on cardiovascular
   studies. World J Ped. 2017;13:528-536.                                        risk factors: evidence from animal and human studies. Nutr. 2017;9:517.

6. Qiu H, Novikov A, Vallon V. Ketosis and diabetic ketoacidosis in          20. Ding J, Xu X, Wu X, Huang Z, Kong G, Liu J, et al. Bone loss and
   response to SGLT2 inhibitors: basic mechanisms and therapeutic                biomechanical reduction of appendicular and axial bones under
                                                                                 ketogenic diet in rats. Exp Therap Med. 2019;17:2503-2510.

Anat Physiol, Vol. 10 Iss. 6 No: 336                                                                                                               7
You can also read