Coordinated Transcription of Key Pathways in the Mouse by the Circadian Clock
←
→
Page content transcription
If your browser does not render page correctly, please read the page content below
Cell, Vol. 109, 307–320, May 3, 2002, Copyright 2002 by Cell Press
Coordinated Transcription of Key Pathways
in the Mouse by the Circadian Clock
Satchidananda Panda,1,4,7 Marina P. Antoch,2,7,8 dian oscillator directs transcription of the photosyn-
Brooke H. Miller,2 Andrew I. Su,1,3 thetic machinery to the daylight hours, thereby ensuring
Andrew B. Schook,2 Marty Straume,5 efficient assimilation of light energy. In mammals, circa-
Peter G. Schultz,1,3 Steve A. Kay,1,4 dian consolidation of locomotor activity to time of food
Joseph S. Takahashi,2 and John B. Hogenesch1,6 availability and predator avoidance functions to improve
1 survival.
The Genomics Institute of the Novartis Research
Foundation The molecular mechanism of the circadian oscillator
San Diego, California 92121 as a transcriptional-translational feedback loop has been
2
Howard Hughes Medical Institute unraveled by genetic analysis in Drosophila and mammals
Department of Neurobiology and Physiology (King and Takahashi, 2000; Young and Kay, 2001). Two
Northwestern University transcriptional activators, CLOCK and MOP3/BMAL1, reg-
Evanston, Illinois 60208 ulate gene expression by interacting with enhancer ele-
3
Department of Chemistry ments termed E boxes. Target genes of these activators
4
Department of Cell Biology include several repressor proteins, including PER1,
The Scripps Research Institute PER2, PER3, CRY1, and CRY2, which function to inhibit
La Jolla, California 92037 the CLOCK/MOP3 complex, thereby generating a circa-
5
Department of Statistics dian oscillation in their own transcription. Although the
University of Virginia core molecular pacemaker is defined, the molecular out-
Charlottesville, Virginia 22904 puts that ultimately regulate circadian control of cellular
physiology, organ function, and systems-level behavior
are poorly understood. Specifically, the link between
Summary circadian transcriptional output and physiology under
circadian control has been lacking. Researchers have
In mammals, circadian control of physiology and be- recently used high-density oligonucleotide arrays to dis-
havior is driven by a master pacemaker located in the cover transcripts with circadian expression patterns in
suprachiasmatic nuclei (SCN) of the hypothalamus. We young Arabidopsis seedlings, Drosophila heads, and
have used gene expression profiling to identify cycling rodents (Claridge-Chang et al., 2001; Grundschober et
transcripts in the SCN and in the liver. Our analysis al., 2001; Harmer et al., 2000; Kita et al., 2002; McDonald
and Rosbash, 2001). Such analysis in plants has identi-
revealed ⵑ650 cycling transcripts and showed that the
fied hundreds of circadian-regulated genes, several
majority of these were specific to either the SCN or
transcription factors that control cycling transcription,
the liver. Genetic and genomic analysis suggests that
and one cis-acting promoter element mediating cycling
a relatively small number of output genes are directly
gene expression. Similar studies in Drosophila have
regulated by core oscillator components. Major pro-
identified a fewer number of cycling transcripts, perhaps
cesses regulated by the SCN and liver were found
reflecting the heterogeneity in fly heads that included a
to be under circadian regulation. Importantly, rate-
few lateral neurons, the relatively larger compound eyes,
limiting steps in these various pathways were key sites
and a significant amount of fat bodies. Finally, temporal
of circadian control, highlighting the fundamental role
gene expression profiling of rat fibroblasts using high
that circadian clocks play in cellular and organismal density arrays (HDA) (Grundschober et al., 2001), the
physiology. kidney and liver using cDNA arrays representing a lim-
ited subset of rat ESTs (Kita et al., 2002), and differential
Introduction display of mouse liver transcripts (Kornmann et al., 2001)
have identified some novel circadian output genes.
Circadian rhythms are near-24-hour rhythms of biologi- In order to dissect how the master oscillator resident
cal processes that persist in the absence of environmen- in the SCN functions to coordinate behavioral and physi-
tal cues such as light and temperature. Such rhythms ological rhythms throughout the whole organism, we
have been described in organisms ranging from photo- have used high-density oligonucleotide arrays to exam-
synthetic prokaryotes to higher eukaryotes and reflect ine the expression of more than 7000 known genes and
the existence of an underlying intrinsic circadian oscilla- 3000 expressed sequence tags (ESTs) over two circa-
tor or biological clock (Harmer et al., 2001; Young and dian days in the SCN and liver. Analysis of temporal
Kay, 2001). This circadian oscillator may impart an ad- patterns of expression revealed nearly 650 circadianly
vantage to the organism by temporally orchestrating regulated transcripts, most of which cycle in either SCN
physiological and behavioral processes to better adapt or liver but not both. Included in this data set are many
to the predictable daily changes in the environment. For transcripts previously identified as circadianly regu-
example, in cyanobacteria and Arabidopsis, the circa- lated, thus validating our approach, along with many
more genes and ESTs previously unknown to be regu-
6
Correspondence: hogenesch@gnf.org
lated by the circadian oscillator. Analysis of expression
7
The first two authors contributed equally to this work. patterns of these genes revealed transcriptional net-
8
Present address: Department of Cancer Biology, Lerner Research works and targets that underlie temporal regulation of
Institute, The Cleveland Clinic Foundation, Cleveland, Ohio 44195. major functions of the SCN and liver. The observation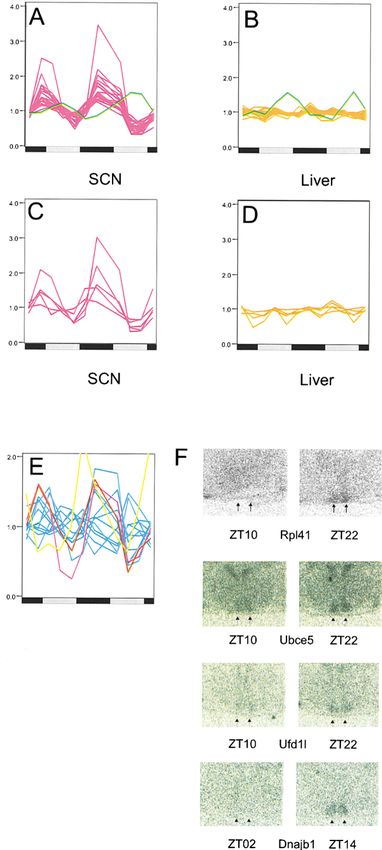
Cell
308
that rate-limiting steps in several pathways are selec- MMC- value of 0.1 to balance the false positive and
tively regulated in the clock demonstrates that the circa- false negative rates of COSOPT. Several genes pre-
dian clock has evolved efficient mechanisms for its com- viously identified as circadianly expressed, including
plex regulation of physiology. A comparison of these Cry1, Per2, Mop3, Ccr4 (nocturnin), Cyp7a1, Alas1, Pa-
results with those recently published in fly revealed that cap, and Gad1 (glutamic acid decarboxylase 1), were
the circadian regulation of several pathways and physi- scored circadian in the appropriate phase and tissue(s)
ologies are conserved over 600 million years of evolu- in our data set, thus validating our strategy. Temporal
tion. Finally, we have constructed a publicly accessible expression patterns of many genes assayed either by
database (http://expression.gnf.org/circadian) that us- in situ hybridization or real-time PCR further validated
ers can query for circadianly regulated genes in the SCN this approach. Some previously known circadian-regu-
or liver, or for the temporal expression patterns of their lated genes, including Per1, were apparently cycling but
genes of interest. had a higher MMC- (0.18 for Per1 in the SCN), usually
because the signal to noise for that probe set was low.
Results and Discussion Therefore, it must be noted that some genes that lie
outside this conservative MMC- cut-off value may be
We entrained C57BL/6J mice to a 12-hour light, 12-hour scored circadian by independent methods. For exam-
dark cycle (LD12:12) under constant temperature for two ple, in situ hybridization has confirmed cycling of
weeks, and then we transferred the mice to constant Kcnma1 (MMC- ⫽ 0.21) in the SCN (discussed below).
darkness. Starting at 30 hr after lights off, which corre- For this reason, we have presented our data in a pub-
sponds to circadian time 18 (CT18), tissue samples were licly accessible database with active links to other public
collected from ten mice every 4 hr for two complete sources of gene annotation. The circadian database
circadian cycles. This strategy excluded light-regulated (http://expression.gnf.org/circadian) can be searched in
genes that are not under endogenous circadian control, a text-based query for temporal expression patterns of
while the second circadian cycle ensures a repeating a given gene in the SCN or in liver or, alternatively, to
pattern of 24 hr and serves as a replicate of the first day. find genes that meet a given MMC- cut-off value. The
For each time point, biotinylated cRNAs were prepared output of the search is a graphical representation of
from pooled mRNA and hybridized to duplicate sets of the hybridization data along with an associated MMC-
high-density microarrays (HDAs) (Affymetrix, Palo Alto, value and gene annotation.
CA) to minimize experimental error. Expression values
for each gene were interrogated for circadian variation Circadian Gene Expression Is Tissue Specific
using a cosine wave-fitting algorithm, COSOPT, which The availability of a comprehensive temporal gene ex-
is a modified version of a previously described algorithm pression data set from two different tissues offered an
CORCOS (Harmer et al., 2000). For each probe set (tran- opportunity for a systematic analysis of circadian tran-
script), COSOPT performed an arithmetic linear-regres- scriptional outputs of the clock. We determined that
sion detrend of the original time series. In a two-stage about 650 genes were under circadian control in the
analysis, the detrended data set was tested for fitness SCN and liver (Figures 1A–1C; see Supplemental Tables
to cosine test waves with average periodicity of 24 hr S1 and S2 at http://www.cell.com/cgi/content/full/109/
(see Experimental Procedures). First, the data set was 3/307/DC1.) The peak expression of these genes was
tested for fitness to several cosine test waves, and then distributed throughout the circadian cycle (Figures 1A
the significance of fit (if any) was empirically tested. and 1B), with CT10 (ten hours after subjective dawn)
This process results in a multiple measures corrected and CT22 having the most circadianly regulated tran-
 (MMC-) value denoting the goodness of fit of the scripts in the SCN—roughly anticipating dusk and dawn
time course to a circadian pattern of expression (period (Figure 1C). In liver, the largest clusters of circadianly
and phase) that is independent of the amplitude of rhyth- regulated transcripts occurred at CT14 and CT06 (Figure
micity and is weighted for experimental error at each 1C), likely indicating the distinct temporal organization
time point. This strategy precludes user bias for ampli- of the physiologies mediated by the liver.
tude, accounts for hybridization variability, and accom- Comparison of the overlap between cycling genes in
modates a slight variability in period length. Transcripts the SCN and liver revealed only 28 genes in common
whose traces fit a cosine wave with a period of between (Figure 1D; see Supplemental Table S3 at http://www.
20 and 28 hr with MMC- value of ⬍0.1 were considered cell . com / cgi / content / full / 109 / 3 / 307 / DC1 ) . These
circadianly regulated. This cutoff value was chosen genes included the oscillator component Per2 as well
based on two observations. First, comparison of MMC- as several genes whose transcripts were previously un-
values for genes previously identified as circadianly reg- known to cycle. Transcripts that cycle in all tissues may
ulated indicate that a cutoff value of 0.1 successfully represent basic circadian outputs of cellular physiology
identifies ⵑ75% of cycling genes (see Supplemental or components of the circadian oscillator itself such as
Table S4 and Supplemental Figure S1 at http://www.cell. Per2. As previously noted, most transcripts, including
com/cgi/content/full/109/3/307/DC1). To calculate the Per2 and Rev-erb , are delayed by 4 to 8 hr in peak
false positive rate, 1000 simulations were performed expression in liver with respect to the SCN (Figures
considering duplicate Gaussian random time series that 1E–1G; Zylka et al., 1998). However, several were coordi-
simulated data collections from 0 to 48 hr at 4 hr sam- nately regulated to the same phase in both tissues, in-
pling interval. Under these conditions, the false positive cluding tubulin  5 (Tubb5), and a transforming growth
rate was below 1%. Taking into account the rising false factor  1-induced transcript (Tgfb1i4). To further inves-
positive rate as MMC- values increase, we chose an tigate the overlap in cycling genes between the SCN
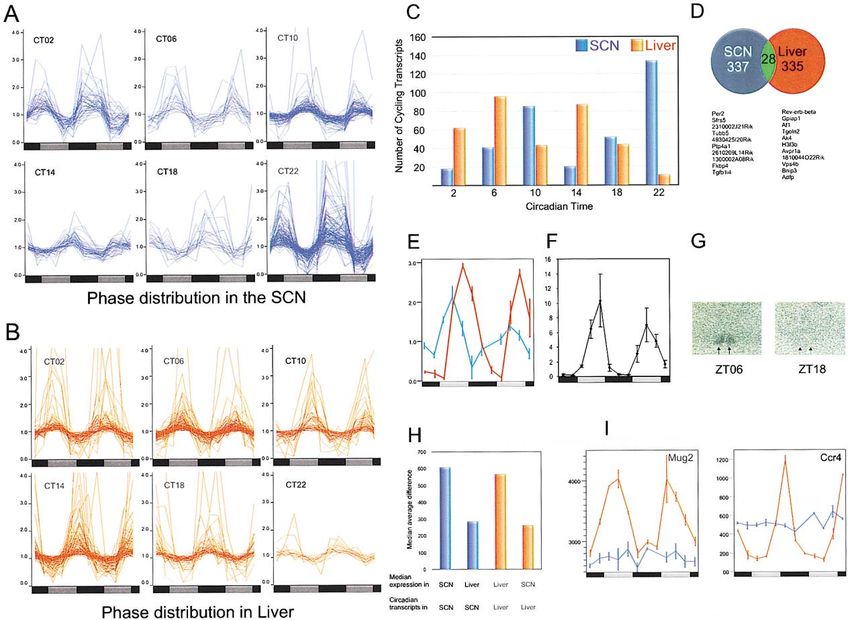
Circadian Transcriptional Outputs in Mammals 309 Figure 1. Circadianly Regulated Genes in the SCN and Liver We determined 337 SCN and 335 liver transcripts to be circadianly regulated by COSOPT, and they were binned into six circadian phases, 2, 6, 10, 14, 18, and 22, by cluster analysis. Data traces of different phase clusters (A) in the SCN and (B) in liver. Expression patterns for these transcripts were visualized using Genespring (Silicon Genetics, Redwood City, CA). Data were normalized such that the median signal strength for each gene over all time points was 1. The average signal strength at each time point was then displayed as a ratio relative to the median signal strength of that gene. Values in the x axis represent hours after the first subjective dawn. (C) Distribution of cycling transcripts in the SCN (blue bars) and liver (red bars) by circadian phase clusters. (D) Cycling transcripts are tissue specific. Transcripts indicated as cycling (MMC- ⬍ 0.1) were compared between SCN (blue) and liver (red) with transcripts cycling in both tissues indicated by the intersection (green) and listed below. (E) Cycling of Rev-erb- (U09504) in SCN (blue) and liver (red) was confirmed by (F) real-time PCR assays of liver samples and (G) SCN in situ hybridization (arrows point to the SCN). Mean ⫾ SEM are shown in (E) and (F). (H) Median expression levels of SCN circadian transcripts in the SCN and liver (in blue), and liver circadian transcripts in liver and in the SCN (red). A description of the distribution of median expression levels of these genes in the two tissue types and some examples are represented in Supplemental Figures S2 and S3 at http://www.cell.com/cgi/content/full/109/3/307/DC1. (I) The expression patterns for Mug2 (left) and for Ccr4 (right) are shown with SCN expression indicated in blue and liver expression indicated in red. Mean average difference values ⫾ SEM at each time point are shown. and liver, we determined the median level of expression also be accessed at http://expression.gnf.org. Other for cycling genes derived from either tissue in both tis- genes, such as carbon catabolite repression 4 homolog, sues. This analysis revealed that in general cycling Ccr4, are expressed at approximately the same levels genes from one tissue have lower expression levels in in both SCN and liver, yet only cycle in the liver (Figure the other (Figure 1H). In addition, a significant number 1I). The previously described circadian expression pat- of cycling genes in the liver or SCN are not expressed tern of Ccr4 in several other peripheral tissues such as at detectable levels in the alternate tissue (Supplemental kidney, heart, spleen, and retina, but not in the SCN, Figure S2). An example is murinoglobulin 2 (Mug2), highlights the tissue-specific component to circadian whose expression is tightly restricted (and circadianly transcriptional rhythmicity in higher animals (Wang et regulated) to the liver (Figure 1I; Lorent et al., 1994). al., 2001). Several other examples of the multiple tissue expression Such tissue-specific circadian regulation of transcrip- profiles of these genes (Su et al., 2002), along with their tion is a distinct feature of the circadian clock in higher circadian expression profiles in the SCN or liver, are organisms. In primitive unicellular organisms, the circa- presented in Supplemental Figures S3A–S3J, which can dian oscillator directs transcription of a significantly
Cell
310
large portion of the genome in similar phase from cell to
cell (Liu et al., 1995). In multicellular organisms, however,
the clock may direct transcription of a small subset of
genes in different organs relevant to the distinct function
of that organ. A master oscillator resident in the SCN
orchestrates circadian regulation in different organs to
produce systems-level circadian changes in behavior
and physiology to adapt to daily changes in the environ-
ment. Such circadian organization demands at least a
two-tier regulation of clock outputs; while the core clock
resident in the SCN regulates SCN function and coordi-
nates slave oscillators resident in the periphery, the pe-
ripheral oscillators regulate the specific function rele-
vant to their tissue or organ function. Therefore, the
determination of the full complement of mammalian
genes under the control of the circadian oscillator will
require systematic analysis of temporal gene expression
in multiple organs.
Clock Gene Regulation of Transcription
To test whether the core circadian transcriptional activa-
tor, CLOCK (Gekakis et al., 1998; King et al., 1997), was
involved in the regulation of most of the circadianly regu-
lated output genes, we analyzed gene expression of
Clock mutant mice at a time when CLOCK/MOP3 tran-
scriptional activity is normally at its peak. The Clock
mutant allele is an antimorph (a type of dominant-nega-
tive mutation) that antagonizes transcription induced by
the CLOCK/MOP3 activator complex. At the behavioral
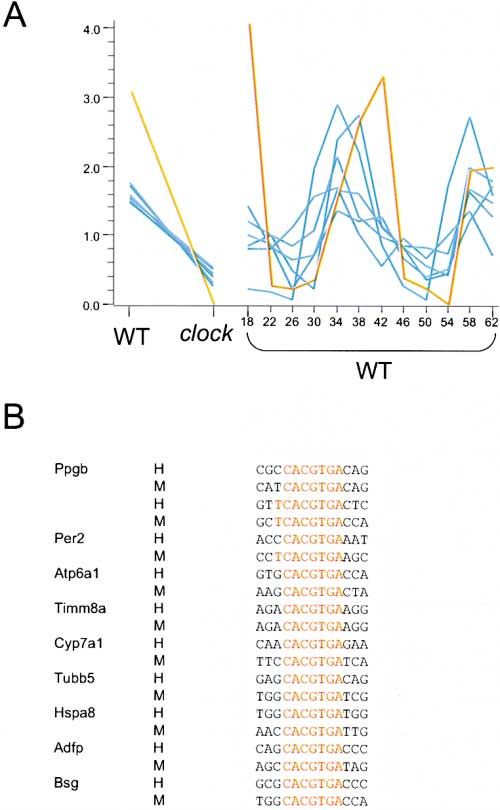
level, these mice exhibit a lengthened endogenous pe- Figure 2. Regulation of Circadian Output Genes by Clock
riod and become arrhythmic in complete darkness (Vi- (A) The expression pattern of cycling liver transcripts whose steady-
state levels are suppressed by the Clock mutation were derived
taterna et al., 1994). We hypothesized that transcripts
(see Supplemental Table S5). The temporal expression patterns of
that are downregulated in Clock/Clock mice would po- these genes under free running conditions in wild-type mice and the
tentially be direct targets of the CLOCK protein. Further- transcript levels in both mutant and wild-type livers at ZT8 (roughly
more, downregulated transcripts that normally share equivalent to CT32 of free running condition) are shown. Per2 ex-
Per2-phased expression are likely targets of a CLOCK/ pression is in orange.
MOP3 heterodimer binding at an E box element present (B) A search for the CLOCK/MOP3 binding site in 10kb 5⬘ upstream
regions of 127 circadianly regulated mouse genes and their respec-
in their structural genes. A direct comparison of gene
tive human homologs retrieved nine genes with this sequence con-
expression between wild-type (wt) and Clock/Clock served in both species. The core consensus site from each gene is
mice at zeitgeber time (ZT) 8, a time of maximal CLOCK/ indicated along with flanking nucleotides. When two sites were
MOP3 transcriptional activity (Young and Kay, 2001), found in a single promoter region, both are indicated. Gene names
revealed 97 probe sets showing at least a 2-fold change are derived from Refseq (Pruitt et al., 2000).
in expression level (56 downregulated and 41 upregu-
lated in the mutant). Surprisingly, only nine of these
transcripts were cycling in the livers of wild-type mice, 2001). To enrich for conserved response elements, we
suggesting that Clock may be involved in processes searched for the presence of the CACGTGA sequence
other than circadian transcriptional regulation. The ex- in genomic sequence 5⬘ of the start of translation in
tensive transcriptional disruption in the Clock/Clock mu- both the mouse and human genomes. Of the nearly 650
tant mice is similar to the effect of the jrk mutation in cycling genes identified by microarray, we were able
flies in that transcriptional targets of dCLOCK are wide to unambiguously retrieve the sequences of 127 genes
ranging beyond circadian outputs (Claridge-Chang et from both species. Surprisingly, only nine genes har-
al., 2001; McDonald and Rosbash, 2001). Of these nine bored a CLOCK/MOP3 binding site in both species, in-
putative targets of CLOCK, seven transcripts were re- cluding Per2 and Tubb5 (Figure 2B). Although this may
duced in the mutant, including Per2, and most cycled reflect the fact that enhancer elements can occur at
in phase with Per2 (Figure 2A). Conversely, the two re- other locations than 5⬘ of the start methionine, a rela-
maining transcripts could be repressed either indirectly tively small number of cycling promoters harbor obvious
or potentially directly by CLOCK itself. CLOCK binding sites. This observation is consistent with
Another line of evidence that could indicate CLOCK the results derived from the gene expression profiling
regulation of target genes would be the identification of of the Clock/Clock mutant mice and suggests that the
a CLOCK/MOP3 binding site in their candidate promoter circadian oscillator interacts with transcriptional net-
regions (Hogenesch et al., 1998). To accomplish this, works underlying tissue-specific gene expression to or-
we took advantage of the recently available mammalian chestrate cycling transcription of separate sets of genes
genome sequences (Lander et al., 2001; Venter et al., in different tissue types.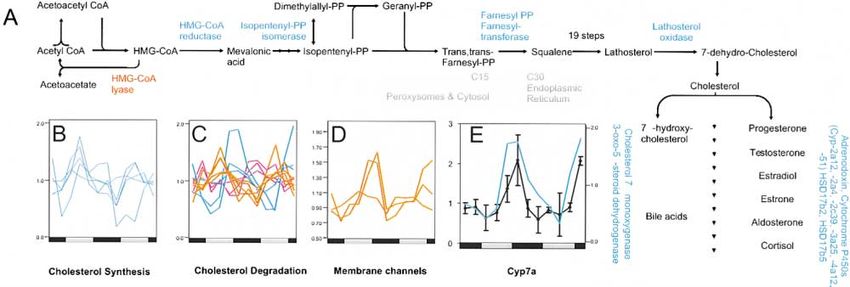
Circadian Transcriptional Outputs in Mammals
311

Circadian Control of Organ Functions
To relate circadian-regulated transcripts with cellular
physiology and organ function, we annotated the cycling
genes and organized them into distinct pathways and
functions. Such analysis revealed that a large proportion
of circadianly regulated genes are implicated in func-
tions specific to the SCN or liver.
Circadian Gene Regulation in the SCN
In mammals, the SCN is the anatomical site of a master
circadian oscillator that imparts a daily rhythm in loco-
motor activity and associated physiologies such as
feeding and metabolism. The SCN is thought to accom-
plish this by generating rhythms in various signaling
cascades via both neural projections and possibly by
diffusible factors, ultimately leading to the generation
of organism-level rhythmic behaviors and physiologies.
Major functions of the SCN, including protein/neuropep-
tide synthesis, processing, and degradation, as well as
regulation of redox state and energy utilization, were all
found to be circadianly regulated (Figures 3–5).
   We also found cycling of a number of genes involved in
pathways already experimentally linked to the circadian
control of locomotor activity by the SCN. For example,
we found that Rgs16 and Eps15 are circadianly regu-
lated. These proteins are phosphorylated by the EGF
receptor (Derrien and Druey, 2001; Fazioli et al., 1993),
which has recently been implicated in circadian regula-
tion of mouse locomotor activity (Kramer et al., 2001).
We also found transcriptional cycling of neuronal nico-
tinic receptor b2 (Chrnb2), the mouse homolog of a gene
mutated in the human disorder nocturnal frontal lobe
epilepsy (De Fusco et al., 2000; Phillips et al., 2001).
This suggests a possible role for Chrnb2 in rhythmic
control of motor coordination.
   While the detailed pathways relating function of the
above-mentioned genes to locomotor activity rhythms
are yet to be described, transcripts for several well-
defined prohormones and peptide neurotransmitters
were also found to cycle in the SCN. They include proop-
iomelanocortin (Pomc), pituitary adenylate cyclase-
activating polypeptide 1 (Pacap), cholecystokinin, and
PDGF. Additional molecules, such as arginine-vaso-
pressin (Avp), vasopressin receptor-␣, somatostatin, en-
kephalin, galanin, and calcitonin gene-related peptide
(Cgrp), have previously been reported to cycle at the
mRNA levels in the SCN (Ibata et al., 1999). We also
observed rhythms in the mRNA levels of genes involved
in biosynthesis of nonpeptide neurotransmitters such
                                                             Figure 3. Circadian Regulation of Components of Protein Turnover
as GABA and histamine (glutamic acid decarboxylase
                                                             in the SCN
1 [Gad1], histidine decarboxylase [Hdc-c]), as well as a
                                                             Transcripts for ribosomal proteins (SCN, violet; liver, orange) and
large number of genes implicated in synthesis, pro-          Sui1 (green) (A and B) and protein processing components (Nac-␣,
cessing, and release of neuropeptides and neurotrans-        Srp14, Srp9, Sec61-␥) (C and D) peak during night in the SCN (A
mitters.                                                     and C) but not in liver (B and D). (E) Genes involved in protein folding
   Peptide Synthesis, Processing, and Secretion. The         and proteasome-mediated protein degradation (Supplemental Ta-
largest group of coordinately cycling transcripts in the     ble S6) are circadianly regulated in the SCN. Cycling of Ubce5 (red),
SCN is involved in protein synthesis. More than 20 tran-     Ufd1l (magenta), and Dnajb1 (yellow) were confirmed by in situ hy-
                                                             bridization in the SCN at peak and trough levels of expression (F).
scripts representing cytoplasmic ribosomal protein
                                                             Cycling of the Rpl41 transcript was also confirmed by in situ hybrid-
components and 13 representing mitochondrial ribo-           ization (F). Arrows indicate the SCN.
somal proteins showed coordinate cycling with a peak
phase of expression at CT22 in the SCN but not liver
(Figures 3A and 3B). The control points in ribosome          poral component of ribosome turnover to enhance neu-
biogenesis and the half-lives of ribosomes themselves        ropeptide/protein synthesis at particular circadian time
exhibit great variability with tissue types (Kimball and     points. In support of this hypothesis, diurnal changes
Jefferson, 1994). SCN neurons may have adopted a tem-        in morphology and size of nucleoli in the rat supraoptic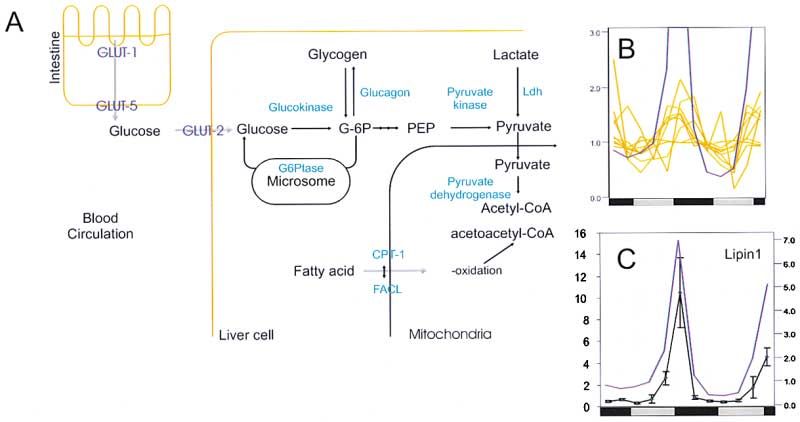
Cell 312 nucleus and superior cervical neurons have previously accentuate cycling levels of a large number of proteins been observed (Bessone and Seite, 1985; Seite and Peb- including neuropeptides. usque, 1985). An important group of circadian output genes in the Several genes involved in steps subsequent to trans- SCN includes proteins involved in neurosecretory pro- lation were also found to be circadianly regulated. cesses and signaling. Coordinated expression of tran- Shortly after initiation of translation, two different cyto- scripts from genes involved in prohormone processing, plasmic complexes, a dimeric nascent polypeptide- vesicle transport and fusion, and late endosomal pro- associated complex (NAC) and a multimeric ribonucleo- cessing occurred during the anticipation of dawn and protein complex signal recognition particle (SRP), com- dusk (Figures 4A–4C). Sgne1, a secretory granule pro- pete for binding to the nascent polypeptide exiting the tein that activates prohormone convertase 2 (Pcsk2) ribosome (Raden and Gilmore, 1998). The SRP selects (Braks and Martens, 1994), exhibits a circadian rhythm signal-containing ribosomes for targeting, while binding in its transcript expression. Pcsk2 has been previously of the NAC prevents targeting of signal peptideless na- implicated in the processing of several neuropeptides scent chains to the endoplasmic reticulum (ER) mem- including somatostatin (Mackin et al., 1991), an inhibi- brane (Raden and Gilmore, 1998). Once the SRP binds tory neurotransmitter that is itself circadianly regulated to and docks proper ribosomes to the ER, the subse- to the same phase as Sgne1. Sgne1, therefore, may be quent step of protein translocation requires the trimeric accentuating the circadian expression of somatostatin, Sec61p complex. Oligomers of the Sec61 complex form resulting in a protein rhythm with a peak at CT4 (Shino- a transmembrane channel where proteins are translo- hara et al., 1991). Another secretory granule protein, cated across and integrated into the ER membrane secretogranin III (Scg3), also exhibits circadian regula- (Jungnickel and Rapoport, 1995). The Sec61 complex tion (Figure 4C). has also been implicated in the translocation of mis- Several components involved in vesicle trafficking are folded proteins from the ER to the cytosolic protein circadianly regulated to two distinct phases. AP4-sigma, degrading machinery, thereby ensuring folding of newly involved in trans-golgi cycling (Hirst et al., 1999); synap- synthesized proteins with fidelity (Romisch, 1999). Con- sin 1, implicated in maintenance of a release-ready pool stituents of the NAC (Naca), SRP (Srp9, Srp14), and of presynaptic vesicles (Li et al., 1995); and Vps29, in- Sec61 ( and ␥) complexes exhibited coordinated tran- volved in recycling components from the endosome to scriptional cycling (Figure 3C) in phase with the ribo- the trans-golgi (Seaman et al., 1997), all cycle in phase somal cluster. In this manner, the circadian oscillator in with Sgne1 and somatostatin. In contrast, Snap25 and the SCN coordinates protein synthesis and processing Munc18c (Jahn, 2000), which mediate vesicle fusion; to the night, while no rhythm in these transcripts was Eps15, implicated in vesicle recycling (Salcini et al., detected in the liver (Figures 3B and 3D). 2001); and Vps4b, involved in late endosomal vesicle In order for the protein products of transcriptionally transport (Yoshimori et al., 2000), cycle with a peak in the regulated genes to have a circadian rhythm, their syn- late subjective day, CT10 (Figures 4A and 4B). Finally, we thesis and degradation must be tightly regulated. To found cycling transcription of the mammalian ortholog begin to identify candidates for such regulation, we ex- of Drosophila Slo, Kcnma1 (Figures 4D and 4E), that amined our circadianly regulated transcripts for compo- functions as a calcium-activated potassium channel and nents of protein folding and ubiquitin-mediated protein is believed to play a critical role in control of neurosecre- degradation pathways. Dnajb1, a member of DnaJ family tion (Lara et al., 1999; Lovell and McCobb, 2001). In (HSP40) of chaperonins, is circadianly regulated in the Drosophila, both Slo and a channel activity upmodula- SCN (Figures 3E and 3F), while Dnaja1 and Dnajb6 cycle tor, Slob, cycle in the head (Claridge-Chang et al., 2001; in the liver. Many proteins are degraded in a process McDonald and Rosbash, 2001). Fly strains carrying mu- in which ubiquitination facilitates their recognition and tations in Slob are behaviorally arrhythmic, implying a degradation via the proteasome. Some of these proteins role of this potassium channel in circadian regulation of are targeted for such degradation via their interaction activity (Ceriani et al., submitted). These observations with F box-containing proteins (del Pozo and Estelle, suggest that circadian regulation of neurotransmission 2000). Nearly 12 genes coding for F box-containing pro- occurs both at the level of secretory control factors, teins, ubiquitin-like proteins, ubiquitin-conjugating en- peptide hormones, and neurotransmitters themselves, zymes, ubiquitin fusion degradation-like proteins, and and underscores the importance of neurosecretion as proteasomal subunits (Figure 3E; see Supplemental Ta- a primary mechanism of SCN control over peripheral ble S6 at http://www.cell.com/cgi/content/full/109/3/ circadian activity. 307/DC1) were found to be circadianly regulated. Peak Redox and Energy Flux in the SCN. Several genes phases of expression of these genes are distributed involved in energy production exhibit circadian rhythms throughout the circadian cycle, which may facilitate tar- in their steady-state mRNA levels in the SCN. These geted degradation of specific proteins at different circa- genes code for components involved in carbon utiliza- dian times. It is important to note that cycling steady- tion, oxidative phosphorylation, and the interconversion state mRNA level may not always result in cycling protein of nucleotide triphosphates. The transcripts of three ma- levels. There are examples of genes whose mRNAs jor enzymes involved in carbon utilization, hexokinase1 cycle, although their protein levels do not. Conversely, (Hk1), malate dehydrogenase, and mitochondrial 3-ket- certain protein products cycle even though their tran- oacyl-coa thiolase, cycle in the SCN with a peak expres- scripts do not (e.g., lark and pdf from Drosophila) (Newby sion at CT22, consistent with previous observations that and Jackson, 1993; Renn et al., 1999). In sum, concerted 2-deoxyglucose utilization exhibits a marked circadian action of ribosome biogenesis and translation and pro- oscillation (Schwartz and Gainer, 1977). Hexokinase 1 tein processing, folding, and degradation may ultimately and malate dehydrogenase mediate the use of glucose
Circadian Transcriptional Outputs in Mammals
313
Figure 4. Circadian Expression of Vesicle Trafficking Components and of Kcnma1 in the SCN
(A) Cycling genes along with their suggested function in different stages of vesicle transport are indicated. Color-matched data traces of
cycling transcripts are shown in (B). Also shown are the traces of Sgne1 in orange and somatostatin in green.
(C) In situ hybridization signals of Sgne1 at the peak and trough levels of its expression supports cycling.
(D) The transcript for the voltage-dependent potassium channel Kcnma1 cycles in the SCN.
(E) In situ hybridization signals of the Kcnma1 transcript also exhibit cycling to the appropriate phase.
as an energy source, and mitochondrial 3-ketoacyl-coa of the organism. It receives blood supply from the portal
thiolase regulates the use of ketone bodies—the major vein as well as from hepatic arteries. The portal veins
energy source in neurons. Reducing power derived from supply a wide range of nutrients, xenobiotics, and
the breakdown of glucose and ketone bodies is ulti- pathogenic elements from the digestive system, while
mately used in mitochondrial oxidative phosphorylation the hepatic arteries supply a variety of endobiotic com-
to generate ATP and subsequently other NTPs. More pounds including cytokines, metabolites, and hor-
than 20 components of the multisubunit mitochondrial mones. The major functions of the liver include the me-
complexes mediating oxidative phosphorylation and a tabolism of nutrients, endobiotics, and xenobiotics, the
nucleotide diphosphate kinase (ndk3) mediating inter- production of many ligands and cofactors, and the pro-
conversion of ATP and GTP are coordinately regulated duction of several serum proteins, which serve as the
and peak at CT22, perhaps anticipating the diurnal burst first line of defense against pathogenic particles. We
of neuronal activity (Figures 5A and 5B; Welsh et al., found circadian regulation of many genes implicated in
1995). Such tight circadian coordination of the mito- these major functions of the liver.
chondrial oxidative phosphorylation pathway may sug- Nutrient Metabolism. Coordinated circadian expres-
gest a rhythm in redox state of the SCN neurons. sion of glucose transporters, the glucagon receptor, and
Circadian Gene Regulation in the Liver enzymes involved in rate-limiting steps in the metabo-
The liver is the largest solid organ of the body and lism of hexose sugars were observed with a peak phase
through its central role in metabolism and energy pro- of expression in early evening (Figures 6A and 6B), the
duction, it significantly affects the physiological status time when most feeding occurs in nocturnal rodents. In
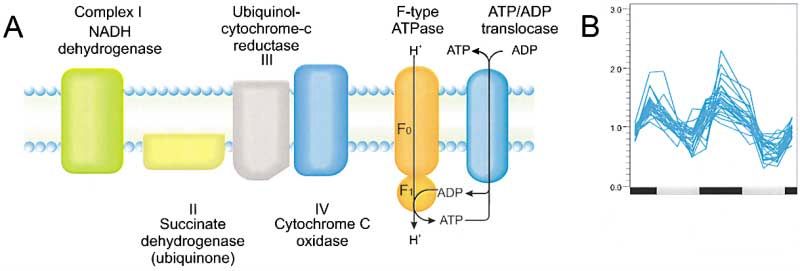
Figure 5. Circadian Regulation of Compo-
nents of Oxidative Phosphorylation in the
SCN
(A) Mitochondrial oxidative phosphorylation
or the transfer of electrons from NADH to
molecular oxygen with concomitant ATP pro-
duction occurs in the mitochondrial mem-
brane in four separate multisubunit com-
plexes. The resulting proton-motive force is
used by the multi subunit F-type ATPases
to generate ATP from ADP. Components of
these complexes are encoded by both the
mitochondrial and nuclear genomes.
(B) At least seven nuclear components of complex I, one each of complexes II and III, and six of complex IV, as well as three components
of the F-type ATPase, and mitochondrial ADP/ATP translocase 2 (Supplemental Table S6) peak during the subjective night.Cell
314
Figure 6. Circadian Regulation of Compo-
nents of Energy Metabolism in Liver
(A) An overview of glucose and fatty acid me-
tabolism in the liver. Cycling transcripts cod-
ing for enzymes and transporters are shown
in blue.
(B) Components of gluconeogenesis, glycoly-
sis, and fatty acid metabolism peak during
the night when the animals consume the ma-
jority of their diet. Glut1 and Glut5 are known
to cycle in the intestine during the night
(Rhoads et al., 1998; Castello et al., 1995).
(C) A putative regulator of fatty acid utiliza-
tion, lipin 1 (Peterfy et al., 2001) also cycles
with a peak expression during day. Cycling
of lipin 1 from the microarray data set (in pur-
ple and 2nd y axis) was also confirmed by real-
time PCR (in black).
concert, these genes may facilitate glycogen synthesis thetic enzymes in a single pathway may ensure a tighter
during feeding and the use of hexose sugars as a primary circadian regulation of cholesterol production, or poten-
energy source for several hours in the postadsorptive tially may indicate that circadian regulation of the inter-
period (Arias et al., 2001). Circadian control of sugar- mediates in the cholesterol synthetic pathway is impor-
utilizing components (Glut2, glucose-6-phosphatase tant. While the timing of cholesterol synthesis is directed
transport protein 1, pyruvate kinase, glucagon receptor) to the subjective day (when dietary cholesterol supply
may constitute the underlying molecular bases of circa- is low), the degradation products of cholesterol, steroids
dian control in glucose uptake and insulin response in and biles, are produced at different times of the day
rodents (la Fleur et al., 2001). In addition, we found cy- (Figures 7A and 7C). Reflective of this, transcripts of
cling of lipin1, thought to be infolved in the regulation many cytochrome P450s and enzymes involved in cho-
of sugar and lipid metabolism, and recently found mu- lesterol catabolism (Kornmann et al., 2001) were found
tated in a mouse model of human familial lipodystrophy to be circadianly regulated and phased to the appro-
(fld) (Figure 6; Peterfy et al., 2001). Similarly, the circa- priate time of their utilization (Figures 7C and 7D).
dian oscillator facilitates the use of short- and medium- The liver is the only organ that converts cholesterol
chain fatty acids during nighttime feeding and of stored to bile acids, and it uses a set of enzymes with broad
very long-chain fatty acids during the day. This temporal substrate specificity for the breakdown and excretion
orchestration may optimize the use of absorbed nutri- of cholesterol and of many xenobiotics. These enzymes
ents for energy generation and storage during feeding, play a critical role in determining the bioactivity of drugs
and a switch to stored and alternative energy sources and their in vivo half-lives. This process occurs in two
during fasting. Circadian regulation of energy metabo- phases, with the first phase consisting of side group
lism in the liver may have implications in energy storage oxidation and hydroxylation and the second involving
diseases. the addition of a polyatomic group such as sulfate, gluta-
Intermediate Metabolism. The liver is the major site thione, glucuronate, or an amino acid such as glycine
of intermediate metabolism including the synthesis and or taurine (Arias et al., 2001). These processes change
degradation of cholesterol and the production of many the bioactive properties of many substrates and en-
ligands and cofactors. Cellular cholesterol homeostasis hance their solubility at acidic pH. We found circadian
is maintained by the coordinated action of biosynthetic regulation of transcripts for more than 10 cytochrome
and degradative enzymes, transporters, and receptors P450s and related genes mediating the phase I oxidation
(Figure 7; Ioannou, 2001). Niemann-Pick C1 (Npc1) plays of cholesterol (Figures 7A and 7E). Synthesis of conjuga-
a critical role in the intracellular trafficking of salvaged tion partners, such as taurine and glycine, or enzymes
cholesterol from the late endosome to the trans-Golgi of the second phase biotransformation, such as GST,
network; patients carrying a mutant NPC1 gene develop was also found to be under circadian control. For exam-
a condition with high cholesterol levels in the endoso- ple, we found cycling of cysteine dioxygenase (Cdo).
mal-lysosomal system (Carstea et al., 1997). Transcript Cdo catalyzes reduction of cysteine to 3-sulfinoalanine,
levels of Npc1, as well as of enzymes in the cholesterol which is subsequently metabolized to taurine and sulfite
biosynthetic pathway, exhibited a circadian rhythm (Fig- (Michal, 1999).
ure 7B). De novo cholesterol biosynthesis starts with Xenobiotic metabolism has long been known to de-
the conversion of acetoacetyl CoA to 3-hydroxy-3-meth- pend on the time of day (Lake et al., 1976). One important
ylglutaryl-CoA (HMGCoA). Subsequent conversion of mechanism for this metabolism is methylation, as it al-
HMGCoA to mevalonate by HMGCoA reductase (Hmgcr) ters the activity of many xenobiotics. Four methyltrans-
is rate limiting and has long been known to be clock ferases exhibited circadian rhythms in their transcript
regulated in mammals (Shapiro and Rodwell, 1969). In levels: betaine-homocysteine methyl transferase (Bhmt),
addition to transcriptional regulation of Hmgcr, we found nicotinamide N-methyltransferase (Nnmt), thioether
four other enzymes in the cholesterol synthetic pathway S-methyltransferase (Temt), and thiopurine methyltrans-
that exhibited coordinated cycling in their transcription ferase (Tpmt). Importantly, the activities of most methyl-
(Figure 7B). This coordinated cycling of several biosyn- transferases are fine-tuned by the cellular concentrationCircadian Transcriptional Outputs in Mammals 315 Figure 7. Circadian Regulation of Cholesterol Metabolism in Liver (A) An overview of the cholesterol synthetic pathway in animals (Michal, 1999). Reactions from 3-carbon acetyl CoA up to 15-carbon (C15) trans-trans farnesyl-PP take place in the peroxisome and cytosol. Steps after the circadianly regulated condensation of two C15 units to form squalene proceed on the ER. Degradation of cholesterol produces different steroids, and finally bile acids. (B) Enzymes of cholesterol biosynthesis (in blue) peak during the night. (C) Enzymes of cholesterol degradation peak at different times of the day. (D) Transcripts of three membrane channels, Mrp2, Slc22a1, and Slc22a2, which transport bile acids and organic cations, also cycle. (E) Cycling of Cyp7a (in blue) was confirmed by real-time PCR (black). of S-adenosylhomocysteine (SAH) (Michal, 1999). We proteins. Transcript levels of agents of innate immunity, observed cycling transcript levels of SAH hydrolase, such as mannan binding lectin serine protease 1 which catalyzes the reversible hydrolysis of SAH to (Masp1), mannose binding lectin (Mbl2), and proinflam- adenosine and L-homocysteine and regulates the intra- matory protein phospholipase A2, exhibited a circadian cellular SAH concentration. Finally, conjugated bile rhythm in their steady-state mRNA levels. Binding of acids and biotransformed xenobiotics are excreted from Mbl2 or Masp1 to high mannose and N-acetylglucos- hepatocytes by different membrane transporters, some amine oligosaccharides present on a variety of microor- of which (Slc22a1, Slc22a2, and Mrp2) were found to ganisms activates Masp1, which in turn recruits C4 and be cycling (Figure 7D). The organic cation transporters C2 complement proteins to trigger the lectin pathway Slc22a1 and Slc22a2 transport choline and polyamines, of the complement cascade (Michal, 1999). Transcripts while substrates for Mrp2 include bile acid conjugates, of both Mbl2 and Masp1 cycle with a peak expression glutathione-, glucuronate-, and anionic conjugates of level around late afternoon, perhaps preparing the body both endobiotics and xenobiotics (Arias et al., 2001; for an encounter with bacterial pathogens in the early Kullak-Ublick et al., 2000). Circadianly regulated tran- hours of activity and feeding. scription of components of xenobiotic metabolism and A number of components of coagulation and fibrino- excretion may account for observed chronotoxicity and lytic pathways are synthesized in liver. Although circa- bioavailability of a large number of drugs and drug me- dian regulation of coagulation and fibrinolytic activities tabolites (Focan, 1995). has been described in humans (Andreotti and Kluft, The liver is the major site of synthesis of many bioac- 1991; Labrecque and Soulban, 1991), we observed a tive molecules, such as nuclear receptor ligands, poly- transcriptional rhythm in several key regulators pre- amines, cofactors, and the oxygen carrier heme. For viously unknown to cycle. Factors such as tissue factor example, the thyroid gland releases inactive thyroxine pathway inhibitor 2 (Tfpi2), heparin cofactor II (Serpind1), (T4) into blood circulation, which is subsequently deion- ␣-2 antiplasmin (Serpinf2), and ␣-2 macroglobulin all ized to the active T3 form by the liver enzyme deiodi- displayed a pronounced circadian rhythm in their nase1 (Dio1). Circadianly regulated synthesis and re- steady-state mRNA levels. Tfpi2 is a regulator of the lease of T4 from the thyroid has long been considered extrinsic pathway of blood coagulation through its ability the underlying mechanism in maintaining a daily rhythm to inhibit factor Xa and TF-VIIa activity. Formation of TF- in serum T3. This proposed mechanism, however, fails VIIa complex is the triggering event in the coagulation to explain a daily rhythm of plasma T3 in hypothyroidism cascade. Tfpi2 inhibition of TF-VIIa activity prevents initi- patients receiving exogenous T4 (Burr et al., 1975). Cy- ation of the coagulation cascade if the triggering stimu- cling hepatic transcript levels of Dio1 in our data set lus is too weak (Michal, 1999). Heparin cofactor II is one may better explain the above clinical observation. Syn- of the plasma cofactors required for the anticoagulant thesis of the nuclear receptor ligand retinoic acid and property of heparin. ␣-2 antiplasmin and ␣-2 macroglob- of the visual photopigment retinol from all-trans-retinal ulin are plasmin inhibitors and are thought to be impor- may also be under circadian control, as transcript levels tant in the regulation of fibrinolysis in vivo. Alpha-2 mac- of two enzymes, retinol dehydrogenase 7 (Rdh7) and roglobulin also has an anticoagulation effect by binding retinal short-chain dehydrogenase/reductase-1 (Rsdr1- and sequestering the free protein C available for coagu- pending), cycle. These two enzymes act upon all-trans- lation (Michal, 1999). Transcript levels of these four key retinal produced in a one-step reaction from dietary  inhibitors of coagulation and fibrinolysis cycle with a carotene (that comes from plants). peak phase of expression during the (behaviorally inac- Immune Mechanisms. The liver is also a major site of tive) day. synthesis of many immunologically important plasma The circadian oscillator in nocturnal rodents consoli-
Cell
316
dates feeding and phases it to the night. This raises a Therefore, tight circadian regulation of energy sources
possibility that circadian transcriptional regulation in the (Hk1) and their use at the terminal oxidative phosphory-
liver may be a result of both cell-autonomous circadian lation step (several components of mitochondrial oxida-
clock and feeding-associated gene expression. Recent tive phosphorylation) is an effective mechanism. Sugar
evidence has shown that circadianly regulated genes metabolism in the liver is more variable as intermediate
exhibit differences in their expression under restricted products are themselves used to produce bioactive mol-
and ad libitum feeding regimens, suggesting that feed- ecules. Therefore, the circadian control of sugar metab-
ing is a component of rhythmicity in normal (driven) olism in the liver is more elaborate, including the initial
conditions (Kita et al., 2002). steps of glucose utilization (G6pt1) as well as several
intermediate steps that may serve as starting points for
Circadian Control of Rate-Limiting Steps the generation of intermediate metabolites (for example,
Examination of the function of circadianly regulated pyruvate kinase and fumarate hydratase).
genes in the SCN and liver revealed that major functions Furthermore, as key pathways are conserved across
of both structures are under circadian control. In the species, the circadian regulation of the rate-limiting
regulation of physiology, an efficient mechanism for reg- steps in these pathways is likewise conserved. Circa-
ulation of a pathway is to exert control at biochemically dian regulation of some of these rate-limiting steps in
rate-limiting steps. Circadian control of many pathways more divergent species such as plants indicates that
and processes in these two tissues occurs at key rate- nature may have devised circadian regulation of key
limiting steps, some of which are discussed here. biochemical steps as an effective mechanism for tempo-
The first and rate-limiting step in ribosome biogenesis ral regulation of physiology and behavior. For example,
in nucleoli is the synthesis of ribosomal RNAs mediated fidelity in translational initiation is largely dependent on
by the multisubunit RNA polymerase-I and its accessory proper initiation complex formation. One key regulator
factors (Larson et al., 1991). While none of the core RNA of this process is Sui-1 (Cui et al., 1998), first identified
PolI subunits exhibited any significant transcriptional in yeast. Sui-1 transcript levels cycle in the SCN, the
rhythm in the SCN, a component shared by all three RNA liver, as well as in Arabidopsis and Drosophila (Ceriani
polymerases—metallothionein 1 activator—did exhibit a et al., submitted; Harmer et al., 2000). A second example
rhythm in peak phase with the ribosomal protein tran- is HMGCoA metabolism, where the rate-limiting enzyme
scripts. Transcriptional control of a common subunit of in plants, HMGCoA lyase, is under circadian control in
all three polymerases may ensure coordinated regula- plants, while in flies, rats, and mice, HMGCoA reductase
tion of both rRNA and r-protein transcription. Addition- is rate limiting and circadianly regulated (Ceriani et al.,
ally, transcript levels of TAFIb, a part of the SL1 complex submitted; Harmer et al., 2000; Kita et al., 2002). Addi-
that recruits RNA PolI to the rRNA promoters, and of tional examples are found in the heme biosynthetic path-
topoisomerase I, essential for RNA PolI-mediated tran- way and in the metabolism of  carotene. The first com-
scription (Larson et al., 1991), cycle in similar phases. mitted and physiologically irreversible step in heme
In the SCN, circadian control of genes mediating key biosynthesis is the condensation of glycine and succinyl
steps in processing of neuropeptides (Sgne1) and syn- coenzyme A to yield aminolevulinic acid (ALA). Circadian
thesis of neurotransmitters (Gad1 and Hdc-c) may ulti- control of ALA-synthase1 (Alas1) transcription in flies
mately generate a circadian variation in their neurotrans- and mammals and of many additional enzymes in the
mission. Finally, cycling transcript levels for several subsequent reactions in plants (Ceriani et al., submitted;
channel proteins and receptors (Clcn4-2, Cacna2d3, Harmer et al., 2001; Zheng et al., 2001) is a demonstra-
Clcn3, Slc8a1, Kcnma1, Avpr1a, Calcr, Crcp, Chrnb2, tion of circadianly regulated production of a cellular re-
and Cckar) may be an effective mechanism in generating dox sensor across species. Finally, while in mice metab-
circadian variation in neuronal signaling. olism of  carotene to produce retinoic acid and the
The rate-limiting nature of many cycling genes in the visual photopigment retinal is clock regulated, in plants,
liver is even more apparent. The liver, as the major site a putative  carotene hydroxylase that converts  caro-
of metabolism, also handles a significant flux of metabo- tene to zeaxanthine and related photo-protective pig-
lites across membranes. Circadian regulation of several ments xanthophylls is also under circadian control
membrane channels and transporters (Slc10a1, Slc22a1, (Harmer et al., 2000; Michal, 1999). The circadian metab-
Slc27a2, Slc2a2, Slc7a2, Abcc2, and Aqp9), allowing olism of  carotene is therefore conserved across spe-
substrate and product movement across membranes, cies, demonstrating evolutionary pressure in regulated
may be an effective mechanism for temporal sequestra- synthesis of major light-sensing pigments in both plants
tion of metabolites. Cycling transcript levels of several and animals.
key components in nutrient and intermediate metabo-
lism, discussed in the previous sections, may offer addi- Summary
tional levels of control. We present a global analysis of circadian patterns of
Within a species, important physiological processes transcription from the core pacemaker in the SCN and
may be regulated across tissues, but the mechanisms from an important physiological mediator and peripheral
may reflect their distinct physiologies. For example, oscillator, the liver. Importantly, we find that circadian
while we observed the circadian regulation of genes regulation of a majority of genes is tissue specific, and
regulating sugar metabolism in both the SCN and liver, only a small subset of these genes are direct targets
the points of regulation are different. SCN neurons pri- of the transcription factors driving the core oscillator.
marily utilize hexose sugars as energy sources to main- Because the vast majority of cycling genes in both SCN
tain the electrochemical gradient and to generate ATP. and liver are specific to those tissues, we suggest thatCircadian Transcriptional Outputs in Mammals
317
the profiling of additional tissues and organs may even- Data Analysis for Identification of Cycling Genes
tually reveal that up to 10% of the mammalian tran- To define circadianly expressed transcripts, we used a statistical
program COSOPT based on an algorithm we previously described
scriptome may be under circadian control.
(Harmer et al., 2000). COSOPT imports data and calculates the mean
In each tissue type examined, the major clusters of expression intensity and its corresponding standard deviation (SD).
circadianly regulated genes participate in the principal It then performs an arithmetic linear regression detrend of the origi-
functions of the organ, and many are the rate-limiting nal time series. The mean and SD of the detrended time series are
steps in their respective pathways. The peak phases of then calculated. COSOPT does not standardize the linear-regression
expression of these key transcripts are also appropri- detrended time series to standard normal deviates, as did CORCOS,
thus allowing COSOPT to quantitatively assess oscillatory amplitude
ately timed. A comparison of circadian transcription in
more directly. Variable weighting of individual time points (as in
mammals and flies (Claridge-Chang et al., 2001; McDon- SEMs from replicate measurements) can be accommodated during
ald and Rosbash, 2001; Ceriani et al., submitted) sug- analysis for the presence of rhythms in terms of a user-specified
gests that circadian control of several key processes number and range of periods (test periods spaced uniformly in pe-
and pathways including heme biosynthesis (Alas1), cho- riod space). Specifically, for each test period, 101 test cosine basis
lesterol metabolism (HMGCoA lyase), neuropeptide sig- functions (of unit amplitude) are considered varying over a range of
phase values from plus one-half the period to minus one-half the
naling (Dbi), neuronal excitability (Kcnma1/slo), energy
period (i.e., such that phase is considered in increments of 1% of
metabolism (hexokinase), and xenobiotic metabolism each test period). For each test cosine basis function, COSOPT
(glutathione-s-transferase and cytochrome p450s) have calculates the least-squares optimized linear correspondence be-
been conserved over more than 600 million years of tween the linear regression-detrended data, ylr(x), and the test co-
evolution. The circadian control of transcription in higher sine basis function, yb(x), as a function of x [i.e., such that the
organisms is integrated with the spatial control of gene approximation of ylr(x) by the test cosine basis function, yb(x), is
optimized across all values, x, in terms of two parameters, ALPHA
expression to target rate-limiting steps in major path-
and BETA, whereby ylr(x)ⵑALPHA⫹BETA*yb(x)]. The quality of opti-
ways in their relevant organs, resulting in a systems- mization possible by the test cosine basis function is quantitatively
level temporal orchestration of behavior and physiology characterized by the sum of squared residuals between ylr(x) and
for optimal adaptation of the organism to its envi- the approximation given by [ALPHA⫹BETA*yb(x)] (referred to as
ronment. CHI2, for chi-squared). The values of CHI2 are used to identify the
phase at which the optimal correspondence between ylr(x) and yb(x)
is obtained for each test period (i.e., the phase giving the smallest
Experimental Procedures CHI2 value corresponds to the optimal phase). Thus, for each test
period, ALPHA, BETA, and CHI2 are assessed at the optimal phase.
Animals Note that, interpretively, BETA now represents an optimized, param-
One hundred twenty male C57BL/6J mice of 7–8 weeks of age were etrized measure of the magnitude of the oscillatory amplitude ex-
purchased from the Jackson Laboratory and maintained for two pressed by ylr(x) (in relation to, or as modeled by, a cosine wave of
weeks on a LD12:12 cycle in the Northwestern University Center for the corresponding period and optimal phase). One thousand Monte
Comparative Medicine. All animal care and use procedures followed Carlo cycles are carried out in which surrogate realizations of ylr(x)
approved institutional guidelines. After placing in constant darkness are generated by both (1) randomly shuffling temporal sequence
(DD), ten animals were sacrificed every four hours, beginning at and (2) adding pseudo-Gaussian-distributed noise to each surrogate
hour 30 of DD for two complete 24 hr cycles (second and third cycle point in proportion to the corresponding value of point uncertainty
in DD). Mice were sacrificed by cervical dislocation, and the optic (i.e., replicate SEM). In this way, specifically accounted for in the
nerves were cut in complete darkness using an infrared viewer (FJW surrogate realizations are both (1) the influence of temporal pat-
Industries, Palatine, IL). Brain dissections were performed under terning and (2) the magnitude of point-wise experimental uncer-
dim red illumination (15W Kodak safe lamp filter 1A). The SCN was tainty. Then, as with the original ylr(x) sequence, optimal values of
ALPHA and BETA are determined, along with a corresponding CHI2,
quickly dissected under bright-light illumination using a dissecting
and retained in memory for each surrogate at each test period/
microscope, placed in a 5 l drop of TRIZOL reagent (Invitrogen,
optimal phase. For each test period/optimal phase, the mean and
Carlsbad, CA) sitting on aluminum foil, and rapidly frozen on dry
standard deviation of the surrogate BETA values are then calculated.
ice. Ten individual SCNs frozen in TRIZOL were pooled and stored
These values, in relation to the BETA value obtained for the original
at ⫺80⬚C until RNA extraction. Livers were rapidly frozen on dry ice
ylr(x) series, are then used to calculate a one-sided significance
and stored at ⫺80⬚C. Total liver RNA for real-time PCR was extracted
probability based on a normality assumption (which is in fact satis-
using TRIZOL reagent according to manufacturer’s protocol. Three
fied by the distribution of BETA values obtained from the 1000
samples were used for each time point. Total RNA used for real-
randomized surrogates). A summary of the analytical session is then
time PCR and Affymetrix probe preparation was extracted from
produced for each time series, composed of entries for only those
livers of the same animals. To study the effects of the Clock mutation
test periods that correspond to CHI2 minima, the best phase and
on gene expression profiles in liver, three wild-type and three Clock
the MMC- value describing the goodness of fit.
mutant C57BL/6J male mice were entrained to LD12:12 as above
and their livers were collected at ZT8.
Data Analysis for Clock Mutant Mice
Replicate chip hybridization data from wild-type and Clock mutant
Probe Hybridization mice liver were analyzed by ANOVA. Probe sets showing at least a
Total RNA was prepared, and samples were labeled and hybridized 2-fold difference in expression levels and a p-ANOVA score of 0.05
in duplicate (or more) to mouse (U74A) high-density oligonucleotide or less were considered significant.
arrays as previously described (Lockhart et al., 1996; Sandberg et
al., 2000; Wodicka et al., 1997). For each time point, either 10 g Search for E Box Elements
(liver) or 30 ng (SCN) of total RNA were used as starting material. Probe sets for all cycling genes were mapped to Unigene using
For the SCN samples, cRNA obtained in the first round of synthesis BLAST (Altschul et al., 1990) as previously described (Hogenesch
(without biotin label) was used in a second round of cRNA synthesis et al., 2001). The first 300 coding nucleotides of each complete
(with biotin label) to produce enough probe for hybridization. Primary Unigene cluster harboring a translational methionine was used as
image analysis of the arrays was performed using the Genechip 3.2 bait sequences to search the Celera Mouse and Human Assemblies
software package (Affymetrix, Santa Clara, CA), and images were (R12 masked and R26b, respectively) using BLAST as above. Hits
scaled to an average hybridization intensity (average difference were indexed up to 10 kb upstream of the translational methionine
value) of 200. (when available) and used to find the consensus CLOCK/MOP3You can also read