Molecular investigation of Tuscan sweet cherries sampled over three years: gene expression analysis coupled to metabolomics and proteomics - Nature

Page created by Patrick Frazier
 
CONTINUE READING
Molecular investigation of Tuscan sweet cherries sampled over three years: gene expression analysis coupled to metabolomics and proteomics - Nature
Berni et al. Horticulture Research (2021)8:12
                                    https://doi.org/10.1038/s41438-020-00445-3
                                                                                                                                                                                         Horticulture Research
                                                                                                                                                                                                     www.nature.com/hortres

                                     ARTICLE                                                                                                                                                    Open Access

                                    Molecular investigation of Tuscan sweet cherries
                                    sampled over three years: gene expression analysis
                                    coupled to metabolomics and proteomics
                                    Roberto Berni1,2, Sophie Charton 3, Sébastien Planchon 3, Sylvain Legay4, Marco Romi1, Claudio Cantini5,
                                    Giampiero Cai1, Jean-Francois Hausman4, Jenny Renaut3 and Gea Guerriero 4

                                      Abstract
                                      Sweet cherry (Prunus avium L.) is a stone fruit widely consumed and appreciated for its organoleptic properties, as well as
                                      its nutraceutical potential. We here investigated the characteristics of six non-commercial Tuscan varieties of sweet cherry
                                      maintained at the Regional Germplasm Bank of the CNR-IBE in Follonica (Italy) and sampled ca. 60 days post-anthesis
                                      over three consecutive years (2016-2017-2018). We adopted an approach merging genotyping and targeted gene
                                      expression profiling with metabolomics. To complement the data, a study of the soluble proteomes was also performed
                                      on two varieties showing the highest content of flavonoids. Metabolomics identified the presence of flavanols and
                                      proanthocyanidins in highest abundance in the varieties Morellona and Crognola, while gene expression revealed that
                                      some differences were present in genes involved in the phenylpropanoid pathway during the 3 years and among the
                                      varieties. Finally, proteomics on Morellona and Crognola showed variations in proteins involved in stress response,
                                      primary metabolism and cell wall expansion. To the best of our knowledge, this is the first multi-pronged study focused
                  1234567890():,;
1234567890():,;
                  1234567890():,;
1234567890():,;

                                      on Tuscan sweet cherry varieties providing insights into the differential abundance of genes, proteins and metabolites.

                                    Introduction                                                                                        as organic acids. They are cholesterol-free, low in calories
                                       Prunus avium L. is a fruit-tree belonging to the genus                                           with a high content of water. These drupes are also
                                    Prunus within the Rosaceae family that produces stone                                               rich sources of vitamins (notably vitamin C) and minerals
                                    fruits with a characteristic aroma and taste. This fruit-tree                                       (K, P, Ca, Mg).
                                    is native to many regions worldwide, with a preference for                                            Polyphenols and triterpenes are among the beneficial
                                    temperate climates like the Mediterranean area in Europe.                                           phytochemicals composing the rich palette of bioactives
                                    It has a diploid genome of 16 chromosomes (2n = 16)                                                 in sweet cherry fruits3,5. Triterpenes are present in the
                                    and, like other members of the Rosaceae family, sweet                                               cuticle of the fruits and, more specifically, they are found
                                    cherry contains toxic cyanogenic glycosides1,2, which are                                           almost exclusively associated with the intracuticular
                                    present in low concentrations in the stone (0.8%)2.                                                 waxes6,7.
                                       The fruits of P. avium are rich sources of health-                                                 Italy is an important producer of sweet cherries which
                                    promoting compounds3,4 and have a moderate content of                                               account for an important portion of the agricultural
                                    simple sugars (and therefore a low glycemic index), as well                                         production8–10; therefore, this fruit-tree plays a promi-
                                                                                                                                        nent role in the agricultural and economic landscape
                                                                                                                                        of Italy.
                                    Correspondence: Jenny Renaut (jenny.renaut@list.lu) or
                                    Gea Guerriero (gea.guerriero@list.lu)                                                                 Among the different Italian regions, Tuscany is known
                                    1
                                      Department of Life Sciences, University of Siena, via P.A. Mattioli 4,                            for the high quality of its food products exported world-
                                    I-53100 Siena, Italy
                                    2                                                                                                   wide (wine, oil, cheese, meat) and for specific geographic
                                      TERRA Teaching and Research Center, Gembloux Agro-Bio Tech,
                                    University of Liège, 5030 Gembloux, Belgium                                                         areas within its territory that have obtained the Protected
                                    Full list of author information is available at the end of the article

                                    © The Author(s) 2020
                                                        Open Access This article is licensed under a Creative Commons Attribution 4.0 International License, which permits use, sharing, adaptation, distribution and reproduction
                                                        in any medium or format, as long as you give appropriate credit to the original author(s) and the source, provide a link to the Creative Commons license, and indicate if
                                    changes were made. The images or other third party material in this article are included in the article’s Creative Commons license, unless indicated otherwise in a credit line to the material. If
                                    material is not included in the article’s Creative Commons license and your intended use is not permitted by statutory regulation or exceeds the permitted use, you will need to obtain
                                    permission directly from the copyright holder. To view a copy of this license, visit http://creativecommons.org/licenses/by/4.0/.
Molecular investigation of Tuscan sweet cherries sampled over three years: gene expression analysis coupled to metabolomics and proteomics - Nature
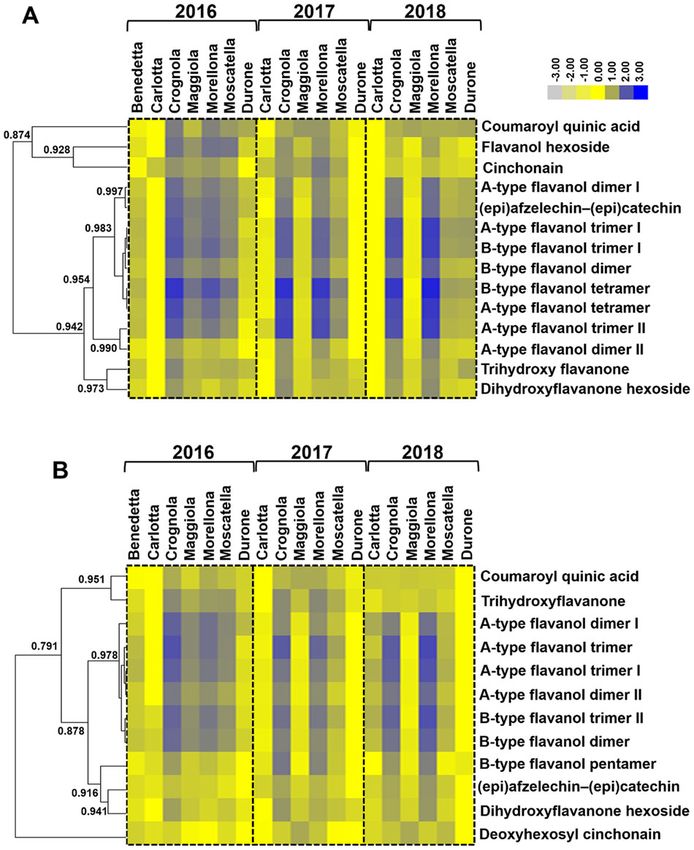
Berni et al. Horticulture Research (2021)8:12                                                                               Page 2 of 24

                                                                           variety allow us to have a comparison with fruits found on
                                                                           the market. The goal of the study is to provide molecular
                                                                           information on the synthesis and content of phenolic
                                                                           compounds in the Tuscan sweet cherries and to compare
                                                                           the data with those obtained for a commercial
                                                                           counterpart.
                                                                             The data pave the way to follow-up studies focused, for
                                                                           example, on earlier developmental stages, or on the post-
                                                                           harvest stability of the Tuscan fruits, which will provide
                                                                           an accurate evaluation of their further economic
                                                                           valorization.

                                                                           Results and discussion
                                                                           Genotyping of six non-commercial Tuscan sweet cherries
 Fig. 1 Dendrogram derived from the genotyping assay (UPGMA                  As a first step towards the molecular characterization of
 method) using SSR markers specific for genomic regions with a              the Tuscan sweet cherries, a similarity tree was generated
 high coefficient of polymorphism. The relationships between the            (Fig. 1). Commercial varieties originating from France,
 Tuscan cherries and the commercial ones from Luxembourg (Busch),
 Turkey, France (Napoleon and Dauphinois) and Italy (Durone) are
                                                                           Turkey and Luxembourg were included to enrich the
 shown. Nei & Li’s similarity coefficients are displayed in the black bar   dataset and to better discriminate the phylogenetic
 below the tree. Bootstrap values are indicated above the branches         relatedness of the Tuscan fruits. However, these com-
 (1000 replicates).                                                        mercial varieties were not included in the other analyses
                                                                           performed.
                                                                             In a previous study, genotyping of Tuscan sweet cher-
Geographical Indication (IGP) label. Such an example is                    ries was used to investigate the self-incompatibility alleles
Lari, where a specific variety of sweet cherry is culti-                    (S-alleles) which are necessary to determine incompat-
vated11, or the reference areas of Capalbio, Batignano,                    ibility relationships between cultivars and establish
Campagnatico, Castiglione delle Pescaie, where the olive                   appropriate breeding programs14. The authors focused
varieties Frantoio, Leccino, Moraiolo and Pendolino are                    their attention on the tree breeding incompatibility by
grown12.                                                                   designing SSR markers specific for the S locus.
  Understanding more about the physiology and bioactive                      Different SSR markers were here used and the results
contents of non-commercial sweet cherry varieties of                       showed three main genetic clusters belonging to three
Italian collections can inspire exploitation programs                      different branches of the tree. The biggest cluster included
valorizing these local fruits at the regional level. Such                  three ancient varieties (Benedetta, Carlotta, Moscatella)
ancient local varieties have either disappeared or have                    and four commercial ones (Durone from Italy, Dauphi-
been marginalized and reduced in number to a few trees,                    nois from France, commercial from Turkey and com-
because of the introduction of new cherry varieties in crop                mercial from Luxembourg, referred to as Busch). The
systems11. Nevertheless, they constitute an important                      second branch comprised the ancient variety Maggiola
reservoir of interesting characters (e.g. morphological,                   and the French one Bigarreau Napoléon (referred to as
organoleptic and genetic) which can contribute to the                      Napoleon in Fig. 1). The last cluster included the varieties
selection of new varieties through breeding programs13.                    Crognola and Morellona, which grouped separately from
  We previously showed that six non-commercial vari-                       all the other Tuscan sweet cherries studied.
eties of Tuscan sweet cherries maintained at the Germ-                       Despite the small number of samples here studied,
plasm Bank of the CNR-IBE in Follonica (Grosseto, Italy)                   genotyping was in agreement with the distribution of the
are high producers of pentacyclic triterpenes5, as well as                 varieties across the Tuscan territory: Benedetta and Car-
phenolics3. We here enrich these data by using genotyp-                    lotta share a wide distribution across the whole region,
ing and gene expression profiling of phenylpropanoid                        Crognola and Morellona are both from the province of
(hereafter abbreviated PPP) biosynthetic genes, as well as                 Pisa, while Moscatella is the only representative of the
untargeted metabolomics on fruits sampled at maturity                      geographical area around Siena and Maggiola of Roccal-
during 3 years (2016–2017–2018). We additionally                           begna (province of Grosseto).
investigate the soluble proteomes of two varieties, Crog-
nola and Morellona, ranking as the highest producers of                    Untargeted metabolomics
phenolic compounds. A commercial variety, Durone,                            Untargeted metabolomics identified 15 differentially
commonly found in Italian fruit markets, was included in                   abundant metabolites in positive and 14 in negative mode
the study. The molecular data obtained by including this                   (Table 1 and Table 2). This approach was adopted to
Molecular investigation of Tuscan sweet cherries sampled over three years: gene expression analysis coupled to metabolomics and proteomics - Nature
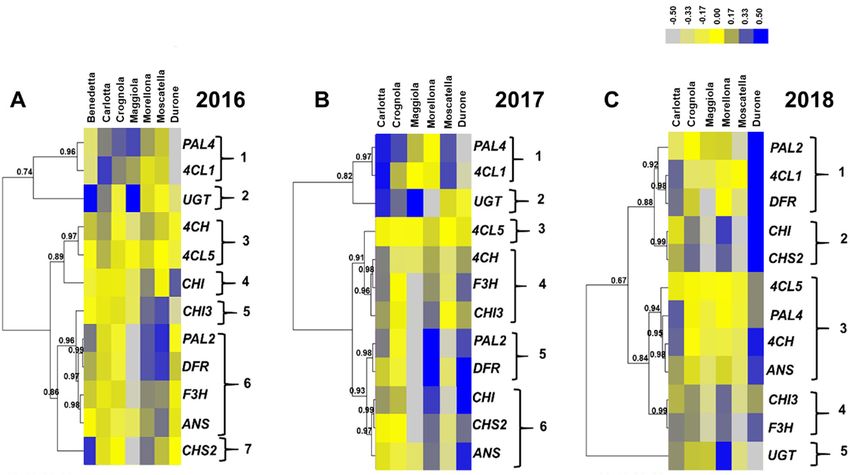
Berni et al. Horticulture Research (2021)8:12                                                                                          Page 3 of 24

Table 1 List of differentially abundant compounds in sweet cherries obtained by UHPLC-DAD-HR-MS/MS in positive ESI
mode. The details of the compounds are given, together with the specification of the reliability class and references used
for the detection
Putative identification          Rt   (min)   Formula   Theoretical   Observed         Mass error   Main MS2 fragments           MSI reliability class
                                                       m/z           m/z              (ppm)                                     with references
                                                                                                                                used for the
                                                                                                                                annotation

Flavanol hexoside                8.79        C21H24O11 453.1391       453.1379        −2.78        139.0381                     2106
A-type flavanol dimer I          13.87        C30H24O12 577.1341       577.1318        −3.91        245.0434                     3106
Coumaroyl quinic acid           16.00        C16H18O8   339.1074      339.1065        −2.91        147.0433–119.0481–91.0534    3107–109
(epi)afzelechin–(epi)catechin   17.65        C30H26O11 563.1548       563.1534        −2.50        107.0480–147.0431–287.0544   2110,111
A-type flavanol trimer I         19.02        C45H36O18 865.1974       865.1968        −0.73        245.0441–287.0544–163.0375   3112
B-type flavanol trimer I         19.02        C45H38O18 867.2131       867.2131         0.00        245.0422–127.0379–163.0382   3106
B-type flavanol tetramer         19.64        C60H50O24 1155.2765     1155.2770         0.45        245.0440–247.0593–163.0375   3112
A-type flavanol trimer II        19.64        C45H36O18 865.1974       865.1962        −1.41        287.0539–247.0587–135.0428   3112
A-type flavanol tetramer         19.95        C60H48O24 1153.2608     1153.2609         0.06        135.0441–123.0416–163.0376   3112
B-type flavanol trimer IIa       19.98        C45H38O18 867.2131       867.2117        −1.59        127.0374–163.0394–135.0409   3112
Trihydroxyflavanone              20.79        C15H12O5   273.0758      273.0751        −2.31        153.0167                     2
B-type flavanol dimer            21.52        C30H26O12 579.1497       579.1492        −0.90        123.0429–127.0378–163.0331   3112
A-type flavanol dimer II         21.52        C30H24O12 577.1341       577.1320        −3.56        123.0431–245.0442–135.0430   3108
Cinchonain                      24.52        C24H20O9   453.1180      453.1168        −2.67        191.0333–163.0362            3110
Dihydroxyflavanone hexoside      25.74        C21H22O10 435.1286       435.1273        −2.85        169.0122–273.0757            2107

All observed ions are [M+H]+
Rt retention time, MSI Metabolomics Standards Initiative
a
 Only in harvests 2016 and 2017

confirm and enrich the data already present in the lit-                           could be fragments of bigger polymers, such as proan-
erature on Tuscan sweet cherries3, by providing infor-                           thocyanidins; however, the exact number of monomers is
mation on other families of molecules, namely flavanols,                          difficult to determine due to the limit of 2000 m/z of the
proanthocyanins and flavonolignans (cinchonain and                                MS1 scan. For these molecules, the most striking differ-
deoxyhexosyl cinchonain; Tables 1, 2).                                           ences were observed in two varieties, i.e. Crognola and
  A hierarchical clustering of the heatmap was per-                              Morellona, which ranked as the highest in abundance in
formed to identify similar patterns of abundance shared                          all the years studied (Fig. 2). This result is in agreement
by the classes of molecules detected (Fig. 2). It should                         with the previously published data obtained using spec-
be noted that the variety Benedetta only appears in                              trophotometric assays and targeted metabolite quantifi-
2016, as the trees did not give any fruits in the other                          cation using HPLC-DAD3,5,21: Crognola and Morellona
years studied.                                                                   produced high amounts of pentacyclic triterpenes, as well
  As previously reported in other studies focused on                             as anthocyanins and flavonoids.
sweet cherries15, the majority of the molecules detected in                        In contrast, the commercial cherries were among the
the Tuscan fruits belonged to the flavonoid class.                                fruits producing the lowest amounts of flavanols.
  Flavonoids play different roles in plants, e.g. interaction                    Although the post-harvest storage conditions of the
with pollinators16, photoprotection, reactive oxygen spe-                        commercial cherries are not known and were supposedly
cies (ROS) scavenging17, response to abiotic stresses18, as                      different from those of the Tuscan fruits, they were
well as auxin transport19. Their biosynthesis is known to                        included for comparative purposes and as representatives
be affected by the genotype and the environment. A study                         of the most common cherries on the Italian market.
on 27 strawberry genotypes grown in the North and                                  Fewer differences among the varieties were found for
South of Italy revealed a higher content of flavonols in the                      the hydroxycinnamic acid coumaroyl quinic acid (that
fruits from the northern location20. Additionally, auto-                         could, however, also represent a fragment of bigger
chthonous cultivars of sweet cherry from South Italy                             molecules, such as quinic acid esters of hydroxycinnamic
showed differences in flavonoids, thereby revealing that                          acids previously detected in depitted sweet cherries22)
the genotype is responsible for statistically significant                         and for flavanones (di- and trihydroxyflavanones). These
differences in the content of bioactive molecules13.                             compounds were also less abundant as compared to A/
  In the Tuscan fruits examined, flavonoids varied in                             B-type flavanols (Fig. 2). It is worthy to note that
abundance, notably (epi)afzelechin-(epi)catechin and                             untargeted metabolomics detected the presence of
A/B-type flavanols. The A- and B-type flavanols observed                           cinchonain and deoxyhexosyl cinchonain in the fruits of
Molecular investigation of Tuscan sweet cherries sampled over three years: gene expression analysis coupled to metabolomics and proteomics - Nature
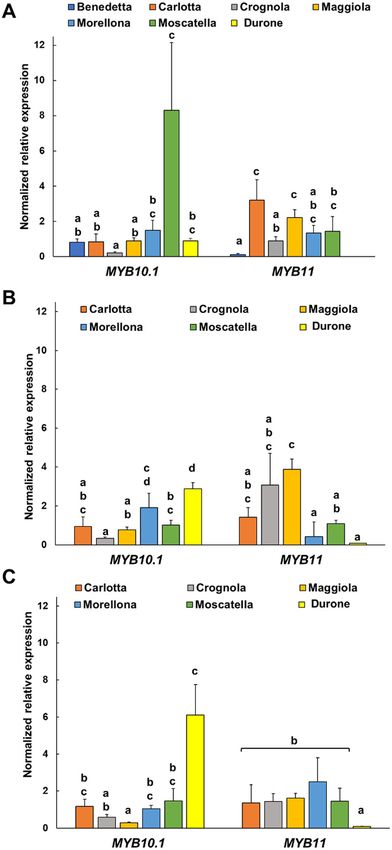
Berni et al. Horticulture Research (2021)8:12                                                                                      Page 4 of 24

Table 2 List of differentially abundant compounds in sweet cherries obtained by UHPLC-DAD-HR-MS/MS in negative ESI
mode. The details of the compounds are given, together with the specification of the reliability class and references used
for the detection

Putative identification           Rt (min) Formula     Theoretical     Observed    Mass error   Main MS2 fragments           MSI reliability class
                                                      m/z             m/z         (ppm)                                     with references
                                                                                                                            used for the
                                                                                                                            annotation

A-type flavanol dimer I           13.85    C30H24O12        575.1195    575.1176   −3.28        125.0249–163.0017–255.0300 3111,112
B-type flavanol trimer Ia         13.93    C45H38O18        865.1985    865.1976   −1.07        125.0231–161.0243–407.0770 3107,112
Coumaroyl quinic acid            15.99    C16H18O8         337.0929    337.0928   −0.16        173.0462–93.0341–119.0494    3107–109
(epi)afzelechin–(epi)catechin    17.63    C30H26O11        561.1402    561.1381   −3.81        289.0733–245.0821–203.0747 2110,111
A-type flavanol trimer I          19.01    C45H36O18        863.1829    863.1813   −1.79        285.0370–125.0265–161.0259 3112
B-type flavanol trimer II         19.01    C45H38O18        865.1985    865.1988    0.35        125.0244–407.0797–161.0239 3112
B-type flavanol tetramer    a
                                 19.63    C60H50O24 1153.2619         1153.2570   −4.27        125.0279–243.0303–161.0254 3112
A-type flavanol trimer II         19.63    C45H36O18        863.1829    863.1810   −2.16        125.0230–161.0276–243.0317 3112
B-type flavanol pentamer          19.93    C75H62O30 1441.3253         1441.3218   −2.44        125.0219–243.0327–287.0709 3112
Trihydroxyflavanone               20.78    C15H12O5         271.0612    271.0605   −2.58        153.0167                     2
B-type flavanol dimer             21.50    C30H26O12        577.1352    577.1342   −1.61        125.0237–289.0737–161.0258 3107,108,112
A-type flavanol dimer II          21.50    C30H24O12        575.1195    575.1179   −2.79        125.0224–161.0292–177.0172 3108
Deoxyhexosyl cinchonain          24.53    C30H30O13        597.1614    597.1587   −4.43        341.0686–189.0171–217.0126 3110
Dihydroxyflavanone hexoside 25.72          C21H22O10        433.1140    433.1125   −3.40        271.0612–243.0652            2107

All observed ions are [M-H]
Rt retention time, MSI Metabolomics Standards Initiative
a
 Only in harvests 2016 and 2017

sweet cherries. These secondary metabolites are flavo-                        were identified using standards (Supplementary Tables 1,
nolignans and have high antioxidant, hepatoprotective                        2 and Supplementary Fig. 1) and hence classified as MSI
and antimicrobial activities23,24. Such molecules are rare                   reliability class 1 compounds. The data obtained for these
in nature and found in species such as Cinchona, Tri-                        compounds are in line with those obtained previously,
chilia, Acer, Sorbus25. However, a recent study detected                     especially for flavonoids and confirm Crognola and Mor-
cinchonain in Hungarian sour cherries26, thereby con-                        ellona as the best producers of secondary metabolites3.
firming that this flavonolignan occurs in the fruits of                          The results obtained with metabolomics showed an
members within the genus Prunus. From a nutraceutical                        impact of the genotype on the biosynthesis of flavonoids:
point of view, Olszewska and colleagues showed an                            this is well known and supported by a strong body of
antiradical capacity of cinchonain (measured with the                        evidence in the literature20,29–32. Based on these results
DPPH assay) up to four times higher than (+)-cate-                           and those previously published3,5,21, Crognola and Mor-
chin25, which is known as one of the most effective                          ellona appear to be genetically predisposed to produce
antioxidants both in vitro and in vivo27. Moreover,                          high amounts of secondary metabolites. Interestingly,
in vitro experiments showed an insulinotropic effect of                      these two varieties clustered together in a separate branch
cinchonain and it was thus proposed that the con-                            of the dendrogram (Fig. 1), a finding indicating differences
sumption of this molecule through the diet may be                            at the genome-level with respect to all the others.
helpful for managing type 2 diabetes28.
  Crognola and Morellona produced cinchonain at higher                       Targeted gene expression analysis
levels (Fig. 2), a finding confirming the high nutraceutical                     Since the biosynthesis of secondary metabolites is
potential of these two Tuscan varieties. The commercial                      regulated at the gene level33, RT-qPCR was performed to
variety Durone showed among the lowest amounts of the                        quantify the relative gene expressions of the PPP-related
flavonolignan.                                                                genes. The gene expression analysis was carried out on the
  Other phenolic compounds, namely neochlorogenic                            3 years of harvest 2016, 2017 and 2018 and on genes
acid, catechin, chlorogenic acid, epicatechin and quercetin,                 intervening in the PPP. The genes investigated were
Molecular investigation of Tuscan sweet cherries sampled over three years: gene expression analysis coupled to metabolomics and proteomics - Nature
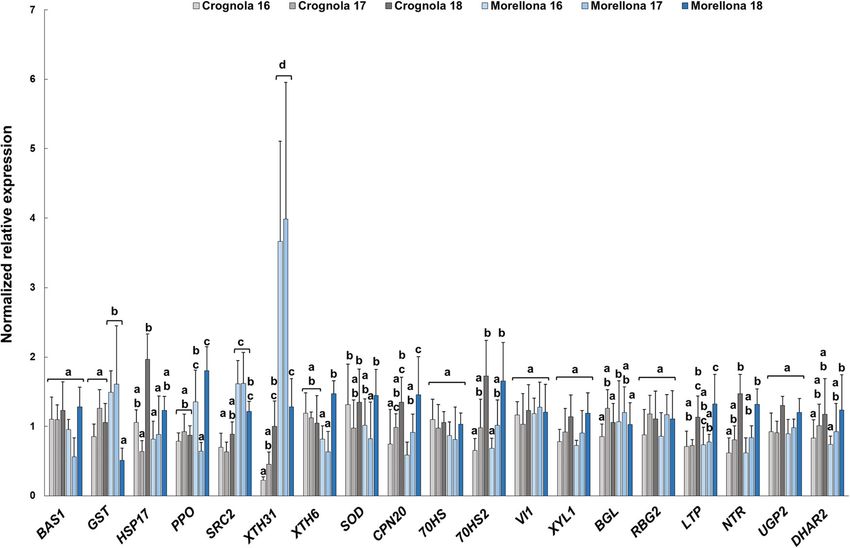
Berni et al. Horticulture Research (2021)8:12                                                                           Page 5 of 24

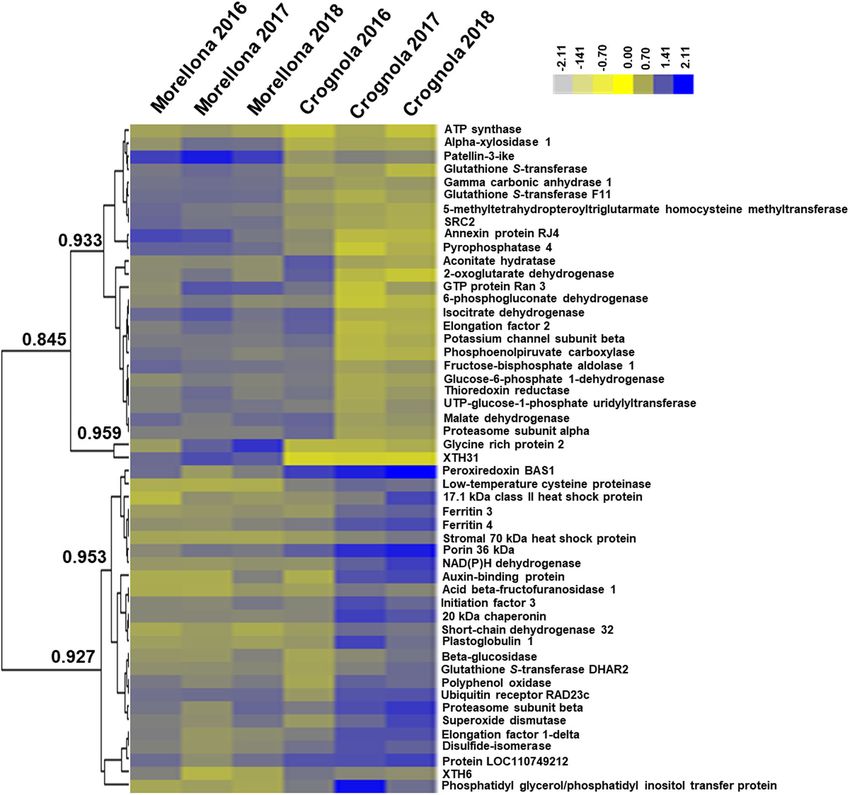
                                                                          In 2016, seven major patterns could be distinguished by
                                                                        setting 0.96 as threshold value for the Pearson correlation.
                                                                        The first one was composed by PAL4 and 4CL1, the
                                                                        second by UGT, the third by C4H and 4CL5, the fourth
                                                                        and fifth by CHI and CHI3, the sixth comprised PAL2,
                                                                        DFR, F3H and ANS and the last CHS2 (Fig. 3A). Besides
                                                                        CHI, the commercial fruits displayed lower expressions as
                                                                        compared to the ancient ones and this was particularly
                                                                        evident for the genes partaking in the general phase of
                                                                        the PPP, i.e. the isoforms of PAL, 4CL, as well as 4CH
                                                                        (Fig. 3A). A lower expression of these genes may indeed
                                                                        be directly responsible for a decreased synthesis of pro-
                                                                        ducts shunted to the specialized branch of the PPP leading
                                                                        to the biosynthesis of flavonoids.
                                                                          Carlotta, Crognola and Maggiola showed overall higher
                                                                        expression of PAL4, while CHI3, PAL2, DFR, F3H, ANS
                                                                        and CHS2 were highly expressed in the varieties Mor-
                                                                        ellona and Moscatella. The variety Benedetta showed high
                                                                        expression of UGT and CHS2.
                                                                          In 2017, six major clusters could be recognized by set-
                                                                        ting a threshold value of 0.93 for the Pearson correlation
                                                                        (Fig. 3B): the first two were the same as those of 2016, i.e.
                                                                        PAL4/4CL1 and UGT, the third comprised only 4CL5, the
                                                                        fourth C4H, F3H and CHI3, the fifth cluster included
 Fig. 2 Heatmap hierarchical clustering showing the fold change
                                                                        PAL2 and DFR, the last CHI, CHS2 and ANS. It was
 differences of the compounds identified. A Metabolites identified        possible to observe again the clustering of PAL4 with
 in positive and (B) in negative mode in the 3 years. A maximum fold    4CL1 and of PAL2 with DFR, as previously seen for the
 change >3 in absolute value was used, together with a p-value < 0.05   fruits sampled in 2016. The commercial variety showed
 at the one-way ANOVA. Fold-changes were calculated using the           instead differences, notably higher expression of the genes
 means of normalized abundances. To build the heatmap, the fold
 change values were rescaled based on the lowest value detected per
                                                                        involved in the central and late stages of the PPP. Mor-
 single metabolite and then log10-transformed. Numbers indicate the     ellona confirmed the high expression of genes involved in
 Pearson correlation coefficients. The color bar indicates the log10-    flavonoids/anthocyanin biosynthesis. Maggiola displayed
 transformed fold change values.                                        a high expression of UGT, as previously observed in 2016
                                                                        (Fig. 3A).
                                                                          The year 2018 differed from the previous ones in terms
phenylalanine ammonia lyase-PAL, cinnamate-4-hydro-                     of gene expression (Fig. 3C). By setting a threshold value
xylase-C4H, 4-coumarate-coenzyme A ligase-4CL, chal-                    of 0.88 for the correlation coefficient, five major expres-
cone synthase-CHS, chalcone isomerase-CHI, flavanone 3-                  sion clusters were observed: the first grouped PAL2, 4CL1
hydroxylase-F3H,      dihydroflavonol      4-reductase-DFR,              and DFR, the second CHI and CHS2, the third comprised
anthocyanidin synthase-ANS and a UDP-glycosyltransfer-                  4CL5, PAL4, C4H and ANS, the fourth cluster grouped
ase-UGT (responsible for the glycosylation of anthocyanin               CHI3 and F3H and the last one was represented by UGT.
aglycones).                                                             PAL2 and DFR were in the same cluster; however, in 2018,
  The genes involved in the PPP are notoriously multi-                  4CL1 was also present, differently from the previous years,
genic34,35; for PAL, 4CL and CHI, two isoforms were                     where it grouped with PAL4.
analyzed because of the roles that these genes have as                    PAL2 showed lower expression in Morellona with
gatekeepers (PAL) and members of the general steps                      respect to 2016 and 2017, while the commercial fruits
(4CL), respectively, as well as their implication in branch             showed much higher expression of all the genes, with the
points (CHI). By studying the genes coding for isoforms, it             exception of UGT.
is possible to speculate about their potential role in the                It is interesting to note that the two PAL isoforms
provision of precursors needed for the synthesis of aro-                clustered with different genes in 2016 and 2017: PAL4
matic macromolecules. Subsequently, a hierarchical                      grouped with 4CL1, while PAL2 with DFR. In thale cress,
clustering of the heatmap was carried out to unveil                     four different PAL isoforms were described36 and a
potential correlations of expression patterns among the                 redundant role for PAL1 and PAL2 was demonstrated in
genes studied (Fig. 3).                                                 flavonoid biosynthesis37. The sweet cherry PAL2 may be
Molecular investigation of Tuscan sweet cherries sampled over three years: gene expression analysis coupled to metabolomics and proteomics - Nature
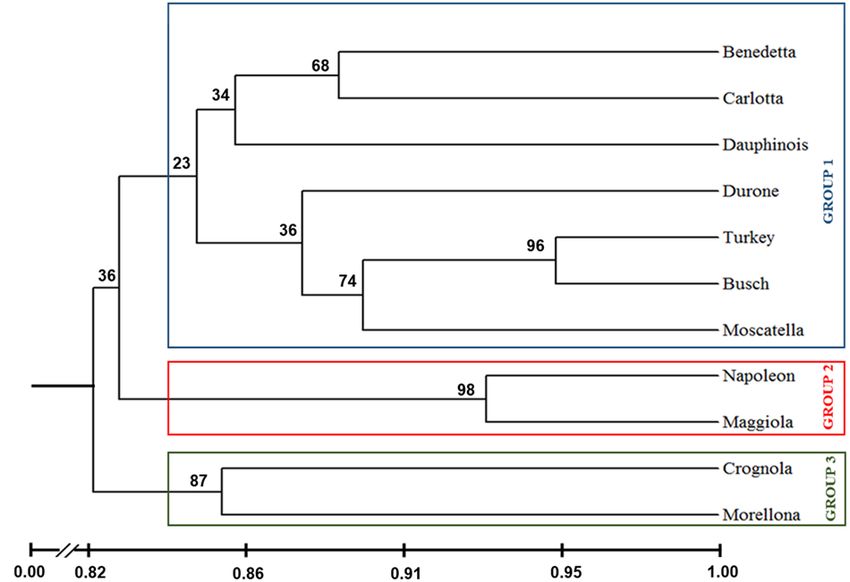
Berni et al. Horticulture Research (2021)8:12                                                                                      Page 6 of 24

 Fig. 3 Heatmap hierarchical clustering of the PPP-related gene expression data across the 3 years of study (A, 2016; B, 2017; C, 2018).
 Numbers indicate the Pearson correlation coefficients. Numbers indicate the Pearson correlation coefficients. The color bar indicates the log10-
 transformed normalized relative quantities. The bar graphs of the expression data are available in Supplementary Fig. 2

involved in the PPP branch shunting precursors towards                    expression. Durone showed also high expression of
the synthesis of flavonoids. This however awaits experi-                   MYB10.1, especially in 2017 and 2018: this can be
mental confirmation. RT-qPCR also revealed a higher                        explained by the intense red color of both the skin and the
expression of the genes involved in the central and late                  pulp, features that make these commercial fruits parti-
stages of the PPP in Morellona (Fig. 3).                                  cularly appealing to consumers. Although Moscatella
  The expression of PPP-related genes is subjected to                     does not display intense red pigmentation, our results
transcriptional regulation. V-MYB myeloblastosis viral                    show that this variety ranks among the highest producers
oncogene homolog (MYB) transcription factors (TFs) are                    of proanthocyanidins (Fig. 2): this result can be explained
master regulators of the PPP and activate the branches                    by a high expression of MYB10.1 in this variety.
leading to the biosynthesis of monolignols, flavonoids and                   The MYB10.1 gene was sequenced in the varieties
anthocyanins38. Two genes encoding MYB TFs were here                      Morellona (deposited in GenBank with the accession
investigated using RT-qPCR, i.e. MYB10.1 and MYB11.                       number MH545964) and Crognola (partial sequence in
The choice of these genes is motivated by their role in the               Supplementary Fig. 3) to check the occurrence of the
biosynthesis of anthocyanins39,40 and flavonols41,                         previously reported alleles MYB10.1a and b responsible
respectively.                                                             for the red and blush color of the skin39. The a allele was
  In 2016, MYB10.1 showed the highest expression in the                   cloned from Crognola and the b allele from Morellona; it
varieties Moscatella and the lowest in Crognola, while in                 remains to be verified whether the MYB10.1a allele occurs
2017 and 2018 the commercial fruits showed the highest                    together with MYB10.1b in Morellona, as is expected on
expression of the gene (Fig. 4). Despite the variations in                the basis of the strong red color observed in the fruits of
expression across the 3 years, Crognola was always among                  this variety.
the varieties expressing low levels of MYB10.1, while                       The gene expression patterns of MYB11 showed the
Morellona showed higher expression of the transcript.                     largest variations among the Tuscan cherries in 2017,
Both varieties are characterized by a red color of the                    where the varieties Crognola and Maggiola were the
skin42; however, Morellona is the only variety with a red                 highest and Durone the lowest. Interestingly, Durone
pulp. Therefore, the high content of anthocyanins                         always showed the lowest expression of the TF in all the
reported previously3,21 can be explained by a higher gene                 years studied.
Berni et al. Horticulture Research (2021)8:12                                                                               Page 7 of 24

                                                                               Overall, the RT-qPCR data showed that the PPP-related
                                                                            genes were differentially expressed in the Tuscan varieties.
                                                                            It was not possible to link the abundance of the phenolic
                                                                            compounds (Fig. 2, Tables 1, 2) with gene expression
                                                                            profiles (Fig. 3, Supplementary Fig. 2), since the highest
                                                                            producing varieties Crognola and Morellona did not
                                                                            always show high expression of PPP-biosynthetic genes.
                                                                            The reason for a lack of correlation may be linked to post-
                                                                            transcriptional and post-translational events: for example,
                                                                            it was reported that a Kelch repeat F-box protein, SAGL1,
                                                                            regulates the PPP in thale cress by interacting with PAL1
                                                                            and mediating its proteasome-dependent degradation43.
                                                                            The field conditions are also known to affect the gene
                                                                            expression pattern and this explains the variations
                                                                            observed in the Tuscan fruits.
                                                                               To understand the environmental causes that could be
                                                                            (at least in part) responsible for the differential gene
                                                                            expression in the Tuscan varieties, the daily temperatures
                                                                            from March (blooming period) to May (fruit sampling), as
                                                                            well as the precipitation and humidity maximum/mini-
                                                                            mum averages were retrieved from the LaMMA meteor-
                                                                            ological station in Grosseto (http://lamma.eu/en). As can
                                                                            be seen in Supplementary Fig. 4, the year 2018 had, in
                                                                            average, warmer minimum temperatures. Variations in
                                                                            the humidity averages were also recorded across the years,
                                                                            with 2016 recording lower average maximum humidity
                                                                            and 2018 higher average minimum humidity (Supple-
                                                                            mentary Fig. 4).
                                                                               As discussed in the previous section on metabolomics,
                                                                            an influence of the environment on the expression of
                                                                            PPP-related genes is known44. The functional quality of
                                                                            strawberries was enhanced under mild drought salinity
                                                                            stress, since the content of phenolics, anthocyanins and
                                                                            ascorbic acid increased45. Likewise, in grapevine, seaso-
                                                                            nal water deficit was shown to affect anthocyanin bio-
                                                                            synthesis during ripening by upregulating both genes
                                                                            and metabolites46.
                                                                               The Tuscan varieties here investigated thrive in wild
                                                                            conditions and in soils with minimal human intervention;
                                                                            given the non-controlled conditions of growth, it is not
                                                                            surprising that gene expression showed such a high
                                                                            variability across the years of study.
 Fig. 4 Gene expression analysis (indicated as normalized relative
 expression) of the MYB TF-encoding genes. A results relative to            Analysis of the soluble proteomes of two ancient varieties
 2016, (B) results obtained on the samples harvested in 2017, (C) results      An analysis of the proteome was carried out on the
 relative to the year 2018. Error bars correspond to the standard           varieties Morellona and Crognola. The goal was to high-
 deviation (n = 4). Different letters represent statistical significance     light differences in the abundance of soluble proteins that
 (p-value < 0.05) among the groups of data. If a letter is shared, the
 difference is not significant. A one-way ANOVA followed by Tukey’s
                                                                            could explain the metabolite and gene expression varia-
 post-hoc test was performed on genes showing homogeneity and               tions observed in the 3 years.
 normal distribution; for the others, a Kruskal-Wallis test followed by        The two-dimensional difference gel electrophoresis
 Dunn’s post-hoc test was used. The statistical parameters in (A) are       (2D-DIGE) experiments showed 166 differentially abun-
 MYB10.1 F(6,20) = 34.37, p-value = 0.000; MYB11 F(5,18) = 28.26,           dant protein spots. The spots were selected according
 p-value = 0.000, (B): MYB10.1 F(5,18) = 35.69, p-value = 0.000; MYB11
 X2(5) = 17.46, p-value=0.004 and in (C): MYB10.1 X2(5) = 18.44, p-value
                                                                            to the following parameters: max fold change >2 and
 = 0.002; MYB11 F(5,17) = 17.84, p-value = 0.000                            p-value < 0.01.
Table 3    Details of the spot numbers, accession numbers, annotations and p-values of the identified proteins

Spot No Accession No       Protein Name                                Function                                  Category    p-value (year) p-value
                                                                                                                                           (variety)

753       XP_021804554.1 Thioredoxin reductase NTRB                    Oxidoreductase activity                   STRESS      0.12515       0.00297
996       XP_021801592.1 Superoxide dismutase                          Oxidoreductase activity                   STRESS      0.00965       0.14682
1004      XP_021816866.1 2-Cys peroxiredoxin BAS1                      Cell redox homeostasis/Stress response    STRESS      0.7117        0.00026
988       XP_021823852.1 Glutathione S-tr ansferase F11                Response to oxidative stress              STRESS      0.66672       0.00001
976       XP_021813812.1 Glutathione S-transferase DHAR2               Oxidoreductase activity                   STRESS      0.00007       0.32618
1006      XP_021832122.1 Glutathione S-transferase                     Oxidoreductase activity                   STRESS      0.24001       0.00043
1023      XP_021808495.1 NAD(P)H dehydrogenase (quinone) FQR1          Response to auxin/Oxidoreductase          STRESS      0.00036       0
                                                                                                                                                       Berni et al. Horticulture Research (2021)8:12

                                                                       activity/Stress response
378       XP_021806563.1 Protein disulfide isomerase                    Cell redox homeostasis                    STRESS      0.84562       0
299       XP_021815855.1 Stromal 70 kDa heat shock-related             Stress response                           STRESS      0.17303       0.00017
948       XP_021820221.1 Low-temperature-induced cysteine proteinase   Stress response                           STRESS      0.81184       0.00003
632       XP_021832997.1 Protein SRC2                                  Stress response                           STRESS      0.27232       0.00004
845       XP_021820409.1 Glycine-rich protein 2                        Response to water deficit. ABA/Cell wall STRESS        0.0056        0
1163      XP_021824432.1 17.1 kDa class II heat shock protein          Stress response                           STRESS      0.00695       0.00163
985       XP_021805019.1 20 kDa chaperonin                             Stress response                           STRESS      0.0128        0.00019
674       XP_021804100.1 Plastoglobulin-1                              Lipid metabolism of chloroplasts/Stress   STRESS      0.05678       0.00082
                                                                       response
1238      XP_021831271.1 Phosphatidylglycerol/phosphatidyl inositol    Lipid binding (recognition of pathogen    STRESS      0.15061       0.00045
                           transfer protein                            related products)
792       XP_021812280.1 Xyloglucan endotransglucosylase 31            Cell wall metabolism                      CELL WALL   0.4535        0.00001
477       XP_021823827.1 UTP-glucose-1-phosphate uridylyltransferase   Cell wall metabolism                      CELL WALL   0.40482       0.00437
822       XP_021802094.1 Xyloglucan endotransglucosylase 6             Cell wall metabolism                      CELL WALL   0.01025       0.00207
347       AAA91166.1       Beta-glucosidase                            Carbohydrate metabolism/Cell wall         CELL WALL   0.00037       0.56739
                                                                       metabolism
221       XP_021814417.1 Alpha-xylosidase 1                            Cell wall metabolism                      CELL WALL   0.08851       0.00005
201       XP_021823469.1 Acid beta-fructofuranosidase 1                Carbohydrate metabolism/Cell wall         CELL WALL   0.08196       0.00561
                                                                       metabolism
                                                                                                                                                          Page 8 of 24
Table 3 continued

Spot No Accession No     Protein Name                                       Function                            Category                                      p-value (year) p-value
                                                                                                                                                                             (variety)

511     XP_021814422.1 Ubiquitin receptor RAD23c                            Protein catabolic process           PROTEASOME-RELATED PATHWAY                    0.00018        0.91013
1012    XP_021825182.1 Proteasome subunit beta type-6                       Protein catabolic process           PROTEASOME-RELATED PATHWAY                    0.0371         0.00475
936     XP_021828441.1 Proteasome subunit alpha type-6                      Protein catabolic process           PROTEASOME-RELATED PATHWAY                    0.00762        0.03074
258     XP_021832122.1 Phosphoenolpyruvate carboxykinase                    Decarboxylase activity              PRIMARY METAB. GLUCONEOG.                     0.00066        0.00002
161     XP_021822858.1 Aconitate hydratase                                  Lyase activity                      PRIMARY METAB, TCA CYCLE                      0.00664        0.41726
1453    XP_021823850.1 Isocitrate dehydrogenase                             Oxidoreductase activity             PRIMARY METAB, TCA CYCLE                      0.06206        0.00213
1293    XP_021813779.1 2-oxoglutarate dehydrogenase                         Oxidoreductase activity             PRIMARY METAB, TCA CYCLE                      0.00439        0.00327
                                                                                                                                                                                         Berni et al. Horticulture Research (2021)8:12

709     XP_021804616.1 Malate dehydrogenase                                 Oxidoreductase activity             PRIMARY METAB, TCA CYCLE                      0.0004         0.00121
411     XP_021825040.1 Glucose-6-phosphate 1-dehydrogenase                  Oxidoreductase activity             PRIMARY METAB, PENTOSE PHOSPHATE PATHWAY 0.15166             0.00721
505     XP_021817392.1 6-phosphogluconate dehydrogenase.                    Oxidoreductase activity             PRIMARY METAB, PENTOSE PHOSPHATE PATHWAY 0.16838             0.00277
                         decarboxylating 3
883     XP_021831593.1 Gamma carbonic anhydrase 1                           Carbonate dehydratase activity      PRIMARY METAB, PHOTORESP                      0.39206        0
624     XP_021810138.1 Fructose-bisphosphate aldolase 1                     Lyase activity                      PRIMARY METAB, GLYCOLYSIS                     0.01983        0.00042
251     XP_021834633.1 5-methyltetrahydropteroyltriglutamate                Methyltransferase                   PRIMARY METAB, AMINO ACID BIOSYNTH            0.02626        0.000000
                         homocysteine methyltransferase
209     XP_021818418.1 Eukaryotic translation initiation factor 3 subunit B Translation regulation              PRIMARY METAB, PROTEIN BIOSYNTH               0.01917        0.00332
188     XP_021828563.1 Elongation factor 2                                  Polypeptide chain elongation        PRIMARY METAB, PROTEIN BIOSYNTH               0.06334        0.00455
761     XP_021821654.1 Elongation factor 1                                  Polypeptide chain elongation        PRIMARY METAB, PROTEIN BIOSYNTH.              0.45155        0.00002
910     XP_021819098.1 Soluble inorganic pyrophosphatase 4                  Hydrolase activity                  PRIMARY METAB,   PO43--CONTAINING   COMPOUND 0.04654         0.00001
                                                                                                                METABOLIC PROCESS
66      XP_021824244.1 ATP synthase subunit beta                            ATP synthesis                       PRIMARY METAB, ENERGY PRODUCTION              0.14432        0.00849
439     XP_021830782.1 Polyphenol oxidase                                   Oxidoreductase activity (pigment    OTHER                                         0.00005        0.80611
                                                                            biosynthesis)
957     XP_021826507.1 Ferritin-4                                           Iron binding                        OTHER                                         0.03802        0.00003
944     XP_021820122.1 Ferritin-3                                           Iron binding                        OTHER                                         0.00021        0.00003
                                                                              2+
772     XP_021825752.1 Annexin-like protein RJ4                             Ca -dependent phosphlipid binding   OTHER                                         0.00198        0
                                                                                                                                                                                            Page 9 of 24
Berni et al. Horticulture Research (2021)8:12                                                                                                                                                                                                                                                                                                                                                                                                                                                                                         Page 10 of 24

                                    (variety)
                                                                                                                                                                                                                                                                                                                                                                                                                                                                                       The spot identification was done through peptide

                                                0.00033
                                                                                              0.00403
                                                                                                                                                 0.00001
                                                                                                                                                                                  0.00502

                                                                                                                                                                                                                                                           0.00616

                                                                                                                                                                                                                                                                                                                                                                           0.00712
                     p-value (year) p-value

                                                                                                                                                                                                                                                                                                                                                                                                                                                                                     sequence searches in the MASCOT engine. The search
                                                                                                                                                                                                                                                                                                                                                                                                                                                                                     was carried out against the NCBI non-redundant protein

                                                                                                                                                                                                                                                                                                             0
                                                                                                                                                                                                                                                                                                                                                                                                                                                                                     database restricted to the P. avium entries. From an initial
                                                                                                                                                                                                                                                                                                                                                                                                                                                                                     number of 166 proteins, after the identification of the
                                                0.00007

                                                                                                                                                                                                                                                                                                             0.00007
                                                                                                                                                                                                                                                                                                                                                                                                                                                                                     same protein isoforms, 51 proteins were retrieved with a
                                                                                              0.58551
                                                                                                                                                 0.26719
                                                                                                                                                                                  0.43022

                                                                                                                                                                                                                                                           0.14667

                                                                                                                                                                                                                                                                                                                                                                           0.43668
                                                                                                                                                                                                                                                                                                                                                                                                                                                                                     good e-value and similarity sequence score, according to
                                                                                                                                                                                                                                                                                                                                                                                                                                                                                     MASCOT (Table 3). The proteins were classified by
                                                                                                                                                                                                                                                                                                                                                                                                                                                                                     function and category, on the basis of their known
                                                                                                                                                                                                                                                                                                                                                                                                                                                                                     involvement in specific pathways: “Stress”, “Cell wall”,
                                                                                                                                                                                                                                                                                                                                                                                                                                                                                     “Proteasome-related”, “Primary metabolism” and “Other”
                                                                                                                                                                                                                                                                                                                                                                                                                                                                                     (Table 3). Considering all the proteins detected, the three
                                                                                                                                                                                                                                                                                                                                                                                                                                                                                     categories with the highest number of differentially
                                                                                                                                                                                                                                                                                                                                                                                                                                                                                     abundant proteins are “Stress”, “Cell wall” and “Primary
                                                                                                                                                                                                                                                                                                                                                                                                                                                                                     metabolism” (Table 3).
                                                                                                                                                                                                                                                                                                                                                                                                                                                                                       The pattern of protein abundances between the two
                                                                                                                                                                                                                                                                                                                                                                                                                                                                                     varieties and the 3 years is represented as a heatmap
                                                                                                                                                                                                                                                                                                                                                                                                                                                                                     hierarchical clustering in Fig. 5. By choosing a Pearson
                                                                                                                                                                                                                                                                                                                                                                                                                                                                                     correlation coefficient >0.94, two major clusters could be
                       Category

                                                                                                                                                                                                                                                                                                                                                                                                                                                                                     distinguished which correspond to proteins that were
                                                OTHER
                                                                                              OTHER
                                                                                                                                                 OTHER
                                                                                                                                                                                  OTHER

                                                                                                                                                                                                                                                           OTHER

                                                                                                                                                                                                                                                                                                                                                                           OTHER
                                                                                                                                                                                                                                                                                                             OTHER

                                                                                                                                                                                                                                                                                                                                                                                                                                                                                     more abundant in Morellona or Crognola. Nevertheless,
                                                                                                                                                                                                                                                                                                                                                                                                                                                                                     variability in the abundance of some proteins was
                                                                                                                                                                                                                                                                                                                                                                                                                                                                                     observed in Crognola in 2016.
                                                                                                                                                                                                                                                                                                                                                                                                                                                                                       Hereafter, each protein category is discussed separately.

                                                                                                                                                                                                                                                                                                                                                                                                                                                                                     Proteins related to stress response
                                                                                                                                                                                  Nutrient reservoir activity

                                                                                                                                                                                                                                                                                                                                                                                                                                                                                       In the category “Stress”, seven proteins related to the
                                                                                                                                                                                                                                                           Oxidoreductase activity
                                                                                                                                                 Cell cycle/cell division

                                                                                                                                                                                                                                                                                                                                                                                                                                                                                     maintenance of the redox status were found, namely a
                                                                                                                                                                                                                                        /Response to ABA

                                                                                                                                                                                                                                                                                                                                                                                                                                                                                     thioredoxin reductase (TrxR), a superoxide dismutase
                                                                                              GTPase activity
                                                Auxin receptor

                                                                                                                                                                                                                                                                                                                                                                           Ion transport
                                                                                                                                                                                                                                                                                                             Ion transport

                                                                                                                                                                                                                                                                                                                                                                                                                                                                                     (SOD), a peroxiredoxin (Prx), three glutathione-S-trans-
                       Function

                                                                                                                                                                                                                                                                                                                                                                                                                                                                                     ferases (GSTs) and the quinone reductase FQR1 (Table 3).
                                                                                                                                                                                                                                                                                                                                                                                                                                                                                     Additionally, a protein disulfide isomerase (PDI) was
                                                                                                                                                                                                                                                                                                                                                                                                                                                                                     detected, which in plants is involved in the redox control
                                                                                                                                                                                                                                                                                                                                                                                                                                                                                     of proteins’ disulfide bonds, thus likely acting as a cha-
                                                                                                                                                                                                                                                                                                                                                                           XP_021807453.1 Mitochondrial outer membrane protein porin of
                                                                                                                                                                                                                                                                                                             XP_021806982.1 Voltage-gated potassium channel subunit beta

                                                                                                                                                                                                                                                                                                                                                                                                                                                                                     perone in response to stress47. The differences were
                                                                                                                                                                                                                                                                                                                                                                                                                                                                                     mainly related to the variety (Table 3), a finding sug-
                                                                                                                                                                                  XP_021804963.1 Uncharacterized protein LOC110749212

                                                                                                                                                                                                                                                                                                                                                                                                                                                                                     gesting that the two varieties respond differently to
                                                                                              XP_021828712.1 GTP-binding nuclear protein Ran-3

                                                                                                                                                                                                                                                           XP_021820843.1 Short-chain dehydrogenase TIC 32

                                                                                                                                                                                                                                                                                                                                                                                                                                                                                     exogenous cues.
                                                XP_021804938.1 Auxin-binding protein ABP19a

                                                                                                                                                                                                                                                                                                                                                                                                                                                                                       Within plant cells, during normal growth and devel-
                                                                                                                                                                                                                                                                                                                                                                                                                                                                                     opment, there exists a balance between oxidants and
                                                                                                                                                                                                                                                                                                                                                                                                                                                                                     antioxidants48. ROS are needed for normal growth but, at
                                                                                                                                                                                                                                                                                                                                                                                                                                                                                     high levels, they cause premature senescence by oxidative
                                                                                                                                                                                                                                                                                                                                                                                                                                                                                     stress49 that in fruits triggers a loss of texture, flavor and a
                       Protein Name

                                                                                                                                                 XP_021826137.1 Patellin-3-like

                                                                                                                                                                                                                                                                                                                                                                                                                                                                                     decrease in health beneficial molecules.
                                                                                                                                                                                                                                                                                                                                                                                                                                                                                       Among the proteins devoted to the plant’s defense
                                                                                                                                                                                                                                                                                                                                                                                                                                          36 kDa

                                                                                                                                                                                                                                                                                                                                                                                                                                                                                     against (a) biotic stresses, glutathione S-transferase
                                                                                                                                                                                                                                                                                                                                                                                                                                                   The p-values < 0.01 are in bold

                                                                                                                                                                                                                                                                                                                                                                                                                                                                                     DHAR2 (DHAR2) is present in a similar concentration
                       Spot No Accession No

                                                                                                                                                                                                                                                                                                                                                                                                                                                                                     between the varieties Morellona and Crognola. On the
 Table 3 continued

                                                                                                                                                                                                                                                                                                                                                                                                                                                                                     contrary, the amount of this protein appeared to increase
                                                                                                                                                                                                                                                                                                                                                                                                                                                                                     in relation to the different years of harvest. Indeed, in
                                                                                                                                                                                                                                                                                                                                                                                                                                                                                     2018 an increase of DHAR2 can be noticed in both
                                                                                                                                                                                                                                                                                                                                                                                                                                                                                     varieties, maybe due to the variable environmental con-
                                                                                                                                                                                                                                                                                                                                                                                                                                                                                     ditions. DHAR2 belongs to a subclass of enzymes in the
                                                1024

                                                                                                                                                                                  1009
                                                                                              887

                                                                                                                                                                                                                                                           814
                                                                                                                                                                                                                                                                                                             725
                                                                                                                                                                                                                                                                                                                                                                           802
                                                                                                                                                 46

                                                                                                                                                                                                                                                                                                                                                                                                                                                                                     wide group of GSTs and is able to catalyze the reduction
Berni et al. Horticulture Research (2021)8:12                                                                                   Page 11 of 24

 Fig. 5 Heatmap hierarchical clustering of the 51 proteins changing significantly between Crognola and Morellona across the 3 years of
 study. The color bar indicates the log10-transformed relative protein abundances. The numbers indicate the Pearson’s correlation coefficients

of dehydroascorbate to ascorbate with the concomitant                    whether Morellona produces more glucosinolates than
oxidation of reduced GSH to glutathione disulfide50,51.                   Crognola. The differences observed may also be due to
  GST F11 belongs to another GST group carrying out                      biotic stress events, since glucosinolates are typically
different reactions compared to the main GST class, due                  synthesized in response to herbivores’ attack55.
to the lack of a serine in the active site. Instead, GST                   Prx is a protein that is commonly responsible for the
F11 seems to have a role in glucosinolate metabolism50,52.               signaling related to ROS56 and acts together with TrxR
GST F11 was highly abundant in the variety Morellona,                    and by using NADPH as a source of reducing power57,58.
thereby showing a dependency on the genotype. The                        The Prx BAS1 here identified as more abundant in
higher abundance of GST F11, involved in the glucosi-                    Crognola was reported to be involved in the protection
nolate pathway53, is interesting in light of the health-                 against oxidative stress by participating, together with the
related effects of isothiocyanates. These are indeed                     Trx CDSP32, in the reduction of alkyl hydroperoxides59.
molecules obtained through the action of myrosinase on                     Statistically significant changes between the varieties
glucosinolates and displaying anticancerogenic activity54.               were obtained also for the quinone reductase FQR1 which
It remains to be verified whether glucosinolates are pre-                 showed higher levels in Crognola: the corresponding gene
sent in sweet cherry (the protocol here used is indeed not               was shown to be induced by auxin despite the absence of
optimized to extract this class of compounds) and                        auxin-responsive elements in its promoter and to be
Berni et al. Horticulture Research (2021)8:12                                                                    Page 12 of 24

involved in stress response by regulating oxidative stress        AtXTH31 accounts for the majority of XET activity in
together with GST60.                                              Arabidopsis thaliana roots and has a pivotal role under Al
  In the category “Stress”, proteins related to the response      stress72.
to external cues (temperature stress) were identified.               The phylogenetic analysis of thale cress, poplar, tomato
More specifically, SRC2 (the product of soybean gene               and nasturtium XTHs showed that the cherry XTH31
regulated by cold-2), a low-temperature-induced cysteine          clustered in group III-A, together with AtXTH31, the
proteinase, a stromal 70 kDa heat shock-related protein           paralog AtXTH32 and nasturtium TmNXG1 (a pre-
(HSP), a 17.1 kDa class II and a 70 kDa HSPs, together            dominant xyloglucan hydrolase67) (Supplementary Fig. 5).
with a 20 kDa chaperonin showed differences between the             It was demonstrated that thale cress XTHs from group
varieties (Table 3).                                              III-A are endohydrolases involved in tissue expansion and
  SRC2 is considered a cold stress marker: an increase of         are dispensable for normal growth73.
this protein was indeed reported in plant tissues exposed           XTH31 was identified in 6 different spots; one of them
to low temperatures61.                                            showed a significant decrease in abundance in Morellona.
  Glycine-rich protein 2 (GRP2) was identified in 10 dif-          The statistically significant difference detected between
ferent spots. Two of them were more abundant in Mor-              the two varieties (Table 3) is interesting if one considers
ellona and varied across the years (Table 3, Fig. 5).             the sizes of the fruits produced by the 2 varieties: Mor-
Domain analysis of sweet cherry GRP2 with Motif Scan              ellona is significantly bigger than Crognola (p < 0.05, n =
(https://myhits.isb-sib.ch/cgi-bin/motif_scan)         revealed   10, diameter Morellona = 1.77 ± 0.10 cm, diameter Crog-
the presence of a glycine-rich, as well as, an ABA/WDS            nola = 1.64 ± 0.09 cm; height Morellona = 1.95 ± 0.05 cm,
domain (Abscisic Acid/Water Deficit Stress) domain (e-             height Crognola = 1.76 ± 0.10 cm).
value=2.9e-45). The ABA/WDS domain was found in the                 The other XTH detected in the soluble proteomes of the
dual transcription factor/chaperone protein ASR1 (ABA,            two Tuscan varieties is XTH6, which clusters together
Stress and Ripening) which was induced in tomato upon             with AtXTH6 (Supplementary Fig. 5). The abundance of
drought and was expressed during ripening62. GRP2 is              XTH6 increased in thale cress shoots and roots under heat
also linked to fruit maturation. For example, in pear, this       stress in response to cytokinin74, while the transcript was
protein increased in abundance after gibberellin applica-         downregulated upon drought stress in 6 different acces-
tion63. This plant growth regulator induces fruit expan-          sions of A. thaliana75. It is therefore reasonable to assume
sion and GRPs are known to act at the cell wall level by          that, in Crognola, the higher abundance of XTH6 is linked
providing a scaffold for the deposition of cell wall              to environmental cues to which the variety reacted.
constituents64.                                                     Alpha-xylosidases are involved in xyloglucan remodel-
  Crognola showed higher abundance of HSP70, 20 and               ing76; the sweet cherry XYL1 identified via proteomics is
17.1 (members of small HSPs; Table 3) which are involved          orthologous to thale cress XYL1. The higher abundance
in the tolerance to abiotic stresses65,66, as well as of a low-   in Morellona is indicative of a higher xyloglucan remo-
temperature-induced cysteine proteinase showing the pre-          deling at maturity. A previous study showed that xyl1/
sence of granulin domains (e-values = 1.2e−10, 2.1e−06).          axy3 mutants displayed reduced silique length and altered
                                                                  xyloglucan structure, where the hemicellulose was less
Proteins related to the cell wall                                 tightly bound to other cell wall components77.
  The proteomic analysis revealed six proteins related to           Differences in the abundance of a UTP-glucose-1-
the cell wall: a xyloglucan endotransglucosylase/hydrolase        phosphate uridylyltransferase were also detected between
31 (XTH31), a UTP-glucose-1-phosphate uridylyltransfer-           the two Tuscan varieties. A BLASTp analysis against thale
ase. a xyloglucan endotransglucosylase/hydrolase 6 (XTH6),        cress revealed sequence similarity with UGP2, one of the
an alpha-xylosidase 1, a β-glucosidase and an acid beta-          two genes contributing to sucrose and cell wall bio-
fructofuranosidase 1 (Table 3).                                   synthesis78. The higher expression in Morellona may
  Xyloglucans bridge cellulose microfibril, thereby con-           indicate an involvement in cell wall-related processes and
tributing to the mechanical properties of the cell walls and      in accommodating the request of nucleotide sugars during
to morphogenesis67. XTHs display both xyloglucan                  fruit maturation. The bigger size of Morellona cherries as
endotransglucosylase (XET, cutting and rejoining xylo-            compared to Crognola may indeed require a higher pro-
glucan chains) and xyloglucan endo-hydrolase (XEH,                vision of precursors for cell wall biosynthesis.
hydrolysis of xyloglucan) activities68–71. The majority of          A β-glucosidase (BGLU) with sequence similarity to the
XTHs enzyme kinetics data showed the predominant                  apoplast-localized A. thaliana BGLU15 was also identified
presence of XET activity; a bioinformatic analysis coupled        as more abundant in Crognola, with respect to Morellona.
to structural data and enzymology predicted AtXTH31                 Interestingly, despite the apoplastic localization, this
and 32 from thale cress as potential hydrolases belonging         protein is not related to cell wall processes, but to the
to clade III-A67. Subsequent studies showed that                  hydrolysis of flavonol 3-O-β-glucoside-7-O-α-rhamnoside
Berni et al. Horticulture Research (2021)8:12                                                                   Page 13 of 24

(a flavonol bisglycoside acting as antioxidant and reducing     turnover of proteins, operated, among other actors, by the
ROS damage), which occurs in thale cress during recovery       proteasome system87.
from synergistic abiotic stresses (i.e. N deficiency, low         The ubiquitin receptor RAD23c, the proteasome sub-
temperature, high light intensity, UV light)79,80. There-      units alpha type-6 and beta type-6 were found to be dif-
fore, the BGLU protein seems to be linked to stress-           ferentially abundant in dependence of the years and the
related pathways.                                              varieties (Table 3).
                                                                 Interestingly, for the variety Crognola, the alpha type-6
Proteins related to primary metabolism                         subunit was more abundant in 2016, while in 2017 and
   In the category “Primary metabolism”, 15 differentially     2018, the beta type-6 subunit was higher in abundance
abundant proteins were identified (Table 3), the majority       (probably coinciding with different moments of the pro-
of which was more abundant in Morellona in 2017 and            tein complex turnover).
2018 (Fig. 5). The differences detected may be due to the        It should be noted that polyphenol oxidase (PPO) was the
different genotypes; however, plant primary metabolism is      only detected protein in the category “Other” related to the
also significantly influenced by environmental conditions,       metabolism of phenolic compounds: this enzyme catalyzes
like biotic81 and abiotic constraints82 encountered in the     the polymerization of quinones formed through the oxi-
field during the different years studied.                       dation of phenols88 to produce brown pigments. PPO plays
   Three different proteins related to carbohydrate meta-      also a role against biotic stresses, such as insect attacks and
bolism were identified (Table 3), i.e. glucose-6-phosphate      in defense mechanisms related to altered environmental
dehydrogenase (G6PDH), 6-phosphogluconate dehy-                conditions88,89. Although a dependence on the year of
drogenase (6PGDH) and fructose-bisphosphate aldolase           harvest was detected (Fig. 5), Crognola showed the highest
(FBA), showed significant differences between the two           amount of PPO. Future studies will confirm if a higher
cherry varieties. The abundance of these 3 proteins was        amount of PPO in fruits may confer additional defense
generally higher and steady in the variety Morellona           properties in relation to stress conditions in this variety.
during the 3 years. On the contrary, Crognola showed a           Two ferritins were also more abundant in Crognola in
variable abundance: indeed, as shown in Fig. 5, the levels     2017 and 2018 (Fig. 5). A ferritin was previously also
of G6PDH, 6PGDH and FBA were higher in 2016 than               identified via proteomics in peach during its development
2017 and 2018. G6PDH and 6PGDH are involved in the             and its abundance was higher in the mesocarp90. Besides
oxidative pentose phosphate pathway and their role,            playing a role in iron storage, ferritins are also involved in
despite linked to glucose oxidation, is anabolic, rather       ROS metabolism and the maintenance of the redox bal-
than catabolic. Additionally, G6PDH sustains nitrogen          ance within plant tissues91.
assimilation83 and counteracts stress conditions84.              Considering their secondary role in ROS detoxification,
   Four proteins related to the tricarboxylic acid cycle       the results obtained for ferritins can be compared with
(TCA) were also detected: aconitate hydratase (ACO),           those previously discussed for proteins related to the
isocitrate dehydrogenase (IDH), 2-oxoglutarate dehy-           stress response. Ferritin 3 and 4 showed a higher abun-
drogenase (OGDH) and malate dehydrogenase (MDH). In            dance in Crognola, especially in 2017 and 2018, similarly
2017 and 2018, the abundance of these proteins, as well as     to what described for BAS1, FQR1 and HSPs. Therefore,
phosphoenolpyruvate carboxykinase (PEPCK), was higher          Crognola and Morellona showed different levels of pro-
in Morellona (Fig. 5). Fruit maturity is linked with primary   teins related to stress response. More specifically, Crog-
metabolism and the production of organic acids. In sweet       nola had an overall higher abundance of these proteins.
cherry, malate accumulates at the highest levels during
stage III (coinciding with expansion and ripening) and is      Gene expression analysis on some targets identified with
used for gluconeogenesis by the action of PEPCK85.             proteomics
Therefore, from the results obtained, it appears that the        The expression of genes belonging to the categories
fruits of Morellona put in place biochemical processes         “Stress” and “Cell wall” was measured to find a correlation
linked with fruit maturation earlier than Crognola. This       with the abundances highlighted by proteomics. The
finding is supported by the previously described higher         expression of PPO within the category “Other” was also
abundance of GRP2 which is involved in cell wall-related       studied. Nineteen primers were designed on the targets
processes accompanying ripening, as well as of annexin         reported in Table 4.
RJ4 (in the category “Other”, see below), typically              The gene expression graph is given in Fig. 6. Hereafter,
expressed during fruit ripening in strawberry86.               the genes confirming the trend observed in proteomics
                                                               are described with more emphasis.
Proteins related to the proteasome and other functions           The gene encoding the 2-Cys peroxiredoxin
 In order to cope with the organism’s demands and to           BAS1 showed no difference among the three years in
maintain the normal functions, cells require a continuous      Crognola, while in Morellona sampled in 2017 it displayed
Berni et al. Horticulture Research (2021)8:12                                                                         Page 14 of 24

Table 4 Target proteins on whose corresponding genes                     In the category “Cell wall”, the gene coding for XTH31
primers for RT-qPCR were designed. Their categories are                was expressed at higher levels in Morellona (Fig. 6), as
also indicated                                                         previously seen also for the protein abundances (Fig. 5).
                                                                       Differently from what observed with proteomics, XTH6
Targets                                     Abbreviation   Category
                                                                       did not show a statistically significant difference between
Polyphenol oxidase                          PPO            OTHER       the two varieties. In 2018, XTH6 was induced in Mor-
                                                                       ellona (Fig. 6).
SRC2                                        SRC2           STRESS
                                                                         The partial agreement of the RT-qPCR data with pro-
Glutathione S-transferase F11               GST            STRESS      teomics is not surprising: it is known that gene expression
Superoxide dismutase                        SOD            STRESS      changes are not always accompanied by a similar trend in
Thioredoxin reductase NTRB                  NTR            STRESS      the corresponding proteins92. This can be due to post-
                                                                       transcriptional modifications or to other protein proces-
Glutathione S-transferase DHAR2             DHAR2          STRESS
                                                                       sing events. However, it was possible to confirm, at the
2-Cys peroxiredoxin BAS1                    BAS1           STRESS      gene level, that XTH31 was upregulated in Morellona at
Stromal 70 kDa heat shock-related protein   70HS           STRESS      the sampling time-point.
Heat shock cognate 70 kDa protein 2         70HS2          STRESS
Low-temperature-induced cysteine            LTP            STRESS
                                                                       Conclusions
                                                                         This is the first study providing a multi-angle molecular
proteinase
                                                                       analysis of non-commercial sweet cherry fruits from
17.1 kDa class II heat shock protein        HSP17          STRESS      Tuscany. From the results obtained with metabolomics, it
Glycine-rich protein 2                      RBG2           STRESS      emerges that the Tuscan sweet cherries are interesting
20 kDa chaperonin                           CPN20          STRESS      from a nutraceutical point of view. In particular, the
                                                                       varieties Crognola and Morellona are the most valuable in
Beta-glucosidase                            BGL            CELL WALL
                                                                       terms of bioactive content and show genetic features that
Xyloglucan endotransglucosylase 31          XTH31          CELL WALL   distinguish them from all the others. Besides being rich
Xyloglucan endotransglucosylase 6           XTH6           CELL WALL   sources of flavonoids, the two varieties were found to
Alpha-xylosidase 1                          XYL1           CELL WALL   produce higher amounts of the rare flavonolignan cinch-
                                                                       onain which has interesting health properties. The RT-
Acid beta-fructofuranosidase 1              VI1            CELL WALL
                                                                       qPCR analysis revealed what was already shown for other
UTP-glucose-1-phosphate                     UGP2           CELL WALL   fruits, i.e. that the expression of the genes differed among
uridylyltransferase                                                    the varieties and across the years and could not always
                                                                       explain the differences observed in the content of sec-
                                                                       ondary metabolites. Proteomics revealed differences
the lowest expression. Generally, BAS1 showed lower                    between the two most interesting varieties in terms of
expression in Morellona, thereby confirming the results                 flavonoids’ abundance, Morellona and Crognola.
obtained with proteomics (Fig. 5 and Table 3).                           Despite the differences detected across the years for
  GST F11 showed higher expression in Morellona:                       gene expression, it is possible to resume the key finding as
despite the low expression in 2018, it was highly expressed            follows: (a) Morellona and Crognola showed the highest
in this variety in the years 2016 and 2017, thus following             contents of phenolic compounds, (b) the higher produc-
the trend of the protein.                                              tion of metabolites in Morellona was accompanied by a
  The gene HSP17.1 varied in expression among the years                high expression of genes involved in the late phases of the
of harvest, mostly in the variety Crognola. According to               PPP in 2016 and 2017 and (c) the 2 top producers of
Table 3, the protein HSP17.1 showed statistically sig-                 phenolics show different proteome signatures, i.e. stress-
nificant variations across the years of study, confirming                related proteins were more abundant in Crognola, while
the gene expression results. Moreover, the high protein                Morellona showed higher abundance of proteins related
abundance in Crognola in 2018 was in agreement with the                with primary metabolic functions, fruit maturation and
high expression in Fig. 5.                                             cell wall remodeling.
  The gene PPO showed variations in the 3 years in                       These data open the way to future investigations aimed
Morellona, especially in 2016 and 2018. In accordance                  at studying the Tuscan fruits at different developmental
with these data, the relative protein showed statistically             stages and/or at assessing the post-harvest stability of the
significant variations across the years (Fig. 5).                       cherries produced by Morellona and Crognola. It may be
  A clear trend could be observed for SRC2, expressed at               that the two varieties show a distinct post-harvest beha-
higher levels in the variety Morellona. Notably, the rela-             vior which makes one of them more suitable for a com-
tive protein was also more abundant in Morellona (Fig. 5).             mercial valorization.
You can also read