Correlation of 360-degree Surface Mapping - Harvard DASH
←
→
Page content transcription
If your browser does not render page correctly, please read the page content below
Correlation of 360-degree Surface Mapping
   In Vivo Bioluminescence with Multi-
    Spectral Optoacoustic Tomography
    in Human Xenograft Tumor Models
                  The Harvard community has made this
               article openly available. Please share how
               this access benefits you. Your story matters

Citation              Brannen, Andrew, Matthew Eggert, Matthias Nahrendorf, Robert
                      Arnold, and Peter Panizzi. 2018. “Correlation of 360-degree
                      Surface Mapping In Vivo Bioluminescence with Multi-Spectral
                      Optoacoustic Tomography in Human Xenograft Tumor Models.”
                      Scientific Reports 8 (1): 3321. doi:10.1038/s41598-018-21668-4.
                      http://dx.doi.org/10.1038/s41598-018-21668-4.

Published Version     doi:10.1038/s41598-018-21668-4

Citable link          http://nrs.harvard.edu/urn-3:HUL.InstRepos:35014394

Terms of Use          This article was downloaded from Harvard University’s DASH
                      repository, and is made available under the terms and conditions
                      applicable to Other Posted Material, as set forth at http://
                      nrs.harvard.edu/urn-3:HUL.InstRepos:dash.current.terms-of-
                      use#LAA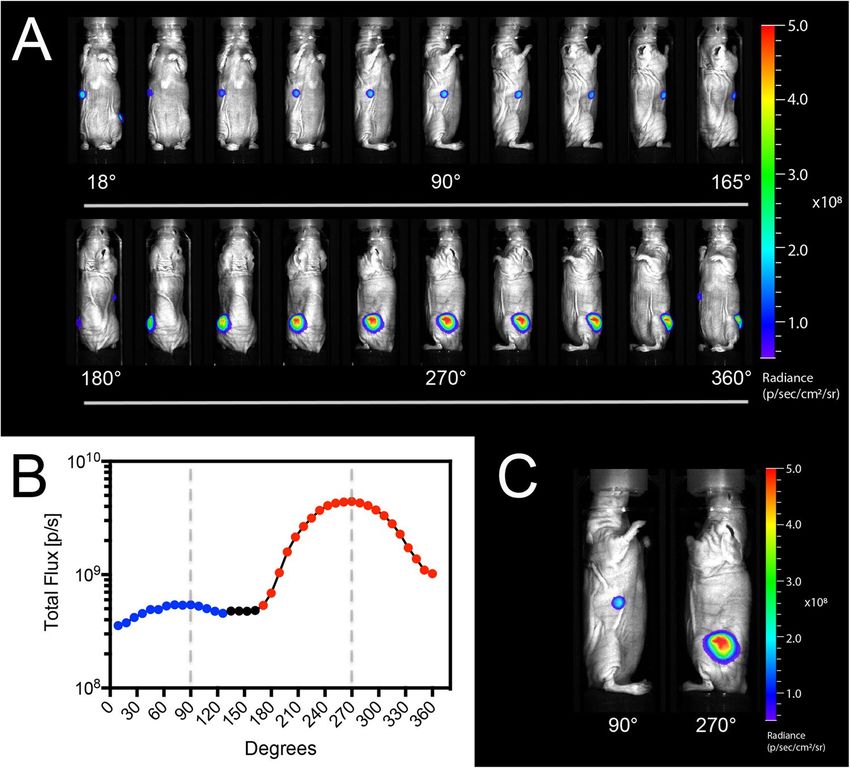
www.nature.com/scientificreports

                        OPEN          Correlation of 360-degree Surface
                                      Mapping In Vivo Bioluminescence
                                      with Multi-Spectral Optoacoustic
Received: 24 May 2017
Accepted: 8 February 2018             Tomography in Human Xenograft
                                      Tumor Models
Published: xx xx xxxx

                                                             1,2                        1
                                      Andrew Brannen               , Matthew Eggert         , Matthias Nahrendorf3, Robert Arnold          1
                                                                                                                                               &
                                      Peter Panizzi 1,2
                                      Pre-clinical monitoring of tumor growth and identification of distal metastasis requires a balance
                                      between accuracy and expediency. Bioluminescence imaging (BLI) is often used to track tumor growth
                                      but is primarily limited to planar 2-dimensional (2D) imaging. Consistent subject placement within a
                                      standard top-mounted, single-detector small animal imager is vital to reducing variability in repeated
                                      same-animal measures over time. Here, we describe a method for tracking tumor development using
                                      a multi-angle BLI and photo-acoustic workflow. We correlate serial caliper measurements and 2D
                                      BLI to 360° BLI and photo-acoustic datasets for the same animals. Full 360° BLI showed improved
                                      correlations with both volumes obtained from caliper measurements and photo-acoustic segmentation,
                                      as compared to planar BLI. We also determined segmented tumor volumes from photo-acoustic
                                      datasets more accurately reflects true excised tumors’ volumes compared to caliper measurements.
                                      Our results demonstrate the distinct advantages of both 360° surface mapping by BLI and photo-
                                      acoustic methodologies for non-invasive tracking of tumor growth in pre-clinical academic settings.
                                      Furthermore, our design is fully implementable in all top-mounted, single-detector imagers, thereby
                                      providing the opportunity to shift the paradigm away from planar BLI into rapid BLI tomography
                                      applications.

                                      Routine tracking of tumor growth in mice is an essential component of most pre-clinical cancer studies. In the
                                      past, caliper measurements have been the primary tool researchers had for monitoring the development of sub-
                                      cutaneously implanted tumors over time. Yet these methods have high relative standard deviations caused by
                                      the inability to circumvent the entire tumor in a living animal, so that tumor size is approximated rather than
                                      truly defined1,2. To address this problem, subcutaneously implanted tumors are often presumed to be ellipsoidal
                                      in shape, with volumes often calculated with the assumption that the z-axis is equal to the shorter of the x/y axis
                                      dimensions3–5. As a result, inherently inconsistent tumor morphology causes noisy tumor development progress
                                      curves and, ultimately, higher animal usage to reach statistical significance in comparative studies. Despite these
                                      issues, calipers remain the primary standard of tumor measurement in many cancer studies.
                                          The advent of contrast-enhanced micro-computed tomography (CT) and magnetic resonance imaging (MRI)
                                      has revolutionized tumor volume determination along the continuum of disease progression5,6. However, both
                                      modalities have inherent limitations. CT requires ionizing radiation and relies on exogenous agents to deliver
                                      the soft tissue contrast needed to define tumor borders and vascular supply networks. MR imaging requires
                                      longer acquisition times and increased budgetary considerations, especially for routine measurements of tumor
                                      size in large cohorts of animals3,7. Furthermore, most academic settings and vivaria have limited access to these

                                      1
                                       Department of Drug Discovery and Development, Harrison School of Pharmacy, Auburn University, 247 Pharmacy
                                      Research Building, 720 South Donahue Dr., Auburn, AL, 36849, USA. 2Auburn Laboratory for Imaging Animal
                                      Systems, College of Veterinary Medicine, Auburn University, 403 Green Annex, Auburn, AL, 36849, USA. 3Center for
                                      Systems Biology, Massachusetts General Hospital & Harvard Medical School, 185 Cambridge Street, Boston, MA,
                                      02115, USA. Correspondence and requests for materials should be addressed to P.P. (email: panizzi@auburn.edu)

        SCientifiC RePorts | (2018) 8:3321 | DOI:10.1038/s41598-018-21668-4                                                                            1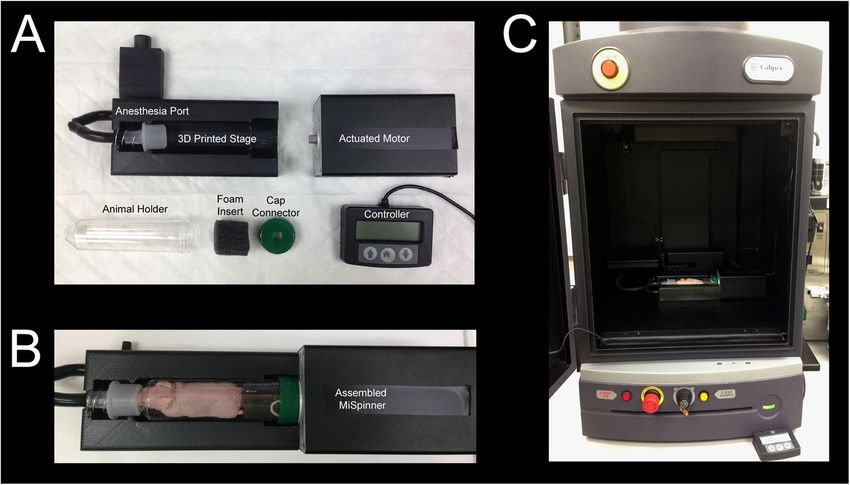
www.nature.com/scientificreports/
technologies, thereby reducing both modalities’ utility for assessing tumor volume7. Using surrogate signals to
approximate tumor volumes is an attractive alternative approach to quantifying tumor size and response to ther-
apy. Surrogate signal techniques include optical imaging approaches, such as bioluminescence, fluorescence (flu-
orescence reflectance imaging (FRI) and fluorescence molecular tomography (FMT)), and radiologic methods
such as single positron emission computed tomography (SPECT) and positron emission tomography (PET).
Other technologies such as photo-acoustic and hybrid photo-acoustic/ultrasonic imaging use the absorptive
properties of endogenous chromophores for contrast while facilitating exogenous probe detection to measure
signal deep within animals8,9.
Bioluminescence imaging (BLI) is another popular alternative to track relative tumor growth and anti-cancer
treatment efficacy10. Traditional in vivo BLI is a planar projection that collapses all light production within a given
space into a singular 2-dimensional or flat image and has no capacity to equate volumes or assign depth to these
measures. Yet BLI remains an attractive imaging modality because, especially in cancer studies, animals can be
implanted with a diverse range of luciferase-expressing cell-lines and imaging luciferase-positive cancer cells
would only require intraperitoneal (IP) administration of the small-molecule substrate luciferin. Since luciferase
is not found in mammals, light production is limited to sites where luciferin is oxidized by intracellular luciferase
contained with these bio-engineered cancer cells. This affords BLI a distinct advantage over calipers as tumors
located within the body cavity can be monitored via their total light production, including metastatic tumors
that localize to distance sites such as the lungs or brain. Despite its appeal, light production in BLI is governed
by the availability of aforementioned exogenous luciferin substrate, adenosine triphosphate (ATP), and molec-
ular oxygen, all of which must be delivered to luciferase-expressing cancer cells by highly developed vascular or
vascular-mimicking networks ingrained in developing tumors11–13. BLI is also limited by the physical location of
the bioluminescent signal source within the body relative to the detector.
In addition to influencing fuel delivery to the light-producing cellular engine, the physical location of the
bioluminescent source also profoundly impacts the perceived cellular density implied by the overall intensity
readings collected from an image collected at a single vantage point. The confounding factor is that as light moves
through the animal, there is a scattering effect due to the inherent properties of tissue as a non-homogenous
medium for light propagation and diminished intensity caused by the absorptive properties of blood, fat, and
muscle14. These tissue-scattering considerations complicate longitudinal BLI studies, as animal positioning needs
to be consistent among all time points in a given dataset for optimal results5. To address positional bias, research-
ers often manually orient the animal and acquire multiple images in an attempt to find the optimal orientation for
each time point. However, this process is often laborious and subjective, particularly when attempting to localize
metastatic sites at a distance from the primary tumor site. The magnitude of BLI signal is related to both the size
(i.e. density) of luciferase expressing cells and depth of these masses within the animal. Reconstructing diffuse BLI
projections back into the original source by use of tomographic algorithms (so called BLI tomography or BLT)
has been met with some success, but there is no standard convention to move from BLI to BLT15–25. The advantage
our 360° surface mapping for BLI presented here is that it would provide consistent datasets to evaluate the com-
parative merits of different BLT algorithms moving forward.
The goals of this study were (1) to develop a method for eliminating positional bias in order to improve cor-
relations between longitudinal BLI and tumor volume, (2) to create a standardized and cost-effective method for
labs to generate 360° surface mapping of BLI datasets, and (3) to validate multi-spectral optoacoustic tomography
(MSOT) for quantifying tumor volumes. To this end, we tracked the growth of subcutaneous prostate cancer
xenografts via the Mouse Imaging Spinner (MiSpinner), our developed-in-house prototype for acquiring 360° in
vivo BLI, in athymic mice over a 9-week time course. We evaluated standard planar BLI, MiSpinner-determined
optimal angle BLI, and area under the curve (AUC) of 360° BLI and correlated these measures with volumes
determined by digital caliper measurements, volumetric MSOT segmentations, and ex vivo digital caliper meas-
urements. Our results indicated that MiSpinner-based BLI data better correlated with tumor volumes as com-
pared to planar static BLI. Further, we demonstrated that volumes determined from photo-acoustic imaging
using the MSOT more accurately reflected the true tumor volumes as measured ex vivo by digital calipers.
Results
MiSpinner System Components and Assembly. The basic components of the MiSpinner system are a
step-motor attached to a customized 3-D printed stage, which stabilizes the animal holder during the rotation
process (Fig. 1). The animal holder is a modified polystyrene 50 mL conical tube, with the conical end cut open to
allow oxygen and anesthesia flow to the animal, and a screw cap modified with a square 8 × 8 mm hole punched in
the center for connection to the step motor. A critical component is a custom-made foam cylinder with a central
slit that is wrapped around the base of the mouse-tail to further stabilize the animal during the rotation process.
We found that incorporating this foam cylinder greatly reduced animal movement during the rotation process.
The assembled system is connected to the existing gas supply manifold within the IVIS Lumina XRMS system.
Acquisition occurs step-wise, with the user pressing a button to rotate the animal a pre-programmed number of
degrees, followed by image acquisition as normal and repetition of the process until the animal has rotated 360°.
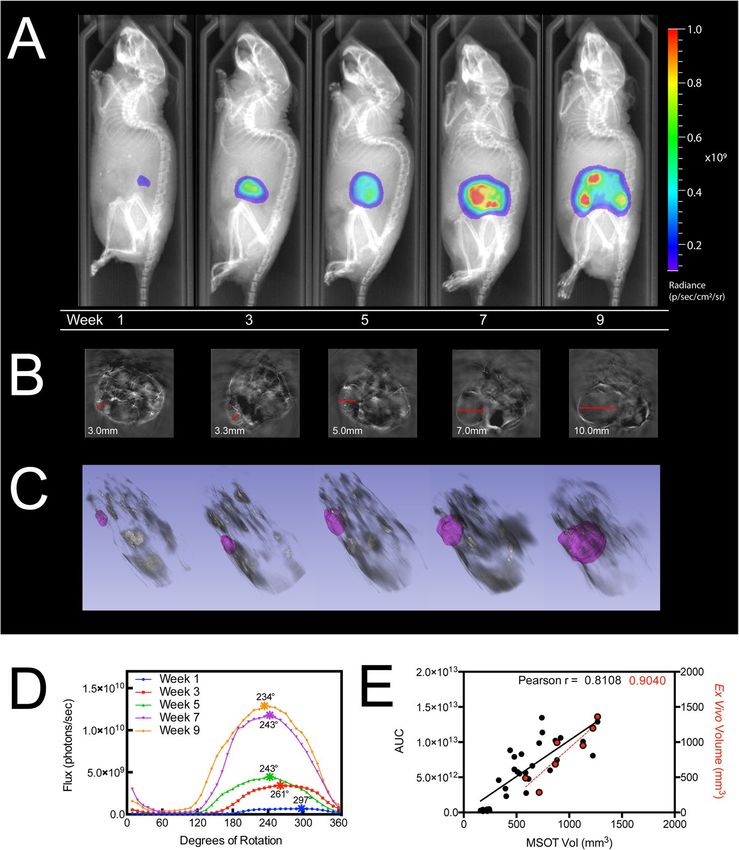
Multi-Angle BLI in Mouse Bearing Multiple Tumors. To simulate a mouse bearing a primary tumor and
smaller distal metastasis, one NCR nu/nu female mouse was implanted with 2 × 10⁶ MDA-MB-231-Luc2-GFP
cells in the left flank and 1 × 10⁶ cells in the right flank. This mouse was imaged using our MiSpinner system at 6
weeks post-implantation with 9° intervals for full 360° rotation, shown in Fig. 2A (images shown at 18° intervals).
In Fig. 2B, bioluminescent flux is plotted against the degrees of rotation for each respective image. Two distinct
peaks were resolved from this plot, with peak signal at 90° and 270° denoted by dashed lines corresponding to the
images in Fig. 2C.
SCientifiC RePorts | (2018) 8:3321 | DOI:10.1038/s41598-018-21668-4 2www.nature.com/scientificreports/
Figure 1. (A) The MiSpinner comprises a step motor attached to a custom 3D-printed stage with an integrated
gas anesthesia port. The animal holder consists of a polystyrene 50 mL conical tube with the conical end cut
open to allow for gas flow. The cap is modified with a square hole for attaching the axle to the motor. The mouse
is oriented in the holder with its head toward the conical end, and the holder is placed on the 3D-printed stage
(B). The assembled system is placed inside the imaging chamber with the motor wired to a remote controller
that is fed through a light-tight port on the side of the IVIS Lumina XRMS (C).
Figure 2. (A) A Mouse implanted with two opposing MDA-MB-231-Luc2-GFP tumors of different sizes
imaged by BLI at 15° intervals by 360° surface mapping. (B) Total flux plotted against each respective angle of
rotation. The 90° and 270° datasets signal were determined to be the maxima for each individual tumor and
are designated by dashed lines on the plot. (C) Images for the 90° and 270° datasets determined to be the local
maximas for total light production in panel B.
SCientifiC RePorts | (2018) 8:3321 | DOI:10.1038/s41598-018-21668-4 3www.nature.com/scientificreports/
Figure 3. Subcutaneous PC-3-Luc2 implanted tumors longitudinally imaged using 360° BLI and MSOT.
(A) MiSpinner-determined optimal angle of rotation (i.e. peak luminescent flux) overlaid on X-ray at bi-
weekly time points. (B) Transverse sections of longitudinal MSOT scans at the site of tumor growth and (C)
corresponding in silico segmentations superimposed on 3D rendering of whole-body MSOT scans with 850 nm
background signal. (D) Luminescent flux is plotted against the relative degrees of rotation with respective peak
angles denoted by (*). (E) Linear fit and Pearson correlation of MSOT segmented tumor volumes versus the
area under the curve (AUC) of bioluminescent flux (solid black line) and ex vivo volumes (dashed red line) of
mice (n = 7).
Longitudinally Assessing Tumor Growth with Multi-Angle BLI. To demonstrate how surface map-
ping of BLI can be used to track longitudinal tumor growth, Fig. 3A shows one mouse imaged with the opti-
mal imaging angle (i.e. peak luminescent flux), at bi-weekly time points, overlaid on X-ray. We also acquired
MSOT scans at corresponding time points and determined tumor volumes in silico by segmentation (Fig. 3B,C).
Figure 3D shows the longitudinal 360° flux curves with the optimal imaging angle denoted by an asterisk. In
Fig. 3E, MSOT determined tumor volumes are plotted against both AUC and ex vivo volumes with correspond-
ing linear fits (n = 7 mice). Corresponding Pearson correlation values are shown at the top, and comprehensive
correlations are listed in Table 1.
Multi-Angle BLI Correlates More Significantly with Tumor Volume than Standard BLI. To assess
multi-angle BLI’s utility for defining longitudinal tumor growth, we undertook an expanded study with n = 7
mice. Figure 3E demonstrates MSOT-determined tumor volumes’ correlation with AUC. Ex vivo volumes are
represented in red and plotted against MSOT volumes with fit denoted by the red dashed line. Table 1 summarizes
the results of standard BLI, MiSpinner-determined optimal angle BLI, and AUC linear correlations to caliper
and MSOT volumes. Notably, MSOT-determined volumes strongly correlate with ex vivo volume measurements
(Pearson r = 0.904; p-value of 0.005); as expected, caliper volumes poorly correlate with ex vivo volumes (Pearson
SCientifiC RePorts | (2018) 8:3321 | DOI:10.1038/s41598-018-21668-4 4www.nature.com/scientificreports/
Parametric correlation (Pearson r)
MSOT Volume Caliper Volume
AUC (n = 30) 0.8108 (p < 0.0001) 0.7930 (p < 0.0001)
Optimal angle BLI (n = 30) 0.8073 (p < 0.0001) 0.7938 (p < 0.0001)
Standard BLI (n = 30) 0.7551 (p < 0.0001) 0.7380 (p < 0.0001)
MSOT volume (n = 30) n/a 0.9270 (p < 0.0001)
Caliper volume (n = 30) 0.9270 (p < 0.0001) n/a
Ex vivo (n = 7) 0.9040 (p = 0.0052) 0.7642 (p = 0.0455)
Table 1. Pearson correlation of longitudinal caliper volumes and in silico volumes from MSOT segmentation
with standard BLI, optimal angle BLI using the MiSpinner, and AUC in a PC-3-Luc2 subcutaneous tumor
model. Endpoint ex vivo tumor volumes are shown with respective correlations to MSOT and caliper-
determined tumor volume. p values are two-tailed with alpha equal to 0.05.
r = 0.764; p-value of 0.046). AUC best correlates with both caliper and MSOT volumes, but this correlation is only
slightly higher than optimal-angle BLI. Finally, standard BLI had the weakest correlation with caliper and MSOT
volumes.
Demonstration of Positional Bias using Multi-Angle BLI. As shown in Supplemental Fig. 1, we
imaged a multi-lobular tumor at 7.5° intervals around a 360° centralized axis. The figure shows images at 15°
intervals to demonstrate the difference in overall signal intensity at each orientation. Qualitatively, signal appear-
ance varies drastically with minor changes in orientation. Supplemental Fig. 1B further illustrates the differences
in luminescent signal morphology. At 90°, the tumor appears to be a single large lobe with a potentially smaller
lobe slightly superior to the major lobe. However, at 135° the tumor morphology indicates two distinct major
lobes plus a small third lobe. To quantitate the differences in signal, four regions of interest (ROI) were arranged
in quadrants centered on the tumor region. The resulting flux data for each quadrant and the sum of all quadrants
are plotted against the relative degrees of rotation in Supplemental Fig. 1C, in which dashed lines correspond to
the 90° and 135° images in Supplemental Fig. 1B. In the sum of all quadrants, we observed two distinct peaks of
signal that correspond with the two major lobes. The multi-lobular signal morphology in this tumor revealed the
optimal angle to be 135°, as this is where the signal is most evenly dispersed across the quadrants.
Discussion
BLI is a powerful tool for preclinical cancer models but longitudinal monitoring of distal metastasis by BLI can be
challenging without a standardized means to acquire consistent images between time points. Due to the scatter-
ing effects of light in tissue, bioluminescent and fluorescent signal intensity can vary significantly due to animal
positioning. Therefore, collecting data from multiple vantage points far more accurately defines optical sources
within an animal. Ultimately, this positional bias can often produce diffuse bioluminescent signal measurements
that necessitate increased animal numbers to achieve power in a given study.
The concept of imaging multiple angles to reconstruct original targets is not novel; indeed, this is the rationale
underpinning imaging modalities, such as fluorescence molecular tomography (FMT), which can 3D-localize
fluorescent reporters26–28. By contrast, diffuse light imaging tomography (DLIT; PerkinElmer Inc.), which
acquires luminescence at different wavelengths, uses a sequence of filter sets to approximate depth within a
pseudo-3D space29. One significant difference between FMT and DLIT for detection of distal sites of metastases
in pre-clinical models is that there is greater interference from tissue at standard BLI wavelengths as compared
to more near-infrared FMT wavelengths. To rectify this recent advances in bioluminescence tomography (BLT)
have also been explored using a gantry-type rotating scaffold and multiple cameras that move around a static
animal holder30. Multi-detector BLI systems have been engineered to simultaneously image from multiple angles
and attempts to reconstruct those images to develop true BLT datasets. Those systems are custom builds and not
readily available to other academic labs. Other newer imaging systems that have tried to overcome the positional
bias include the InSyTe FLECT (Northridge Tri-Modality Imaging Inc.), which uses a static animal stage and a
48-detector ring that rotates around the stage to collect 360° tomographic optical data. To date, we found no pub-
lished data that employ this technology. Our novel device is designed to bridge this gap and easily fit into many
standard-imaging systems with top-mounted camera configurations making it immediately implementable to
a broad user base. Our findings suggest that datasets collected by actuated rotation of an animal may provide a
fast initial assessment of disease progression and allow for oversampling of a given region in optical tomography
(FMT and BLT) studies, thereby improving the quality of reconstruction images allowing for the detection of
secondary metastasis sites and overall assessment of tumor geometry.
Our MiSpinner system uses a cylindrical polystyrene animal holder that fits snugly around the animal and
is further stabilized by a foam insert that is wrapped around the tail base. This approach results in consistent
positioning across time points in longitudinal studies. Further, this animal holder design minimizes movement
during the rotation process while maintaining a central axis. For the purposes of this study, we imaged only one
mouse at a time; however, there is sufficient space within most top-mounted imaging systems’ field of view for
multiple mice to be imaged simultaneously using this method, thereby increasing the eventual throughput of
small animal imaging using 360° surface mapping of bioluminescent signal.
The results of this study demonstrate that net bioluminescent signal can vary with even relatively minor ani-
mal rotation, and, as a result, we sought to define the maximal BLI signals generated by the tumors in these
SCientifiC RePorts | (2018) 8:3321 | DOI:10.1038/s41598-018-21668-4 5www.nature.com/scientificreports/
animals over time. Figure 3A shows tumor growth progression as assessed by multi-angle BLI at bi-weekly time
points with the optimal angle of rotation shown for each. Close examination of the X-ray data suggests the angle
of maximum flux is consistent during the early stages of tumor progression (weeks 1–5). However, once the tumor
advances in size, the angle with peak luminescent signal alters noticeably. We believe this change is attributable to
increased tumor burden (weeks 7–9). By week 9, the tumor is likely undergoing necrosis that contributes to the
diffuse distribution of optical signal relative to the skeletal landmarks.
With a larger cohort (n = 7), we monitored tumor progression longitudinally using standard BLI and 360°
multi-angle BLI, with volumes monitored by traditional caliper measurements and segmentation from MSOT
scans. We show that MSOT segmented volumes correlated with endpoint ex vivo volumes with a high degree
of significance (Pearson r = 0.9040; p-value of 0.0052), while caliper volumes correlated poorly in comparison
(Pearson r = 0.7642; p-value of 0.0455). Of note, there was an almost 10-fold reduction in the p-value, and for the
caliper measurements, these correlations approached non-significant limits. As a result, we found better correla-
tion of MSOT segmented tumor volumes with either standard or 360° BLI datasets compared to caliper-derived
volumes. Therefore, we adopted MSOT as our primary standard for determining tumor volumes for correlating
measures of bioluminescent signal, secondary to traditional caliper measurements.
As should be expected, we also noticed that both the height and breadth of luminescence signal increased with
tumor growth. These increases made it necessary to also examine the integral of the signal or the area under the
curve (AUC). We found that while the optimal-angle BLI had better correlation with tumor volumes as compared
to standard 2D BLI (Pearson r = 0.8073 and 0.7551 respectively, with p-value < 0.0001 for both), correlations were
further improved using the AUC measures (Pearson r = 0.8108, p-value < 0.0001). While the improved correla-
tion of AUC versus optimal-angle BLI was modest, we believe the AUC measurements may be less prone to error
and may thus provide a more reliable means of assessment. With the paradigm of cancer research shifting towards
orthotopic and metastatic models, multi-angle BLI may be a useful tool for localizing metastasis and assessing
tumor growth and regression in the preclinical setting.
In summary, by incorporating the MiSpinner device we minimized positional bias by standardizing animal
placement during a longitudinal study and demonstrated the ability to resolve and quantify signal from multiple
tumors within the same animal. Developing this device and protocol allowed us to determine the maximum BLI
values for a given tumor at a given time, and thus significantly improved BLI correlation with both caliper and
photo-acoustic measures of tumor volume. Given the broad potential for using the MiSpinner in various currently
available top-mounted single detectors, we believe this advancement has the potential to improve assessment of
tumor growth and therapeutic regression in relevant cancer models, particularly in academic labs.
Materials and Methods
Animals and Tumor Model. All animal procedures were designed in accordance with the Guide for the
Care and Use of Laboratory Animals of the National Institutes of Health and approved by the Institutional Animal
Care and Use Committee of Auburn University under protocols AU-2015-2808 and AU-2012-2144. Xenografts of
luciferase-expressing human prostate cancer cells (PC-3-Luc2 Bioware Ultra, PerkinElmer Inc., Waltham, MA)
or breast cancer cells (MDA-MB-231-Luc2-GFP Bioware Ultra) were established subcutaneously in NCr nude,
6–8 week-old, male or female mice (Taconic Biosciences Inc., Albany, NY), respectively. In brief, cells, cultured
routinely in F-12K medium (Mediatech Inc., Manassas, VA) or DMEM:F12 medium (HyClone Laboratories Inc.,
Logan, UT) and supplemented with 10% (v/v) fetal bovine serum (HyClone Laboratories Inc.), were harvested at
sub-confluence using 0.25% (v/v) trypsin (Mediatech Inc.) and collected as a suspension with complete medium.
Total cells were counted and then were centrifuged at 250 × G for five minutes to pellet the cells. Pelleted cells had
media removed by aspiration and subsequently were resuspended in phenol-free and serum-free F-12K media
to produce a final concentration of 1 × 10⁷ cells per mL. Prior to injection, the cell suspension was mixed (1:1,
v/v) with ice-cold Matrigel (BD Biosciences, San Jose, CA). While providing 1–3% isoflurane gas (Henry-Schein,
Melville, NY) with oxygen to the mice, a 1.0 mL syringe with a 26-gauge needle (BD Biosciences) was used to
implant 200 µL of cell mixture (1 × 10⁶ cells) subcutaneously into the left flank of each mouse. In total, 16 mice
were used for this study. For the multi-tumor mouse study shown in Fig. 2, one female NCR-Nu mouse was
implanted in the left flank with 2 × 10⁶ MDA-MB-231-Luc2-GFP cells (200 uL) and 1 × 10⁶ cells (100 uL) in the
right flank. Cells were prepared using adjusted concentrations and implanted using the procedure outlined above.
MiSpinner Modified Imaging System for Bioluminescence Measurement. The MiSpinner proto-
type is comprised of a stepper motor, remote controller, and an animal holder that is connected to the standard
gas anesthesia system within the imaging chamber. A universal valve actuator (Valco Instruments Company, Inc.,
Houston, Texas) was selected as the motor and controller for 2 reasons: (1) the actuator can precisely control the
degree of rotation between steps as these motors are used normally to switch between valve positions in liquid
chromatography systems and (2) the actuator, unlike other simple stepper motors, had to be durable enough and
impart enough torque to withstand the radial force imparted by the mouse and animal holder. Prior to imaging,
the motor can be programmed to turn a defined number of precise iterations within 360°. The stage connected to
the motor was custom designed using 123D Design v11.2.1 (Autodesk Inc., Mill Valley, CA) and 3D printed. The
animal holder is designed for single use to prevent cross-contamination and consists of a modified polystyrene
50 mL conical tube without obvious markings (Denville Scientific, South Plainfield, NJ). The screw cap of the
conical tube was punched with a centered 8 × 8 mm square hole for attachment to the motor axle. The conical
end of the tube serves as a nose cone, with the end cut open to allow gas exchange. Mice were inserted into the
animal holder with the head oriented toward the conical end and stabilized by a foam cylinder wrapped around
the tail base. The motor and animal holder were placed into the imaging chamber of the IVIS Lumina XRMS
(PerkinElmer Inc.) and connected remotely to the controller and power supply on the outside of the chamber via
SCientifiC RePorts | (2018) 8:3321 | DOI:10.1038/s41598-018-21668-4 6www.nature.com/scientificreports/
data and power cords fed through a light-tight port. Figure 1 shows both the MiSpinner system inside the imaging
chamber of the IVIS Lumina XRMS and the controller outside the chamber.
Tumor Volume Determination from Digital Caliper Measurements. Tumor growth was assessed
three times per week using digital caliper measurements of tumor x/y dimensions. Prior to imaging sessions,
mice received anesthesia using 1–3% isoflurane gas with medical-grade oxygen while three independent review-
ers measured tumor dimensions to determine a mean volume as a basis for correlation. Volumes were calculated
using a standard formula derived from the volume of an ellipsoid,
Caliper Tumor Volume = (π /6) • (larger diameter Y ) • (smaller diameter )2 (1)
Humane endpoints were defined as tumors that approached or exceeded 1500 mm . Otherwise, tumors were
3
monitored for 9 weeks before mice were euthanized. Tumors were resected and then measured relative to three
axial dimensions of diameter, and volumes were calculated using
Volume = (π /6) • (diameter X ) • (diameter Y ) • (diameter Z ) (2)
MSOT Acquisition and In Silico Tumor Volume Determination. Prior to imaging, all mice were
anaesthetized with 1–3% isoflurane and medical-grade oxygen. MSOT imaging was performed using the InVision
256-TF and ViewMSOT v3.6.0.119 (iThera Medical GmbH, Munich, GE)31. Briefly, a tunable optical parametric
oscillator (OPO) pumped by an Nd:YAG laser provides excitation pulses for 9 ns at wavelengths of 715–850 nm at
a repetition rate of 10 Hz with a wavelength tuning speed of 10 ms and a peak pulse energy of 100 mJ at 730 nm.
Ten arms of a fiber bundle provided even illumination around the subject with a relative bandwidth of 8 mm. Our
MSOT version has 256-transducers, with a center frequency of 5 MHz (60% bandwidth), organized in a concave
array of 270-degree angular coverage and a 4 cm curvature radius. The in-plane resolution is dependent on the
distance from the center of rotation and varies from 150 μm in the center to 550 μm at a distance of 1 cm. The
minimally achievable slice thickness is 800 μm and the physical slice thickness is approximately 800 μm according
to the focal zone of the ultrasound detector. By oversampling the slice thickness, image quality can be improved
for optimal 3D reconstruction. For the purposes of this study, scans were performed using a 0.5 mm slice separa-
tion spanning the entire tumor region for each mouse, allowing oversampling of approximately 0.3 mm to ensure
adequate reconstructed image quality. A tunable laser provides excitation light at 715, 730, 760, 800, and 850 nm.
Wavelengths were selected to differentially evaluate the contributions of endogenous chromophores to the overall
photo-acoustic signal with 850 nm as an anatomical reference. Photo-acoustic signals from chromophores par-
allels their absorbance spectra. The relative contribution of different chromophores to the overall photo-acoustic
signal can be evaluated by linear un-mixing of datasets from specific excitation compared to the absorbance
spectra of the chromophores. At these standard settings, the MSOT can separate oxygenated from deoxygen-
ated hemoglobin. This is possible due to the broad singular absorbance peak of the deoxygenated hemoglobin
compared to bifurcated peak of oxygenated hemoglobin causing distinctly different absorbance values over 650–
750 nm for these endogenous chromophores.
Slices from each scan were exported from ViewMSOT (iThera Medical GmbH) to ImageJ v2.0.0-rc-15/1.49 h
(https://imagej.nih.gov/ij) and then exported as a stack of TIFF images. Tumor segmentation and in silico volume
determinations (Fig. 3B) were performed using 3D Slicer v4.5.0 (https://www.slicer.org) with the Editor, Models,
and Volume Rendering tools, respectively. In brief, TIFF stacks of each MSOT scan were loaded into 3D Slicer and
image spacing was set to the acquired dimensions of 0.075 mm × 0.075 mm × 0.5 mm. Under the Editor mod-
ule, a “new structure” was added and the “paintbrush” tool was used to define the margins of the tumor in each
slice. Once complete, the “merge and build” function was used to reconstruct the segmented volume. The Model
module was used to calculate in silico volumes by multiplying the surface area of each segmented slice by the slice
distance over the whole of each dataset. The Volume Rendering tool was used to overlay the segmented tumor
volumes created in the Model module over a back-projection of each corresponding TIFF stack dataset.
Multi-Angle BLI of Mouse Bearing Multiple Tumors. One female mouse was implanted with 2 × 10⁶
MDA-MB-231-Luc2-GFP cells in the left flank and 1 × 10⁶ cells in the right flank to simulate primary and met-
astatic tumor growth. This mouse was imaged for bioluminescence at 4 weeks following implantation using
9° intervals around 360°, shown in in Fig. 2A (18° intervals are shown). The mouse was anaesthetized with
medical-grade oxygen supplemented with 1–3% isoflurane and then injected intraperitoneally (IP) with 500 μL
of 30 mg/mL D-luciferin (600 mgs/kg dose for a standard 25-gram mouse; PerkinElmer Inc., Waltham, MA) and
allowed to distribute for 20 minutes prior to imaging. Bioluminescent images were acquired using 3-second expo-
sures and overlaid on corresponding photographs. All images were loaded in Living Image as a batch sequence
for simultaneous thresholding of luminescent signal in each acquired image. ROI were measured by the rate of
photons reaching the CCD (flux), determined using static rectangular ROI (9 × 4 cm) placed in the exact location
around the animal across all rotation degrees. Bioluminescent flux from each ROI was plotted against the relative
degrees of rotation for each respective dataset, shown in Fig. 2C. Images with peak bioluminescent flux for each
respective tumor are shown in Fig. 2B and denoted by dashed lines in Fig. 2C.
Longitudinal Multi-Angle In Vivo BLI. Prior to each imaging session, three mice were chosen for a kinetic
assay to determine the enzyme saturation time point, i.e. the optimal imaging window during which luciferases
are saturated with luciferin, as evidenced by a plateau in luminescent signal. Mice were anaesthetized with
medical-grade oxygen supplemented with 1–3% isoflurane and then injected intraperitoneally (IP) with 500 μL
of 30 mg/mL D-luciferin (600 mgs/kg dose for a standard 25-gram mouse; PerkinElmer Inc., Waltham, MA).
SCientifiC RePorts | (2018) 8:3321 | DOI:10.1038/s41598-018-21668-4 7www.nature.com/scientificreports/
Kinetic assays were performed with standard bioluminescence images acquired every 30 seconds for a period
of 45 minutes. The following day, mice were injected IP with 500 μL of 30 mg/mL D-luciferin. Standard BLI was
performed at the beginning of the saturation point and immediately followed by 360° BLI using the MiSpinner
with 15° intervals (24 images total). Exposure time varied from 1–5 seconds (depending on total counts) with
small binning and subject height set to 4.0 cm. The data automatically converted into calibrated radiance by Living
Image for standardization and comparison.
Additionally, once per week throughout the 9-week time course, a single mouse was selected for BLI with
X-ray performed at precise 7.5° turns (48 images) around 360°; the results are shown in Fig. 3A. X-ray was
acquired using the high-resolution setting, 5-second exposure per image, and the scintillator swing-arm posi-
tioned to “large animal” to accommodate the MiSpinner system. The total radiation dose was 1–3mGy per X-ray
image with the total exposure of 48–144 mGy per session, a level that encompasses the standard single CT dose of
120 mGy32–34. This exposure is assumed not to alter tumor progression as chromosomal aberrations in mammals
have been reported only at 250–300 mGy. The exposure level is also well below the lethal single dose of X-ray
radiation for a mouse; 50% of animals survive a lethal dose of 26,800 mGy (n = 28)35.
360° Bioluminescent Image Processing and Statistical Analysis. Following acquisition, all images
in each multi-angle dataset were loaded in Living Image as a batch sequence for simultaneous thresholding of
luminescent signal in each acquired image. ROI were measured by the rate of photons reaching the CCD (flux),
determined using static rectangular ROI (9 × 4 cm) placed in the exact location around the animal across all
rotation degrees and time points. Bioluminescent flux from each ROI was plotted against the relative degrees
of rotation for each respective dataset. AUC and optimal BLI angle were determined for each dataset using the
“area-under-the-curve” and “column statistics” functions in Prism 6 (GraphPad Software Inc., La Jolla, CA).
Correlations among caliper-determined tumor volumes, MSOT in silico-determined tumor volumes, AUC, opti-
mal Angle BLI, and standard BLI were assessed using parametric Pearson correlation in Prism 6. All p-values
listed are two-tailed with alpha equal to 0.05. A solid black line for each respective correlation plot denotes a linear fit
model. Ex vivo red circles indicate volumes, and the respective linear fits are shown by dashed red lines. Six mice
with implanted tumors that failed to grow beyond a 700 mm3 threshold after 9 weeks were excluded from this
study. Also excluded was a mouse possessing a highly irregular tumor morphology and a mouse that died shortly
after the implantation procedure.
Analysis of a Multi-Lobular Tumor Signal Using Multi-Angle BLI. During preliminary studies, a
mouse with a multi-lobular PC-3-Luc2 tumor was selected for multi-angle BLI to assess differences in signal
detected at different angles at a single point in time. BLI was performed at precise 7.5° intervals around 360° (48
images total). In Supplemental Fig. 1, square ROI of equal quadrants were centered on the tumor region. The
photon flux for each individual quadrant and the sum of all quadrants at each orientation were plotted against
their respective degrees of rotation.
Video Production. Video files (Supplemental Figures) were compiled by loading all images from each 360°
dataset into a sequence and equalizing the parameters and scale across all frames using Living Image v4.4.17106
(PerkinElmer Inc.). All frames were exported from Living Image as TIFF files. Next, images were loaded into
Adobe Photoshop CS6 (v13.0.6) as sequential image files (via File-Scripts-Load Files into Stack), cropped,
arranged, and exported as “.mov” files.
References
1. Tomayko, M. M. & Reynolds, C. P. Determination of subcutaneous tumor size in athymic (nude) mice. Cancer Chemother Pharmacol
24, 148–154 (1989).
2. Euhus, D. M., Hudd, C., LaRegina, M. C. & Johnson, F. E. Tumor measurement in the nude mouse. J Surg Oncol 31, 229–234 (1986).
3. Ayers, G. D. et al. Volume of preclinical xenograft tumors is more accurately assessed by ultrasound imaging than manual caliper
measurements. J Ultrasound Med 29, 891–901 (2010).
4. Jensen, M. M., Jorgensen, J. T., Binderup, T. & Kjaer, A. Tumor volume in subcutaneous mouse xenografts measured by microCT is
more accurate and reproducible than determined by 18F-FDG-microPET or external caliper. BMC Med Imaging 8, 16, https://doi.
org/10.1186/1471-2342-8-16 (2008).
5. Puaux, A. L. et al. A comparison of imaging techniques to monitor tumor growth and cancer progression in living animals. Int J Mol
Imaging 2011, 321538, https://doi.org/10.1155/2011/321538 (2011).
6. Mazurchuk, R., Glaves, D. & Raghavan, D. Magnetic resonance imaging of response to chemotherapy in orthotopic xenografts of
human bladder cancer. Clin Cancer Res 3, 1635–1641 (1997).
7. Sandhu, G. S. et al. Whole animal imaging. Wiley Interdiscip Rev Syst Biol Med 2, 398–421, https://doi.org/10.1002/wsbm.71 (2010).
8. Bouchard, R., Sahin, O. & Emelianov, S. Ultrasound-guided photoacoustic imaging: current state and future development. IEEE
Trans Ultrason Ferroelectr Freq Control 61, 450–466, https://doi.org/10.1109/TUFFC.2014.2930 (2014).
9. Razansky, D., Buehler, A. & Ntziachristos, V. Volumetric real-time multispectral optoacoustic tomography of biomarkers. Nat Protoc
6, 1121–1129, https://doi.org/10.1038/nprot.2011.351 (2011).
10. Klerk, C. P. et al. Validity of bioluminescence measurements for noninvasive in vivo imaging of tumor load in small animals.
Biotechniques 43(7–13), 30 (2007).
11. Maniotis, A. J. et al. Vascular channel formation by human melanoma cells in vivo and in vitro: vasculogenic mimicry. Am J Pathol
155, 739–752, https://doi.org/10.1016/S0002-9440(10)65173-5 (1999).
12. Seftor, R. E. et al. Tumor cell vasculogenic mimicry: from controversy to therapeutic promise. Am J Pathol 181, 1115–1125, https://
doi.org/10.1016/j.ajpath.2012.07.013 (2012).
13. Keyaerts, M., Caveliers, V. & Lahoutte, T. Bioluminescence imaging: looking beyond the light. Trends Mol Med 18, 164–172, https://
doi.org/10.1016/j.molmed.2012.01.005 (2012).
14. Jacques, S. L. Optical properties of biological tissues: a review. Phys Med Biol 58, R37–61, https://doi.org/10.1088/0031-9155/58/11/
R37 (2013).
15. Slavine, N. V. & McColl, R. W. Semi-automated Image Processing for Preclinical Bioluminescent Imaging. J Appl Bioinforma Comput
Biol 4, https://doi.org/10.4172/2329-9533.1000114 (2015).
16. Wang, G. et al. In vivo mouse studies with bioluminescence tomography. Opt Express 14, 7801–7809 (2006).
SCientifiC RePorts | (2018) 8:3321 | DOI:10.1038/s41598-018-21668-4 8www.nature.com/scientificreports/
17. Dehghani, H. et al. Spectrally resolved bioluminescence optical tomography. Opt Lett 31, 365–367 (2006).
18. Gu, X., Zhang, Q., Larcom, L. & Jiang, H. Three-dimensional bioluminescence tomography with model-based reconstruction. Opt
Express 12, 3996–4000 (2004).
19. Kumar, D., Cong, W. X. & Wang, G. Monte Carlo method for bioluminescence tomography. Indian J Exp Biol 45, 58–63 (2007).
20. Slavine, N. V., Lewis, M. A., Richer, E. & Antich, P. P. Iterative reconstruction method for light emitting sources based on the
diffusion equation. Med Phys 33, 61–68, https://doi.org/10.1118/1.2138007 (2006).
21. Cong, W., Durairaj, K., Wang, L. V. & Wang, G. A born-type approximation method for bioluminescence tomography. Med Phys 33,
679–686, https://doi.org/10.1118/1.2168293 (2006).
22. Chaudhari, A. J. et al. Hyperspectral and multispectral bioluminescence optical tomography for small animal imaging. Phys Med
Biol 50, 5421–5441, https://doi.org/10.1088/0031-9155/50/23/001 (2005).
23. Feng, J. et al. An adaptive regularization parameter choice strategy for multispectral bioluminescence tomography. Med Phys 38,
5933–5944, https://doi.org/10.1118/1.3635221 (2011).
24. Guo, H. et al. A hybrid clustering algorithm for multiple-source resolving in bioluminescence tomography. J Biophotonics. https://
doi.org/10.1002/jbio.201700056 (2017).
25. Yan, H., Lin, Y., Barber, W. C., Unlu, M. B. & Gulsen, G. A gantry-based tri-modality system for bioluminescence tomography. Rev
Sci Instrum 83, 043708, https://doi.org/10.1063/1.3698295 (2012).
26. Panizzi, P. et al. Impaired infarct healing in atherosclerotic mice with Ly-6C(hi) monocytosis. J Am Coll Cardiol 55, 1629–1638,
https://doi.org/10.1016/j.jacc.2009.08.089 (2010).
27. Ntziachristos, V., Bremer, C. & Weissleder, R. Fluorescence imaging with near-infrared light: new technological advances that enable
in vivo molecular imaging. Eur Radiol 13, 195–208, https://doi.org/10.1007/s00330-002-1524-x (2003).
28. Vinegoni, C. et al. Imaging of molecular probe activity with Born-normalized fluorescence optical projection tomography. Opt Lett
35, 1088–1090, https://doi.org/10.1364/OL.35.001088 (2010).
29. Kuo, C., Coquoz, O., Troy, T. L., Xu, H. & Rice, B. W. Three-dimensional reconstruction of in vivo bioluminescent sources based on
multispectral imaging. J Biomed Opt 12, 024007, https://doi.org/10.1117/1.2717898 (2007).
30. Lewis, M. A. et al. A Multi-Camera System for Bioluminescence Tomography in PreclinicalOncology Research. Diagnostics (Basel)
3, 325–343, https://doi.org/10.3390/diagnostics3030325 (2013).
31. Morscher, S., Driessen, W. H., Claussen, J. & Burton, N. C. Semi-quantitative Multispectral Optoacoustic Tomography (MSOT) for
volumetric PK imaging of gastric emptying. Photoacoustics 2, 103–110, https://doi.org/10.1016/j.pacs.2014.06.001 (2014).
32. Luchnik, N. V. & Sevankaev, A. V. Radiation-induced chromosomal aberrations in human lymphocytes. I. Dependence on the dose
of gamma-rays and an anomaly at low doses. Mutat Res 36, 363–378 (1976).
33. Miyahara, N. et al. Evaluation of X-ray doses and their corresponding biological effects on experimental animals in cone-beam
micro-CT scans (R-mCT2). Radiol Phys Technol 9, 60–68, https://doi.org/10.1007/s12194-015-0334-1 (2016).
34. Takahashi, E. I., Tsuji, H., Shiomi, T., Sato, K. & Tobari, I. Characteristics of gamma-ray-induced chromosomal aberrations in
mutagen-sensitive mutants of L5178Y cells. Mutat Res 106, 225–236 (1982).
35. Phillips, T. L. & Ross, G. Time-dose relationships in the mouse esophagus. Radiology 113, 435–440, https://doi.org/10.1148/113.2.435
(1974).
Acknowledgements
This work was supported, in part, by grants from the National Institute of Health (R01 HL114477-01A1 (to P.P.
and M.N.) and R01 EB016100-01 (to R.A.) and an Auburn Research Initiative in Cancer - Graduate Student
fellowship (to ADB). We would like to thank Mary Smith for help in acquiring some of the datasets and
performing some early segmentation analysis in 3D slicer. We would also like to also thank Dr. Stan Reeves and
Huanyi Zhou for helpful discussion related to the paper and data analysis.
Author Contributions
A.D.B. developed MiSpinner prototypes, performed all animal experiments and imaging, analyzed data,
created videos, and wrote the manuscript. M.E. performed cell culture, tumor implantation, tumor size caliper
measurements, and data analysis. M.N. contributed expertise to data analysis and wrote the manuscript. R.A.
contributed to experimental design of animal trials and provided expertise in modeling the various cancers in
these study. P.P. was the primary investigator for this project, conceived the initial idea for the MiSpinner system,
contributed to prototype design and development, assisted with data analysis, and wrote the manuscript.
Additional Information
Supplementary information accompanies this paper at https://doi.org/10.1038/s41598-018-21668-4.
Competing Interests: The authors declare no competing interests.
Publisher's note: Springer Nature remains neutral with regard to jurisdictional claims in published maps and
institutional affiliations.
Open Access This article is licensed under a Creative Commons Attribution 4.0 International
License, which permits use, sharing, adaptation, distribution and reproduction in any medium or
format, as long as you give appropriate credit to the original author(s) and the source, provide a link to the Cre-
ative Commons license, and indicate if changes were made. The images or other third party material in this
article are included in the article’s Creative Commons license, unless indicated otherwise in a credit line to the
material. If material is not included in the article’s Creative Commons license and your intended use is not per-
mitted by statutory regulation or exceeds the permitted use, you will need to obtain permission directly from the
copyright holder. To view a copy of this license, visit http://creativecommons.org/licenses/by/4.0/.
© The Author(s) 2018
SCientifiC RePorts | (2018) 8:3321 | DOI:10.1038/s41598-018-21668-4 9You can also read