Long-term dynamics of stand structure and regeneration in high-stocked selection fir-beech forest stand: Croatian Dinarides case study
←
→
Page content transcription
If your browser does not render page correctly, please read the page content below
iForest                                                                                                     Research Article
                                                                                                          doi: 10.3832/ifor3638-014
                                                                                                                vol. 14, pp. 383-392
         Biogeosciences and Forestry

Long-term dynamics of stand structure and regeneration in high-stocked
selection fir-beech forest stand: Croatian Dinarides case study

Jura Čavlović,                                    In recent decades, changes in stand structure in Central European fir-beech
                                                  forests, such as accumulation of large-diameter firs, fir dieback, and poor re-
Krunoslav Teslak,                                 generation, have been well documented. Besides environmental factors, light
Karlo Beljan,                                     harvesting was suggested as one of the main drivers of the negative structural
Mislav Vedriš,                                    dynamics of these forests in Croatia. This study applied the MOSES 3.0 stand
Marijana Andabaka                                 simulator on permanent sample plot data to reconstruct stand development
                                                  over the past 20 years and simulate long-term projections of selection stand
                                                  structure and regeneration with respect to theoretical values, using three
                                                  management regimes differing by the applied harvesting intensity (tradition-
                                                  ally applied, theoretical intensity, and no management). Sample plot data from
                                                  three sets of detailed measurements (1992, 2002, and 2012) were used for
                                                  validation of the simulator, and eleven 10-year cycles of management were
                                                  then simulated under the above management scenarios. Results showed a pos-
                                                  itive influence of harvest intensity on stand regeneration and the achievement
                                                  of a targeted selection structure in the long term. Two management scenarios
                                                  predicted a decrease in stand volume (34% and 40%, respectively), an increase
                                                  in the initial percentage (28%) of beech and maple (58% and 75%, respec-
                                                  tively), and the achievement of optimal stand regeneration of 11-13 recruited
                                                  trees per hectare annually (60% firs). No management scenario could achieve
                                                  old-growth structure (accumulation of standing stock, large trees, and dead-
                                                  wood). The theoretical intensity scenario was evaluated as the better ap-
                                                  proach to be applied in this type of forest stands in Croatia.

                                                  Keywords: Selection Harvest, Stand Growth Simulator, Development of DBH
                                                  Distribution, Tree Species Composition, Natural Regeneration, Old-growth
                                                  Structure

Introduction                                      the past to the Dinaric beech-fir mixed          proach” (Klepac 1961, Čavlović et al. 2006),
  Uneven-aged forest management, often            forests, which still cover 12% of total forest   characterized by 10-year harvesting cycles,
considered as a “close-to-nature” manage-         area in Croatia, according to the last na-       each removing up to 25% of standing vol-
ment system, has high importance world-           tional forest inventory (CRONFI – Čavlović       ume. The so-called “BDq approach”, which
wide (Emmingham 2002, O’Hara et al.               et al. 2016).                                    has its roots in the work of Meyer (1943),
2007). The selection system, a type of un-          Although the selection management sys-         was a common approach for stocking con-
even-aged forest management, plays a sig-         tem is known in Croatia since more than a        trol, where “B” represents the basal area,
nificant role in Central European forestry        century, it was re-introduced in fir-beech       “D” the maximum target diameter class,
(Bončina 2011) and it has proven to be suit-      forests (Abieti-Fagetum) after the World         and “q” the exponent of the decline func-
able for Dinaric fir-beech forests as well        War II (Klepac 1961, O’Hara et al. 2018). At     tion. Achievement or maintenance of a tar-
(Bončina et al. 2002, Čavlović et al. 2006,       that time, Croatian forests were character-      get (reverse-J) diameter distribution is
Bončina 2011), especially because it natu-        ized by irregular (transitional) stand struc-    based on the BDq approach (O’Hara & Ger-
rally establishes a selection stand structure     tures caused by changes in economic, so-         sonde 2014). However, the stated manage-
(Diaci et al. 2011). Moreover, the selection      cial, and ownership conditions (Bozić            ment principles were applied inconsis-
forest management has a long tradition,           1999). Accordingly, a management system          tently, especially regarding low harvesting
dating back to the Austro-Hungarian pe-           was established by defining a theoretical        intensities, because an actual rate of cur-
riod, and in particular it had been applied in    (target) stand structure using the “BDq ap-      rent volume increment was used instead of
                                                                                                   a theoretical rate. In such mixed silver fir
   Department of Forest Inventory and Management, University of Zagreb, Faculty of                 (Abies alba Mill., hereafter fir) and Euro-
Forestry and Wood Technology, Zagreb (Croatia)                                                     pean beech (Fagus sylvatica L., hereafter
                                                                                                   beech) stands characterized by irregular
@ Krunoslav Teslak (krunoteslak@gmail.com)                                                         structures, a high proportion of large-diam-
                                                                                                   eter trees, and a low rate of current vol-
Received: Aug 31, 2020 - Accepted: Jul 02, 2021                                                    ume increment, the commonly applied har-
                                                                                                   vesting intensity was 17% or less, which nei-
Citation: Čavlović J, Teslak K, Beljan K, Vedriš M, Andabaka M (2021). Long-term dynamics of       ther provided enough canopy openings nor
stand structure and regeneration in high-stocked selection fir-beech forest stand: Croatian        promoted stand regeneration. Therefore,
Dinarides case study. iForest 14: 383-392. – doi: 10.3832/ifor3638-014 [online 2021-08-24]         according to the General Forest Manage-
                                                                                                   ment Plan in Dinaric fir-beech forests from
Communicated by: Emanuele Lingua                                                                   1996 to 2005, an average harvesting inten-
                                                                                                   sity of only 14% was prescribed.

© SISEF https://iforest.sisef.org/                                     383                                                iForest 14: 383-392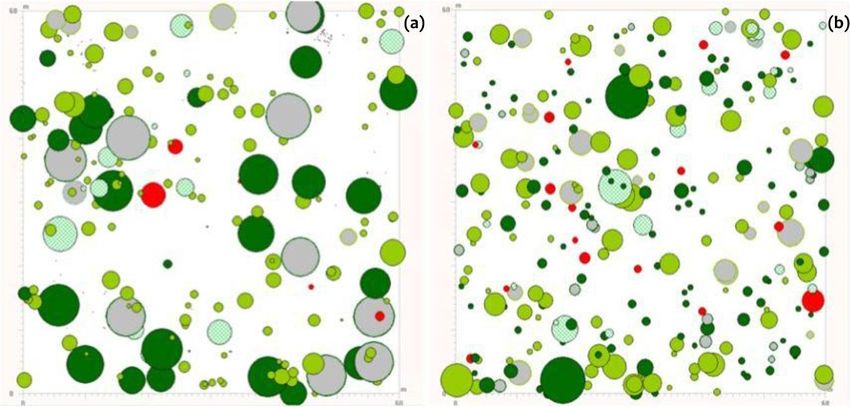
Cavlović J et al. - iForest 14: 383-392

                                          In recent decades, several trends in the           In this study, we collected data from a       tailed measurements and assessments in-
iForest – Biogeosciences and Forestry

                                        stand structure development of fir-beech           permanent sample plot in a mixed fir-           cluded trees with diameter at breast height
                                        forests have been observed in Croatia (Čav-        beech stand in the Croatian Dinarides rep-      (DBH) ≥ 10 cm (numbering and tagging,
                                        lović et al. 2006) and in other Central Euro-      resenting the stand structure and dynam-        tree species, diameter at breast height,
                                        pean countries (Bončina et al. 2014, Ficko         ics described above. The MOSES ver. 3.0         tree height, height of crown base, tree po-
                                        et al. 2011). These changes in stand struc-        stand simulator (Hasenauer et al. 2006)         sition in local coordinate system, tree vital-
                                        ture can be summarized as follows: (i) in-         was used to simulate stand dynamics in a        ity). Diameter at breast height was mea-
                                        crease of total standing stock; (ii) growing       selection fir-beech forest stand. The objec-    sured for saplings and young trees (DBH
                                        stock accumulation, predominantly of               tive was to explore the influences of differ-   0.1 to 10 cm), whereas seedlings were
                                        large and low-vitality fir trees; (iii) fir die-   ent selection harvesting intensities on         counted into two height classes: small (0.1
                                        back; (iv) poor or non-existent fir regenera-      stand structure and regeneration in the         to 0.5 m) and tall seedlings (0.51 to 1.3 m).
                                        tion; and (v) an increasing share of beech         long run. Our starting hypotheses were: (i)     All cut trees and their year of harvest were
                                        and maple (Acer pseudoplatanus L.).                the MOSES 3.0 stand simulator can accu-         recorded using data from previous inven-
                                          The increase in total standing stock and         rately simulate fir-beech forest stand dy-      tory, tree position, and assessment of
                                        the growing stock accumulation of large            namics in the Croatian Dinarides; (ii) higher   stumps. The obtained stand characteristics
                                        and low-vitality firs can be mostly attrib-        levels of selection harvesting and canopy       and trends (Tab. 1) were used to analyze
                                        uted to low-intensity management activi-           openings will lead to the achievement of        the past development of stand structure
                                        ties, whereas climate change and air pollu-        the targeted selection stand structure over     for validation of the stand simulator, and
                                        tion are thought to be the main causes of          the long term; (iii) a more intensive selec-    to simulate future stand structure (initial
                                        fir dieback (Linares & Camarero 2012). Fur-        tion management will positively affect          state 2012 inventory).
                                        thermore, poor fir regeneration is of spe-         stand regeneration dynamics and eco-
                                        cial concern (Čavlović et al. 2006, Rozen-         nomic efficiency.                               Data analysis
                                        bergar et al. 2007). In general, environmen-                                                         According to data from the first national
                                        tal factors are considered as the main driv-       Material and methods                            forest inventory in the Republic of Croatia
                                        ers of fir regeneration dynamics (Safar                                                            (CRONFI – Čavlović et al. 2016), there is a
                                        1965, Dobrowolska & Bolibok 2019). How-            Study site                                      significant number of well-stocked selec-
                                        ever, stand structure and canopy openings            This study was carried out in the Delnice     tion fir-beech stands in the Gorski kotar re-
                                        should also be taken in consideration as in-       Management Unit (MU) located on a mildly        gion. They are characterized by overstock-
                                        fluential factors. Čavlović et al. (2006), in a    sloping mountain range in the Gorski kotar      ing with a large portion of large tree diam-
                                        study of Dinaric fir-beech forest character-       region (Western Croatia). The MU is repre-      eter class (DBH > 50 cm) and poor stand re-
                                        ized by unbalanced stand structures, re-           sentative of a typical selection fir-beech      generation, especially of firs, on approxi-
                                        ported a significant negative correlation          mountain forest (Abieti-Fagetum). Inven-        mately one-fourth of the forest area (Tab.
                                        between abundance of fir regeneration              tory data from a permanent sample plot          S1 in Supplementary material), because of
                                        and large-tree basal area (DBH > 50 cm).           (60 × 60 m) were used. The plot is situated     low selection harvests carried out in the
                                        Similar stand dynamics were also recorded          within the MU (45° 23′ 10″ N, 14° 46′ 05″ E;    past few decades (Čavlović et al. 2006).
                                        in the entire Dinaric region (Bončina 2011,        elevation 700 m a.s.l.) oriented in a south-    The stand structure observed (Tab. 1) was
                                        Bončina et al. 2014).                              easterly direction with an inclination of 20°   assumed to be appropriate for simulations
                                          Recently, low harvest intensities in Croat-      to 40° (Fig. S1 in Supplementary material).     and stand structure projections, as it repre-
                                        ian Dinaric fir-beech forests have been ad-          The experimental plot is located on lime-     sents one-fourth of the best-stocked
                                        dressed as a main driver of such stand dy-         stone and dolomite bedrock with moun-           stands of this type in the region.
                                        namics. This assumption led to new regula-         tain chernozem and acid brown soils, and is       In the 2012 inventory, 222 trees with DBH
                                        tions for forest management planning in            representative of a larger area with similar    ≥ 5 cm were recorded in the permanent
                                        Croatia (Regulations for Forest Manage-            vegetation and soil characteristics. The un-    sample plot. Diameter class distribution,
                                        ment Planning 2006). Hence, to trigger             even-aged forests in the Gorski kotar area      basal area, and growing volume per 5-cm
                                        stand regeneration and improve stand               are characterized by irregular diameter         DBH class (as well as three wider diameter
                                        structures in selection fir-beech forests,         structure of selection stands and poor nat-     classes: small, 10 ≤ DBH < 30 cm; medium,
                                        the maximum intensity allowed for 10-year          ural regeneration. Species composition is       30 ≤ DBH < 50 cm; large, DBH ≥ 50 cm)
                                        selection felling was set at 30%.                  dominated by fir (43%) and beech (40%),         were determined for trees with DBH ≥ 10
                                          In this forest type, there is a large part       followed by Norway spruce (Picea abies          cm. The mean height of 16 dominant firs
                                        (up to one-fourth) of high-stocked stands          Karst. – 10%) and maple (6%). More detailed     (one-fifth of the highest firs in the large-di-
                                        where two main management objectives               information about the stand structure and       ameter class, ≥ 50 cm) was 36.2 m, and that
                                        may be set: (i) providing economic benefits        characteristics is reported in Tab. S1 (Sup-    of 15 dominant beech trees (half the high-
                                        from fir-dominated forests by gradually es-        plementary material).                           est beech trees in the 31-50 cm diameter
                                        tablishing an efficient selection stand struc-       The prevalent climate in the area is tem-     class) was 30.7 m. By applying dominant
                                        ture with a growing stock close to or              perate and moist, with a mean annual tem-       heights and the BDq approach, theoretical
                                        slightly above an equilibrium structure (Ha-       perature of 7.6 °C. The mean monthly tem-       (target) reverse-J diameter distributions
                                        newinkel et al. 2014); and (ii) providing a        perature does not exceed 28 °C in the sum-      were determined according to traditional
                                        basis for fulfilling the requirements for          mer. Air humidity is high during the entire     uneven-aged forest management practice
                                        habitat and nature protection (i.e., Natura        year and reaches a maximum in February          in Croatia (Klepac 1961, Čavlović et al.
                                        2000 requirements) by maintaining pro-             (92%). Annual rainfall varies between 1500      2006). Thus, the parameters of the target
                                        cesses that promote an old-growth forest           and 2500 mm, and the snow period lasts          model for the mixed selection fir-beech
                                        structure (Bauhus et al. 2009, Pirovano &          188 days, on average. Data were provided        stand with 80% and 20% of the total grow-
                                        Zecca 2014). The influence of different            by the Cabar-Parg weather station (45.6° N,     ing volume (GV = 403.0 m3 ha-1 at half cy-
                                        management regimes (managed, non-man-              14.63° E; 863 m a.s.l.) where meteorological    cle), were determined using the theoretical
                                        aged) and approaches (i.e., the tradition-         records are collected since 1943.               distribution of fir, which was defined by q =
                                        ally applied lower-intensity approach vs. a                                                        1.30, Dmax (maximum tree diameter) = 70
                                        moderate-intensity theoretical approach)           Data collection                                 cm, BA (basal area) = 35.1 × 0.80 = 28.1 m2
                                        on long-term stand dynamics could be sim-            The permanent sample plot was estab-          ha-1, and that of beech, defined by q = 1.45,
                                        ulated on previously monitored permanent           lished in 1992 and inventoried every 10         Dmax = 50 cm, BA = 22.4 × 0.20 = 4.5 m2 ha-1,
                                        sample plots representing such a high-             years (first in 1992, and subsequently in       with total BA = 32.6 m2 ha-1.
                                        stocked stand structure.                           2002 and 2012) after selective felling. De-       The MOSES 3.0 stand growth simulator

                                        384                                                                                                                        iForest 14: 383-392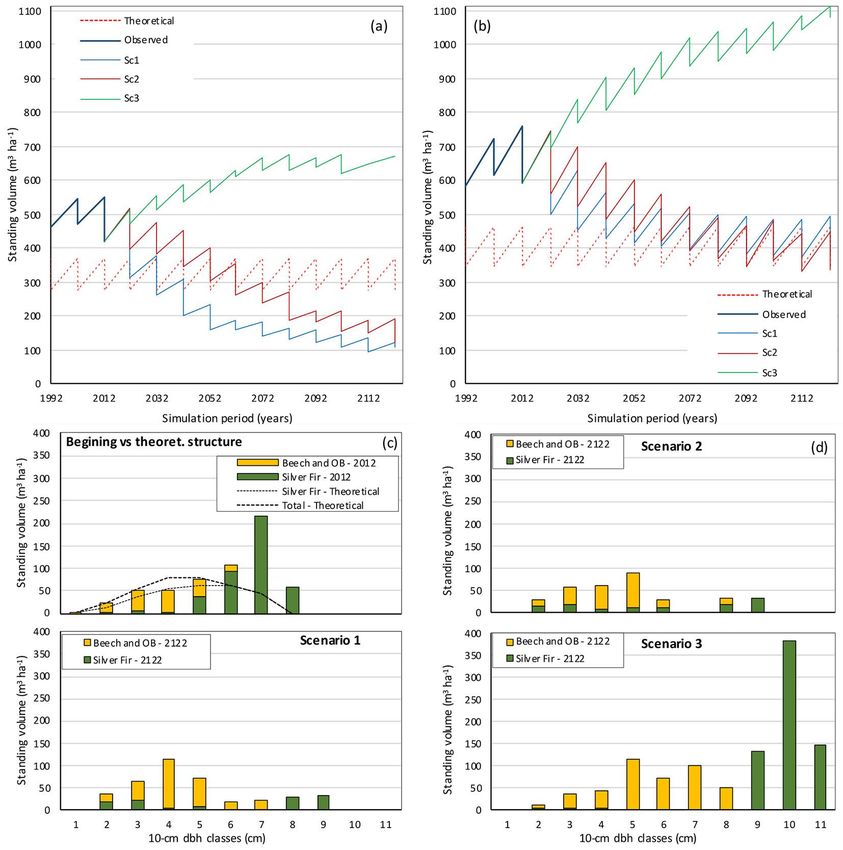
Stand structure and regeneration in a fir-beech forest stand
(Hasenauer et al. 2006) was used to simu- observed and simulated volumes, it was as- tual total standing volume before harvest
iForest – Biogeosciences and Forestry
late selection stand structure develop- sumed that the simulation of future stand (m3 ha-1), GVtheor is the theoretical total
ment. This software had been previously development would perform in a similar growing volume before cut (m3 ha-1) based
used for growth modeling (including mor- and consistent way also for comparison of on the developed BDq model (see above), l
tality probabilities) of fir-beech stands in different future scenarios. is the length of the harvest cycle (10 years),
Croatia (Mikac et al. 2013). The simulator Besides stand regeneration (tree recruit- and p is the rate (%) of current annual vol-
was adapted to the local volume equations ment), tree increment, and mortality, the ume increment; instead of a theoretical
according to Spiranec (1976). Validation amount of harvest and its distribution value, an actual rate has traditionally been
was performed by comparing the simu- among diameter classes were considered applied, leading to low harvest intensities.
lated standing volumes with the inventory as main drivers affecting selection stand The scenario was chosen because this ap-
data. The year 1992 was taken as the base structure and development. Harvesting proach has been used for operational for-
year, and comparison of standing volumes changes the diameter structure and conse- est management and planning of selection
was made after 10 years (2002) and subse- quently the pattern of tree growth and re- fir-beech forests during the last 70 years.
quently after 20 years (2012). A paired t- generation. Hence, three management sce-
test (α = 0.05) was applied to test for dif- narios were developed using different ap- Scenario 2
ferences in standing volume (ΔV) between proaches to prescribe harvest volume. As an alternative to the reference sce-
the observed (inventory) and simulated nario, the Hundeshagen formula was cho-
data, with the following outcome: fir (1992- Scenario 1 sen as a method for estimating sustainable
2002: ΔV = 2.14 m3 ha-1, p = 0.1671; 1992- The reference scenario (Scenario 1) was harvests (Bettinger et al. 2009). According
2012: ΔV = 2.71 m3 ha-1, p = 0.4204), beech based on the common approach of pre- to the method, continuous application of
(1992-2002: ΔV = 1.03 m3 ha-1, p = 0.1211; scribing a harvest volume (eqn. 1): the theoretical rate of current annual vol-
1992-2012: ΔV = 2.07 m3 ha-1, p = 0.11187), ume increment on actual standing volume
( )
1 SV act
and total ΔV (1992-2002: ΔV = 0.29 m3 ha-1, p HA sc 1 =SV act⋅ 1− ⋅ (1) would lead to achieve the theoretical (i.e.,
1.0 pl GV theor
= 0.928; 1992-2012: ΔV = 2.08 m3 ha-1, p = desired) growing volume with a balanced
0.5815). According to the small and non- where HAsc1 is the harvest amount accord- structure over the long term. Hence, Sce-
significant differences obtained between ing to Scenario 1 (m 3 10-yr-1), SVact is the ac- nario 2 is based on a theoretical harvest in-
Tab. 1 - Observed data of stand structure and harvest by diameter classes (10-30 cm, 31-50 cm, >50 cm of DBH) and structure of
stand regeneration, according to tree species and inventories (years 1992, 2002 and 2012). Stand structure values refer to state
before harvest, for 2002 and 2012 inventories values in brackets refer to harvest amounts in each DBH class. (N): number of trees;
(BA): basal area; (SV): standing volume; (DBH): average diameter at breast height; (Ss): small seedlings (height ≤ 0.50 m); (Ts): tall
seedlings (0.51-1.30 m); (Sap): saplings (0.1-5.0 cm of DBH); (Yt): young trees (5.1-10.0 cm of DBH); (na): not available.
Year 1992 Year 2002 Year 2012
Species
Parameter 10-30 31-50 >50 10-30 31-50 >50 10-30 31-50 >50
Total Total Total
cm cm cm cm cm cm cm cm cm
-1
N (ha ) 25 36 78 139 26 (6) 22 (0) 92 (11) 140 (17) 23 (6) 22 (3) 81 (14) 126 (22)
BA (m2 ha-1) 0.9 5 22.8 28.6 1.1 (0.3) 2.9 (0) 28.6 (4.0) 32.5 (4.3) 0.9 (0.2) 3.4 (0.5) 27.6 (6.6) 31.8 (7.2)
SV (m3 ha-1) 9 71 381 461 11 (4) 41 (0) 493 (72) 546 (76) 10 (1) 51 (8) 490 (122) 551 (131)
Silver fir
DBH (cm) 21 41.48 60.58 - 20.28 40.46 61.86 - 22.65 43.41 63.02 -
-1
Ss (ha ) - - - na - - - 0 - - - 0
Ts (ha-1) - - - na - - - 0 - - - 0
Sap (ha-1) - - - 0 - - - 0 - - - 0
Yt (ha-1) - - - 3 - - - 32.5 (4.3) - - - 0
N (ha-1) 319 8 0 327 339 (58) 22 (0) 0.0 (0) 361 (58) 297 (53) 30 (8) 0 (0) 327 (61)
BA (m2 ha-1) 6.7 0.7 0 7.3 7.8 (1.4) 2.0 (0) 0.0 (0) 9.8 (1.4) 7.6 (1.4) 3.4 (1.1) 0 (0) 11.1 (2.5)
European beech
3 -1
SV (m ha ) 52 8 0 60 71 (12) 27 (0) 0.0 (0) 97 (12) 81 (14) 52 (17) 0 (0) 133 (31)
DBH (cm) 15.62 31.92 - - 16.41 33.47 - - 17.18 36.46 - -
Ss (ha-1) - - - na - - - 44 - - - 45
Ts (ha-1) - - - na - - - 55 - - - 48
Sap (ha-1) - - - 4 - - - 69 - - - 61
Yt (ha-1) - - - 194 - - - 152 - - - 122
N (ha-1) 22 22 6 50 11 (3) 34 (6) 6 (3) 51 (12) 6 (3) 31 (3) 3 (0) 40 (6)
2 -1
BA (m ha ) 1 2.3 1.1 4.3 0.4 (0.1) 3.5 (0.7) 1.2 (0.6) 5.2 (1.3) 0.2 (0.1) 3.4 (0.3) 0.7 (0.0) 4.4 (0.4)
Sycamore maple
SV (m3 ha-1) 10 30 18 59 5 (0) 58 (11) 11 (10) 73 (20) 3 (0) 57 (5) 13 (0) 72 (6)
DBH (cm) 22.53 35.84 50.88 - 8.61 22.52 37.61 - 27.55 37.38 58.15 -
Ss (ha-1) - - - na - - - 155 - - - 156
Ts (ha-1) - - - na - - - 3 - - - 3
Sap (ha-1) - - - 0 - - - 0 - - - 0
-1
Yt (ha ) - - - 3 - - - 0 - - - 3
N (ha-1) 366 66 84 516 376 (67) 78 (6) 98 (14) 552 (87) 326 (62) 83 (14) 84 (14) 493 (89)
Total
BA (m2 ha-1) 8.5 7.9 23.9 40.3 9.3 (1.7) 8.4 (0.7) 29.8 (4.6) 47.5 (7.0) 8.7 (1.7) 10.3 (1.9) 28.3 (6.6)47.3 (10.1)
SV (m3 ha-1) 71 110 399 579 87 (16) 125 (11) 504 (82) 716 (109) 93 (16) 159 (30) 503 (121.82) 755 (168)
iForest 14: 383-392 385Cavlović J et al. - iForest 14: 383-392
tensity using the theoretical rate of current regeneration, and increment. Trees to be lated as the average of simulated values in
iForest – Biogeosciences and Forestry
annual volume increment and the harvest felled were selected by visual inspection the last three cycles, and compared to the
cycle length (eqn. 2): based on the spatial distribution of the sim- theoretical rates. The average simulated
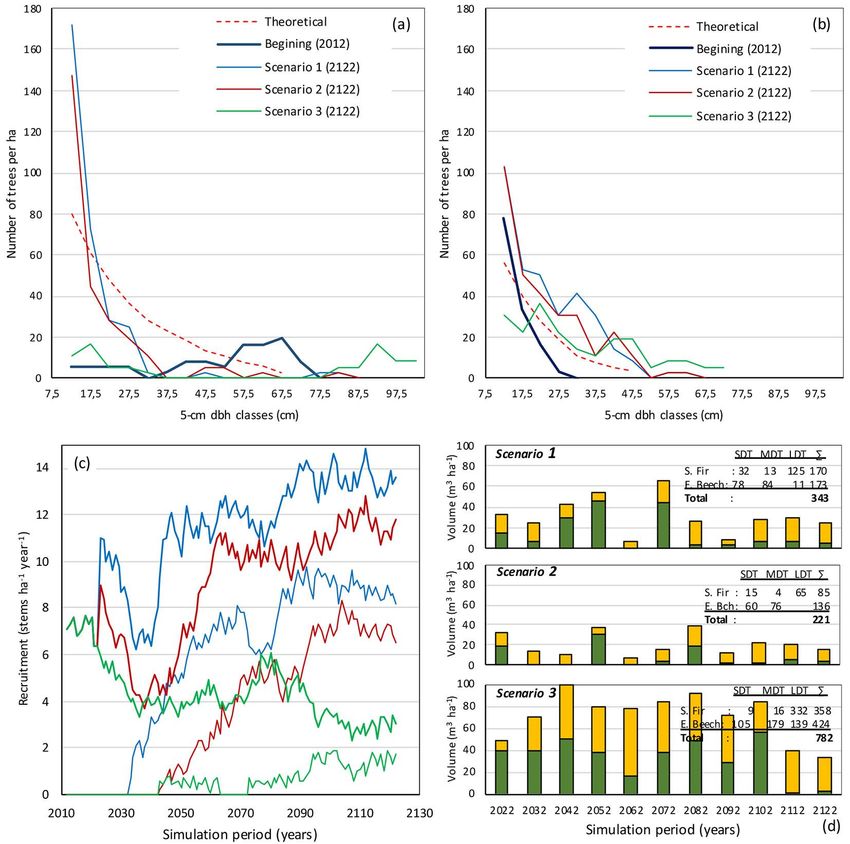
ulated stand (Fig. 1). Total harvest volume values of the rates of current annual vol-
HA sc 2 =SV act⋅hI T (2) was calculated according to tree species ume increment and tree recruitment for
and size using projected data (i.e., height, the two species were also calculated for
where hIT is the theoretical 10-year harvest dbh, volume). Targeted and simulated the last three cycles and compared with
intensity (25.4%), and a 10-year harvest cy- numbers of trees were compared within their theoretical values.
cle and a 2.54% rate of theoretical current each DBH class and species. Overall volume The software STATISTICA® v. 13.0 (Stat-
annual volume increment based on the de- of all marked trees should be equal or close Soft Inc., Tulsa, OK, USA) was used for vali-
veloped BDq model were used. Theoretical to the calculated harvest volume. dation of the growth simulator by paired t-
harvest intensity and the rate of mean an- tests, while the Excel® package (Microsoft
nual volume increment were based on the- Evaluation of management scenarios Corp., Redmond, WA, USA) was used for
oretical growing volume before harvest. Indicators of management and stand the statistical evaluation of management
structure variables predicted by simula- scenarios.
Scenario 3 tions in relation to the theoretical (target)
A third scenario (Scenario 3) simulated values were used to compare and evaluate Results
the future dynamics of the study stand the three scenarios described above. Stand dynamics over the period 1992-2012
where only natural processes (tree growth, Deviations of the projected values of (Tab. 1) was characterized by an increased
tree death, and stand regeneration) take management variables (harvest volume, standing volume (from 579.4 m3 ha-1 to
place and no management activities are harvest intensity, rate of current annual in- 755.5 m3 ha-1) and increased share of broad-
carried out. crement, and net present value) from theo- leaf species (beech and sycamore maple,
retical values of the target BDq model from 20.4% to 27%) based on the 2012 inven-
Simulations were estimated by calculating the follow- tory (before felling). During this period, the
Stand structure development was simu- ing indices (eqn. 3): standing volume of large firs (DBH > 50 cm)
lated for 11 future decades with a 10-year 11 increased from the initial 381 m 3 ha-1 (82.6%
cycle and directed (in scenarios 1 and 2) to ∑t =1|X SC − X N | of the total standing volume of firs) to 490
I DEV =
t t
the target model for the mixed selection 11 (3) m3 ha-1 (89%). Management was character-
stand of fir and beech. For all scenarios at ∑t=1 X N t ized by a low felling intensity (only 15% in
the end of each simulation step, tree at- 2002), although felling intensity increased
tributes (species, age, DBH, and height) as where t is the number of periods (simula- to 22.3% in 2012, aimed to remove large,
well as stand variables per hectare (num- tion steps), XSCt is the projected value at overmature, and low-vitality firs as well as
ber of trees, basal area, growing volume, each simulation step, and XNt is the theoret- large beech trees. The diameter structure
volume increment, number of dead trees, ical value according to the target BDq and the absence of small-diameter firs indi-
and the annual recruitment of young trees model. The smaller the overall deviation cate poor fir regeneration during a long pe-
that exceed the threshold of DBH = 10 cm) from the target value, the better was the riod in the past, as well as poor recent re-
were recorded. scenario rank. generation, with no seedlings, saplings, or
For the first two scenarios, the total har- Stand structural variables (volume of young firs observed in the sample plot. Un-
vest volume was calculated at the end of small, medium and large fir/beech trees, like fir, beech and sycamore showed a fairly
each cycle (eqn. 1, eqn. 2). After each simu- current annual volume increment and re- good regeneration (Tab. 1).
lation step, canopy opening in the stand cruitment of fir/beech trees simulated in The observed dynamics of stand struc-
was simulated by marking trees to be the last three cycles) averaged over cycles ture at the study plot during the 20-year
felled according to the following criteria: were used to calculate the indices of period (Tab. 1) reflects the highest-stocked
(i) gradual harvesting of overmature firs; achievement of the targeted stand struc- fir-beech forests in the Gorski kotar region
(ii) favoring fir regeneration and recruit- ture at the end of simulation period. The and the Croatian Dinarides, as well as for-
ment; (iii) leaving high-value broadleaf rate of volume increase of the three diame- est management in the last 70 years. An ac-
trees (maple); (iv) achieving and maintain- ter classes (small, medium, and large) for cumulated standing volume of large-diame-
ing a balanced selection stand structure, fir and beech/other broadleaves was calcu- ter firs, poor fir regeneration, and low se-
lection harvesting intensities are the main
characteristics. According to CRONFI, the
average standing volume at the study plot
(579 m3 ha-1 – Tab. 1) was 1.6 times higher
than that of the entire forest type (364.9
m3 ha-1) and higher than that of the same
forest type over the whole Gorski kotar re-
gion (417.5 m3 ha-1 – Tab. S1 in Supplemen-
tary material), which is reasonable given
the different spatial scales considered.
However, a similar number of large-diame-
ter trees (DBH > 50 cm) was observed both
in the Gorski kotar region and at the study
plot, with a share of 48% vs. 65% of total
standing volume, respectively (Tab. 1, Tab.
S1 in Supplementary material). This is much
higher than what expected based on the
theoretical structure (33% of the total
growing volume). Similar results were ob-
Fig. 1 - Spatial distribution of tree species within the studied sample plot according to tained in terms of poor fir regeneration
Scenario 1: (a) first simulation step; (b) 11 th simulation step. Silver fir is represented by (Tab. 1). Over the period 1996-2005, the av-
dark green circles, beech by light green circles, Sycamore by dotted pattern, dead erage harvest intensity prescribed in these
trees by red fill, and grey fill denotes trees designated to be felled. stands was only 14%, while the actual inten-
386 iForest 14: 383-392Stand structure and regeneration in a fir-beech forest stand
iForest – Biogeosciences and Forestry
Tab. 2 - Trend and structure of standing volume, harvests and 10-year volume increment during the 11 cycles of the simulation period
according to different scenarios. (DTr): volume of dead trees during last 10-year period; (MDT): medium-diameter trees (DBH 30-50
cm); (LDT): large-diameter trees (DBH > 50 cm); (1): for standing volume and 10-year harvesting intensity the average values for the
simulation period are shown; (2): for Scenarios 1 and 2, HAsc includes the volume of trees marked to harvest and that of dead trees
during last 10-year period, while for Scenario 3 HAsc has relative meaning and presents dead trees during last 10-year period; (3): 10-
year gross volume increment includes net 10-year volume increment and volume of dead trees during the last 10-year period.
(2) (3)
Standing volume Harvest 10-year increment
Cycle Share in SVact Share in HAsc
Scenario SVact HAsc hI10 Gross Net
(end year) Fir / DTr MDT / LDT Fir / DTr MDT /LDT
(m3 ha-1) (m3 ha-1) (%) (m3 ha-1) (m3 ha-1)
(%) (%) (%) (%)
I (2022) 1 743.6 69 / 4 21 / 66 244.4 81 / 14 16 / 81 32.9 151.7 118.4
2 747.8 69 / 4 25 / 54 189.3 62 / 17 23 / 75 25.4 156 124.2
3 741.2 69 / 7 22 / 66 49.3 81 / 100 18 / 63 6.6 150.6 101.8
II (2032) 1 628.9 60 / 4 24 / 61 176 67 / 14 22 / 73 28.1 129.5 104.2
2 697.7 68 / 2 23 / 70 175.1 55 / 7 41 / 55 25.1 139.4 126.5
3 838 66 / 8 23 / 66 70.9 56 / 100 21 / 72 8.4 145.6 75.1
III (2042) 1 566.5 54 / 8 26 / 55 138 77 / 31 11 / 79 24.5 112.8 69.4
2 651.1 69 / 2 21 / 64 163.9 64 / 6 27 / 64 25.2 128.1 117.6
3 904.9 65 / 11 21 / 68 98.9 51 / 100 36 / 46 10.9 137.6 38.6
IV (2052) 1 532.2 44 / 10 28 / 49 117.7 60 / 46 22 / 69 22.3 102.5 48
2 600.4 67 / 6 19 / 64 151.4 63 / 24 18 / 70 25.3 112.6 76.2
3 930 65 / 8 17 / 72 79.6 49 / 100 27 / 59 8.5 124 45
V (2062) 1 517.7 36 / 1 39 / 40 113.3 26 / 6 67 / 25 22.1 102 95.5
2 558.6 63 / 1 24 / 62 140.1 65 / 5 25 / 65 25.2 109.2 101.7
3 976.3 64 / 8 16 / 75 78.1 21 / 100 37 / 41 8 125.3 47.6
VI (2072) 1 503.3 36 / 13 36 / 42 106.2 42 / 61 27 / 65 21.3 98.1 32.9
2 523.2 58 / 3 27 / 58 129.7 49 / 12 45 / 47 24.9 103.7 88.6
3 1018.6 66 / 8 15 / 78 84.4 45 / 100 16 / 60 8.3 119.9 35.8
VII (2082) 1 497.5 33 / 5 41 / 35 108.5 29 / 24 44 / 41 22.1 99.9 73.7
2 489.8 55 / 8 25 / 58 122.6 68 / 32 21 / 67 25.2 95.4 56.1
3 1040.2 65 / 9 18 / 78 91.4 53 / 100 24 / 70 8.8 105.7 14.3
VIII (2092) 1 492.9 32 / 2 42 / 32 110.1 33 / 8 46 / 41 22.6 103 94
2 467 46 / 2 30 / 51 120.9 28 / 9 47 / 47 26.1 100.9 89.8
3 1047.8 64 / 7 15 / 80 72.4 39 / 100 29 / 56 6.9 99 26.6
IX ( 2102) 1 486.4 30 / 6 44 / 28 108.1 35 / 26 55 / 29 22.6 102.9 75.1
2 481.3 45 / 5 11 / 77 114.5 51 / 20 37 / 50 25.8 102.4 79.7
3 1066 63 / 8 12 / 83 84.7 66 / 100 16 / 81 7.9 90.6 5.8
X (2112) 1 483.6 28 / 6 45 / 27 108.2 37 / 27 39 / 41 22.7 104.3 75
2 444.7 42 / 5 37 / 42 112.6 34 / 18 55 / 27 25.7 109.8 89.3
3 1083.9 60 / 4 13 / 82 39.4 2 / 100 18 / 67 3.6 102.6 63.3
XI (2122) 1 494.4 25 / 5 53 / 19 111 12 / 22 71 / 0 23.4 107 82.7
2 450.3 42 / 3 38 / 41 112.4 62 / 13 18 / 76 25.3 117.7 102.8
3 1111.6 61 / 3 14 / 81 33 6 / 100 28 / 43 3 67.1 34.1
(1)
Overall 1 540.6 41 / 6 36 / 41 1442 50 / 24 35 / 54 24 1214 869
2 555.6 57 / 4 26 / 58 1532 56 / 15 32 / 60 25.4 1275 1053
3 978.1 64 / 7 17 / 75 782 43 / 100 24 / 60 7.4 1268 488
sity was 17%, which is within the allowed ried out in the studied stand, absolute and cycle, and continue between 22% and 23% in
20% discrepancy. However, an average har- relative harvest amounts would be consid- the next cycles (Tab. 2). On the other hand,
vest of 76.5 m3 ha-1 10yr-1 (intensity of 21%) erably increased during the first three har- in the Scenario 3 (no management), the
assessed in the first national forest inven- vest cycles, especially in the reference Sce- volume of living trees during the simulation
tory and corresponding to the plan for nario 1. The main differences among the period (110 years) would be reduced by
2006-2015 indicated a gradual increase in simulated management scenarios reflect tree mortality, with the volume of dead
harvest intensity during the last two the different 10-year harvest intensity ap- trees increasing on average by 7.4% in ev-
decades. plied. A continuous intensity of about 25% ery 10-years period (Tab. 2).
Results of the simulated stand structure would normally be applied in Scenario 2, Because 10-year harvests including vol-
achieved by harvesting in eleven succes- whereas the reference Scenario 1 would umes of dead trees are larger by an aver-
sive 10-year cycles are reported in Tab. 2. start with a maximum intensity of 32.9%, age of 19% than the gross 10-year incre-
Compared to previous management car- gradually decrease to 22.3% in the fourth ment (especially in the first four cycles), a
iForest 14: 383-392 387Cavlović J et al. - iForest 14: 383-392
iForest – Biogeosciences and Forestry
Fig. 2 - Theoretical and
simulated DBH distribu-
tions (values after har-
vest) under different
management scenarios
over the period 2012-2122
for (a) Silver fir and (b)
European beech and
other broadleaves; (c)
stand recruitment under
different simulated sce-
narios over the same
period (thin lines: Silver
fir; bold lines: total
recruitment); (d) trend of
standing dead wood and
diameter structure by dif-
ferent scenarios (orange
bars: beech and other
broadleaves; dark green
bars: Silver Fir); numbers
show the overall amount
of standing dead wood by
diameter class (SDT: 10-30
cm, MDT: 30-50 cm; LDT:
>50 cm) over the simula-
tion period.
considerable decrease in standing volume ameter increment (i.e., a faster transition The relationship between the intensity
and a change in the stand structure are ex- of trees into larger-diameter classes) and dynamics of harvesting and the
pected based on Scenarios 1 and 2 (Tab. 2, would lead to an increased number of amount of deadwood is reported in Fig. 2d.
Fig. 3b). Due to the large amount of har- trees in the small DBH classes (fir and The more intensive harvest Scenario 2
vesting in the first two cycles in Scenario 1, beech/OB) and the medium DBH classes would result in the least total volume of
the standing volume of fir would be exces- (beech/OB) within Scenarios 1 and 2 and deadwood, amounting to 221 m3 ha-1 110
sively decreased, whereas Scenario 2 pre- would result in approximately similar DBH years-1 with only 85 m3 of dead fir trees.
dicts a gradual decrease in growing volume distributions of fir and beech. The in- Compared to Scenario 2, the volume of
for fir (Fig. 3a). Scenario 1 and Scenario 2 creased number of small-diameter firs, es- dead trees would be 3.5 times larger under
showed similar trends of total standing vol- pecially in the first two 5-cm DBH classes the no-management scenario (782 m3 ha-1)
ume in the last five cycles, almost coincid- (above theoretical values), and the re- and would disproportionally reflect large-
ing with the theoretical BDq values. Har- moval of most large-diameter firs indicate diameter firs and medium-diameter beech/
vesting would therefore focus on the large- fir regeneration. Scenario 1 would result in OB trees (Fig. 2d).
diameter firs and medium-diameter beech slightly better stand regeneration, as indi- The structure of the standing volume ob-
trees. On the contrary, a volume of dead cated by the higher number of recruited tained at the end of the simulation period
trees lower than the gross volume incre- trees in the last three cycles (8.9 vs. 7.1 firs with respect to the initial and theoretical
ment within cycles (average 62% gross in- and 13.5 vs. 11.3 overall trees – Fig. 2c). Ac- structures (Fig. 3c, Fig. 3d) shows differ-
crement) predicted by Scenario 3 (no-man- cording to the theoretical distribution, the ences among Scenarios 1, 2, and 3. The ref-
agement) would further increase standing remarkable absence of medium-diameter erence Scenario 1, with its less intensive
volume to 1100 m3 per hectare (Tab. 2, Fig. firs would continue. In contrast, relative to harvest intensity, would result in a lower
3b). the beginning and theoretical distributions, percentage of fir in the last cutting cycle
To better elucidate the effects of the sim- the ending DBH distributions of beech and (25% vs. 42% – Tab. 2, Fig. 3c, Fig. 3d), which
ulated management regimes on the stand other broadleaf trees would shift to the is especially noticeable in the middle 10-cm
structure dynamics, we compared the DBH right (i.e., towards larger diamaeters). The DBH classes, where fir is almost absent. A
distribution at the beginning and the end presence of very large (DBH > 80 cm) fir large increase in volume and a shift in the
of the simulation period with that obtained trees (44 per hectare) and medium and DBH distribution, with fir prevailing the last
from the theoretical function (BDq) for fir large beech/OB trees (94 per hectare) three 10-cm DBH classes (DBH > 80 cm)
(Fig. 2a) and for beech and other broad- would be expected at the end of the simu- and beech-OB prevailing in the previous
leaves (OB – Fig. 2b). Improved stand re- lation period under the no-management DBH classes, would be achieved under the
generation (Fig. 2c) and increased tree di- scenario (Scenario 3). no-management approach (Scenario 3).
388 iForest 14: 383-392Stand structure and regeneration in a fir-beech forest stand
iForest – Biogeosciences and Forestry
Fig. 3 - Trends of observed
and simulated standing vol-
ume for (a) Silver fir and (b)
total standing volume over
the period 1992-2122; (c)
structure of beginning vs.
theoretical stand volume
(upper panel), and struc-
ture of stand volume at the
end of the simulation
period for Scenario 1 (lower
panel); (d) structure of
stand volume at the end of
the simulation period for
Scenario 2 (upper panel)
and Scenario 3 (lower
panel). All diagrams show
the values after harvest.
Tab. 3 - Indicators used in the evaluation of simulated management scenarios and their comparison with theoretical (“target”) val -
ues. Indicators of management variables are not relevant for Scenario 3. (p): rate of mean (current) annual volume increment; (INC):
economic value (“on the stump”) of trees to be felled; (n/r): not relevant; (ILDTFir, IMDTFir,ISDTFir): rate of large, medium and small sil-
ver fir diameter trees volume, respectively, according to the total theoretical volume; (ILDTEB, ILDTEB, ILDTEB); rate of large, medium
and small European beech and other broadleaves diameter trees volume, according to the total theoretical volume; (IpFir, IpEB):
ratio of an actual annual volume increment of silver fir/European beech according to the theoretical for each tree species; ( IrcrFir,
IrcrEB): ratio of actual recruitment of silver fir/European beech according to the theoretical recruitment for each tree species; (*):
denote best ranking scenario for each indicator (simulated value closest to the theoretical value); (1): calculation includes the whole
simulation period; (2): includes only the volume of trees to be felled (no dead trees); (3) the average value of the actual variables
for the last three cycles was used to calculate the indicators.
Variable Indicator Target Scenario 1 Scenario 2 Scenario 3
Group variable value average IDEV average IDEV average IDEV
Harvest (2) (m3 ha-1 10yr-1) 117.2 99.7 0.35 119.1 0.2* n/r n/r
Management
variables (1)
hI10 (%) 25.4 24 0.13 25.4 0.01* n/r n/r
p (%) 2.54 2.07 0.19 2.14 0.17* 1.22 0.52
INC (eur ha-1 10yr-1) 4435 4043 0.33 4667 0.16* n/r n/r
ILDTFir 0.31 - 0.18 - 0.3* - 1.85
IMDTFir 0.35 - 0.01 - 0.04* - 0
ISDTFir 0.15 - 0.11* - 0.08 - 0.02
stand structure (3)
ILDTEB 0 - 0.09* - 0.25 - 0.62
Indicators of
IMDTEB 0.12 - 0.48 - 0.22* - 0.38
ISDTEB 0.08 - 0.23 - 0.12* - 0.12
IpFir 1 - 0.86* - 0.79 - 0.18
IpEB 1 - 0.93* - 1.26 - 0.47
IrcrFir 1 - 1.2 - 0.96* - 0.19
IrcrEB 1 - 1.1 - 1.01* - 0.42
iForest 14: 383-392 389Cavlović J et al. - iForest 14: 383-392
Although the reference Scenario 1 had ap- tensities as light (20%), moderate (31%) and composition of accumulated litter due to
iForest – Biogeosciences and Forestry
proximately similar trends and stand struc- heavy (42%) in a study of temperate mixed- stand overstocking and dry micro-site con-
ture development (Fig. 2, Fig. 3), our simu- wood stands, the Scenario 2 can be catego- dition. The impact of climate on fir regener-
lations show that the management Sce- rized as moderate harvesting and the refer- ation was studied by Dobrowolska & Boli-
nario 2 would be more suitable (Tab. 3). In- ence Scenario 1 as light harvesting. Moder- bok (2019), who found that climatic vari-
deed, the average values of management ate harvest intensity and more intense se- ables (summer heat, moisture) are signifi-
variables are closer to the target values, lection cuttings are needed to improve the cant for predicting the probability of fir re-
showing less deviation over the simulation stand structure by providing better light generation. Although the impact of ungu-
period, and the indicators of stand struc- conditions for potential regeneration of late browsing in limiting fir regeneration
ture variables are closer to theoretical rate. various tree species, as recommended in has been documented in Central Europe
Finally, Scenario 3 (no-management) several studies (Lafond et al. 2015, Ray- (Motta 1996, Klopčić et al. 2010, Fischer et
showed the highest discrepancies in stand mond et al. 2018). Although the absolute al. 2013), this has minor impacts in the
structure indicators with respect to theo- theoretical selection structure at the tree Gorski kotar region in Croatia due to con-
retical (balanced) stand structure, which is species level would not be achieved even trolling densities of red deer population
also assumed to be economically efficient. after 110 years (Fig. 2a, Fig. 2b), a relative (up to 1.5 per km2 – Malnar 2011), which is
theoretical selection structure with a sur- quite low compared to more than six red
Discussion plus of thin-diameter trees is expected to deer individuals per km2 reported for Slove-
This study aimed to explore the influence occur in the long run. nia (Klopčić et al. 2010). However, due to
of different management regimes on stand Significant changes in diameter structure, the unpredictability of dynamics and the in-
dynamics in high-stocked stands. The study tree species composition, and stand vol- fluence of many ecological and other influ-
was based on an available small permanent ume over the long term have been re- ential factors on stand regeneration, long-
sample plot 0.36 ha in size, which was rep- ported in many studies of the past dynam- term projections of tree recruitment are
resentative of the stand structure charac- ics of selection forests. Bončina et al. less trustworthy.
teristics. Generally, small plots have smaller (2014), in a study of Dinaric uneven-aged Projection of the diameter structure of
number of trees, a larger edge effect, and forests in the NW Balkans, revealed a per- stands with respect to its theoretical ex-
do not include large tree clusters. Accord- manent increase in stand volume and pectations represents a powerful explana-
ingly, tree spatial patterns are generally as- large-diameter trees in managed forests. tory tool for decision-making in forest man-
sessed on plots of at least 0.25 ha (Han- Similarly, an increase in stand basal area, a agement. However, the present study
ewinkel 2004). On the other hand, Carrer decrease in the number of trees per ha, could not consider the long-term influence
et al. (2018) suggested plots larger than and a substantial increase in the number of of changes in climatic conditions and other
one hectare to investigate large-scale spa- large-diameter firs were observed in other influential factors. Yet, long-term predic-
tial patterns and achieve high accuracy for studies (O’Hara et al. 2007, Keren et al. tions suggested a significant decrease in
long-distance patterns (> 10 m) in old- 2018). Increases in the proportion of beech potential fir habitat in Croatia due to cli-
growth mountain forests across Europe. In and other species were also noticed (Paro- mate change (Anić et al. 2009), as well as
the study plot at the beginning of the simu- bekova et al. 2018). These findings are con- improved growing conditions for beech at
lation period, several (up to six) tree clus- sistent with the results of this study (Tab. higher elevations compared to the current
ters (Fig. 1a) could be distinguished, indi- 1). However, according to the simulated re- climate (Mina et al. 2017). Other environ-
cating the existence of a lower limit for sults (Scenario 1, Scenario 2 – Tab. 2), large mental factors may also influence future
long-distance patterns. However, simula- decreases in overall stand volume and the stand dynamics (Kienast et al. 1999, Fischer
tion of scenarios under different manage- volume of large-diameter trees as well as et al. 2013).
ment regimes (Scenarios 1 and 2) based on large increases in beech and sycamore Besides the achievement and mainte-
single-stem and small-group selection maple are expected. The large increases of nance of economically efficient stand struc-
(small canopy openings) would reveal even the latter species corresponds with the re- tures, the functionality of stand structures
shorter-distance patterns and fine spatial sults of Mina et al. (2017), who reported a should also be considered, as the goals of a
structure. Regarding the assessment of strong rise in the proportion of beech in multi-objective forest management are af-
stand structure attributes, Gray (2003) the Dinaric Mountains under both manage- fected by currently changing environmen-
studied the plot size effect in old-growth ment and climate change impacts over the tal, social, and economic conditions. Bon-
and mature Douglas-fir forests, revealing long term. čina et al. (2014) highlighted an important
that the density of small, medium, and Despite the overstocked stand structure advantage of uneven-aged forest manage-
large trees (75-122 cm DBH) estimated on observed in this study, poor fir regenera- ment under increasingly unpredictable con-
four clustered sub-plots of 18 m radius tion in the past period and more recently ditions, which is due to the “elasticity” of
each within a 1-ha plot (40.7%) differed by as well as the abundance of regeneration the structure of selection stands. Sustain-
10%-20% in relation to the reference 1-ha and small-diameter beech trees (Tab. 1, Fig. ability of uneven-aged management in a
plot density. Based on similar size (0.36 vs. 2a, Fig. 2b) indicate a long-term expansion multi-objective sense based on different
0.41 ha), a similar degree of representative- of beech at the expense of fir, as already sites and uneven-aged management sys-
ness of the 1-ha stand area for the studied revealed by many studies (Bončina et al. tems were confirmed in several studies
plot can be assumed. Hence, due to the 2002, 2014, Diaci et al. 2011). However, in (O’Hara et al. 2007, Lafond et al. 2015). The
above issues on plot size and its conse- forests characterized by high structural alternative to these harvest management
quent limitations, the obtained, observed, heterogeneity and tree species mingling approaches may be the maintenance of
and simulated results of this study are (Keren et al. 2018), better conditions for old-growth stands in specific parts of the
somewhat inconsistent, and the following development of young firs under older fir-beech forest by applying a light-harvest-
considerations should be taken with cau- beech trees may be expected. Stand struc- ing or no-harvest regime, with the objec-
tion. ture and canopy openings are considered tive of increasing the share of large trees
Unlike the observed (Tab. 1) and tradition- as the key influential factors of stand re- and deadwood (Fig. 2d, Fig. 3d) and sup-
ally applied low harvest intensities, the ref- generation (Čavlović et al. 2006, Raymond porting ecological and forest habitat func-
erence and theoretical harvest intensity et al. 2018, Dobrowolska & Bolibok 2019). tions (Hodge & Peterken 1998, Paillet et al.
scenarios showed that more intense har- Besides stand structure, environmental 2017). To this end, our projections showed
vesting and stand openings would lead to factors (i.e., site condition, climate, brows- that the adoption of a no-harvest regime
the achievement of a balanced stand struc- ing) can strongly impact fir regeneration. (Scenario 3) would result in a considerably
ture in the long term. According to Ray- Šafar (1965) revealed that fir is less com- larger amount of deadwood compared
mond et al. (2018), who graded harvest in- petitive than beech in sites with slow de- with the other two harvesting scenarios
390 iForest 14: 383-392Stand structure and regeneration in a fir-beech forest stand
(Scenarios 1 and 2 – Fig. 2d). This suggests different management regimes in the fir- Forest Ecology and Management 407: 125-134. -
iForest – Biogeosciences and Forestry
that decreasing management intensity will beech forest type in the Croatian Dinarides. doi: 10.1016/j.foreco.2017.10.041
favor the accumulation of deadwood and The results obtained may be useful to sup- Čavlović J, Bozić M, Bončina A (2006). Stand
the provision of different habitat functions. port the conversion of high-stocked stands structure of an uneven-aged fir-beech forest
The importance of old-growth forests for to a balanced structure, as well as to with an irregular diameter structure: modeling
maintaining biodiversity and mitigating cli- achieve old-growth structure in the Dinaric the development of the Belevine forest, Croa-
mate change has become more apparent, region. However, further comprehensive tia. European Journal of Forest Research 125:
with many studies published recently (Frey investigations are needed, including plots 325-333. - doi: 10.1007/s10342-006-0120-z
et al. 2016, Watson et al. 2018, Kenina et al. representing different site-stand character- Čavlović J, Božić M, Teslak K, Vedriš M (2016).
2019). The results obtained in this study istics, forest types, and previous manage- Chapter 15 - Croatia. In: “National Forest Inven-
show that in such high-stocked stands or ment regimes. Various selection manage- tories - Assessment of Wood Availability and
parts of stands, only several decades (up to ment systems, management objectives, Use” (Vidal C, Alberdi I, Hernandez L, Redmond
5) would be needed to achieve old-growth and environmental factors (climate, emis- J eds). Springer, Cham, Switzerland, pp. 281-
structural characteristics (Bauhus et al. sions, disturbances) should also be in- 305.
2009). Hence, such stands represent an ap- cluded to support planning and manage- Diaci J, Rozenbergar D, Anić I, Mikac S, Saniga M,
propriate basis for establishing networks ment in fir-beech forests. Kucbel S, Visnjic C, Ballian D (2011). Structural
of managed multifunctional forest ecosys- dynamics and synchronous silver fir decline in
tems. Acknowledgments mixed old-growth mountain forests in Eastern
The influence of the proportion and size K.T., K.B., M.V., M.A. and J.C. designed and Southeastern Europe. Forestry 84: 479-491.
of canopy gaps in different types of stands the study; K.T., M.V. and K.B. collected the - doi: 10.1093/forestry/cpr030
on the dynamics and structure of selection field data; K.T., and K.B. analysed the data; Dobrowolska D, Bolibok L (2019). Is climate the
stand regeneration is a key issue which de- J.C wrote final draft of the manuscript. All key factor limiting the natural regeneration of
serves further investigations. Parobekova authors contributed in revising and editing silver fir beyond the northeastern border of its
et al. (2018) showed that in a mixed spruce- the manuscript. This research was funded distribution range? Forest Ecology and Man-
fir-beech old-growth forest, only canopy by the Croatian Science Foundation (proj- agement 439: 105-121. - doi: 10.1016/j.foreco.20
gaps > 100 m2 formed by the mortality of a ect no. IP-2018-01-8820). 19.02.040
single tree or small group of trees were of Emmingham WH (2002). Status of uneven-aged
major importance for the extensive estab- References management in the Pacific Northwest, USA.
lishment of natural regeneration. In our Anić I, Vukelić J, Mikac S, Bakšić D, Ugarković D Forestry 75: 433-436. - doi: 10.1093/forestry/75.
study, due to the relatively small size of the (2009). Effects of global climate change on the 4.433
sample plot, only single-stem and combina- ecological niche of silver fir (Abies alba Mill.) in Ficko A, Poljanec A, Bončina A (2011). Do
tions of single-stem and small-group crown Croatia. Šumarski List 133: 135-144. [online] changes in spatial distribution, structure and
openings were simulated. Therefore, it URL: http://hrcak.srce.hr/36397 abundance of silver fir (Abies alba Mill.) indicate
may be more appropriate the use of larger Bauhus J, Puettmann K, Messier C (2009). Silvi- its decline? Forest Ecology and Management
“virtual” plots (Beljan et al. 2018) that inte- culture for old-growth attributes. Forest Ecol- 261: 844-854. - doi: 10.1016/j.foreco.2010.12.014
grates several NFI sample plots within a ogy and Management 258: 525-537. - doi: 10.101 Fischer A, Marshall P, Camp A (2013). Distur-
specific site, stand characteristics, and pre- 6/j.foreco.2009.01.053 bances in deciduous temperate forest ecosys-
vious management regimes. Beljan K, Posavec S, Čavlović J, Teslak K, Knoke T tems of the Northern Hemisphere: their effects
(2018). Economic consequences of different ap- on both recent and future development. Biodi-
Conclusions proaches to even-aged silver fir forests. Croat- versity and Conservation 22: 863-898. - doi:
The results of our study can support its ian Journal of Forest Engineering 39: 299-312. 10.1007/s10531-013-0525-1
starting hypotheses, despite the limitations [online] URL: http://hrcak.srce.hr/204197?lang= Frey SJK, Hadley AS, Johnson SL, Schulze M,
discussed above. The projected stand en Jones JA, Betts MG (2016). Spatial models re-
structure based on simulations of different Bettinger P, Boston K, Siry JP, Grebner DL veal the microclimatic buffering capacity of old-
management regimes showed that a more (2009). Forest management and planning. Aca- growth forests. Science Advances 2 (4):
intensive selection harvest would posi- demic Press, London, UK, pp. 331. e1501392. - doi: 10.1126/sciadv.1501392
tively affect stand regeneration dynamics, Bončina A, Diaci J, Cenčić L (2002). Comparison Gray A (2003). Monitoring stand structure in ma-
favoring the achievement of the targeted of the two main types of selection forests in ture coastal Douglas-fir forests: effect of plot
selection stand structure in at least 100 Slovenia: distribution, site conditions, stand size. Forest Ecology and Management 175: 1-16.
years, assuming the absence of influences structure, regeneration and management. - doi: 10.1016/S0378-1127(02)00078-6
from any other factors. Forestry 75: 365-373. - doi: 10.1093/forestry/75. Hanewinkel M (2004). Spatial patterns in mixed
The approach traditionally used in opera- 4.365 coniferous even-aged, uneven-aged and con-
tional forest planning based on the actual Bončina A (2011). History, current status and fu- version stands. European Journal of Forest Re-
rate of current annual increment has not ture prospects of uneven-aged forest manage- search 123 (2): 139-155. - doi: 10.1007/s10342-00
led to as “poor” a harvest intensity ap- ment in the Dinaric region: an overview. For- 4-0023-9
proach as expected, due to the initial over- estry 84: 467-478. - doi: 10.1093/forestry/cpr023 Hanewinkel M, Frutig F, Lemm R (2014). Eco-
stocked conditions of the stand. However, Bončina A, Čavlović J, Curović M, Govedar Z, nomic performance of uneven-aged forests an-
the results obtained indicated that the ref- Klopčič M, Medarević M (2014). A comparative alysed with annuities. Forestry 87: 49-60. - doi:
erence approach was less suitable than the analysis of recent changes in Dinaric uneven- 10.1093/forestry/cpt043
others. On the contrary, the theoretical aged forests of the NW Balkans. Forestry 87: Hodge SJ, Peterken GF (1998). Deadwood in
harvest intensity approach was deemed as 71-84. - doi: 10.1093/forestry/cpt038 British forests: priorities and strategy. Forestry
the more appropriate according to both Bozić M (1999). Modeli gospodarenja šumama 71: 99-112. - doi: 10.1093/forestry/71.2.99
management and stand structure vari- jele u Gorskom kotaru [Models of silver fir for- Hasenauer H, Kindermann G, Steinmetz P
ables. Hence, the permanent application of est management in Gorski Kotar region]. MSc (2006). The tree growth model MOSES 3.0. In:
this approach can be recommended in the thesis, Dept. of Forest Inventory and Manage- “Sustainable Forest Management Growth Mod-
long run, independently of the structural ment, Faculty of Forestry, University of Zagreb, els for Europe (1st edn)” (Hasenauer H ed).
characteristics of the selection stand. Croatia, pp. 120. [in Croatian] Springer, Berlin, Germany, pp. 64-70.
This study investigated for the first time Carrer M, Castagneri D, Popa I, Pividori M, Lin- Kenina L, Jaunslaviete I, Liepa L, Zute D, Jansons
the dynamics of past stand development gua E (2018). Tree spatial patterns and stand at- A (2019). Carbon pools in old-growth Scots pine
and long-term projections of high-stocked tributes in temperate forests: the importance stands in hemiboreal Latvia. Forests 10: 1-10. -
stand structure and its regeneration under of plot size, sampling design, and null model. doi: 10.3390/f10100911
iForest 14: 383-392 391Cavlović J et al. - iForest 14: 383-392
Keren S, Medarević M, Obradović S, Zlokapa B beech-fir forest ecosystems. Plant Biosystems Raymond P, Royo A, Prevost M, Dumais D
iForest – Biogeosciences and Forestry
(2018). Five decades of structural and composi- 147: 664-671. - doi: 10.1080/11263504.2013.7766 (2018). Assessing the single-tree and small
tional changes in managed and unmanaged 49 group selection cutting system as intermediate
montane stands: a case study from South-East Mina M, Bugmann H, Klopčić M, Cailleret M disturbance to promote regeneration and di-
Europe. Forests 9: 2-19. - doi: 10.3390/f9080479 (2017). Accurate modeling of harvesting is key versity in temperate mixedwood stands. Forest
Kienast F, Fritschi J, Bissegger M, Abderhalden for projecting future forest dynamics: a case Ecology and Management 430: 21-32. - doi:
W (1999). Modeling successional patterns of study in the Slovenian mountains. Regional En- 10.1016/j.foreco.2018.07.054
high-elevation forests under changing herbi- vironmental Change 17: 49-64. - doi: 10.1007/s10 Regulations for Forest Management Planning
vore pressure - responses at the landscape lev- 113-015-0902-2 (2006). Pravilnik o uređivanju šuma [Rules on
el. Forest Ecology and Management 120: 35-46. Motta R (1996). Impact of wild ungulates on for- forest management]. Narodne Novine, 111/
- doi: 10.1016/S0378-1127(98)00541-6 est regeneration and tree composition of 2006, Zagreb, Croatia. [in Croatian] [online]
Klepac D (1961). Novi sistem uredivanja prebor- mountain forests in the Western Italian Alps. URL: http://narodne-novine.nn.hr/clanci/sluzbe
nih šuma [New management system of uneven Forest Ecology and Management 88: 93-98. - ni/2006_10_111_2462.html
aged forests]. Komora poljoprivrede i šumars- doi: 10.1016/S0378-1127(96)03814-5 Rozenbergar D, Mikac S, Anić I, Diaci J (2007).
tva NR Hrvatske, Zagreb, Croatia, pp. 46. [in O’Hara KL, Hasenauer H, Kindermann G (2007). Gap regeneration patterns in relationship to
Croatian] Sustainability in multi-aged stands: an analysis light heterogeneity in two old-growth beech-fir
Klopčić M, Jerina K, Bončina A (2010). Long-term of long-term plenter systems. Forestry 80: 163- forest reserves in South East Europe. Forestry
changes of structure and tree species composi- 178. - doi: 10.1093/forestry/cpl051 80: 432-443. - doi: 10.1093/forestry/cpm037
tion in Dinaric uneven-aged forests: are red O’Hara KL, Gersonde RF (2014). Stocking control Šafar J (1965). Sirenje bukve na području Dinar-
deer an important factor? European Journal of concepts in uneven-aged silviculture. Forestry ida u Hrvatskoj [The expanding emergence of
Forest Research 129: 277-288. - doi: 10.1007/s103 77 (2): 131-143. - doi: 10.1093/forestry/77.2.131 beech in Croatian Dinarides]. Šumarski List 89:
42-009-0325-z O’Hara KL, Bončina A, Diaci J, Anić I, Boydak M, 198-217. [in Croatian]
Lafond V, Cordonnier T, Courbaud B (2015). Rec- Curović M, Govedar Z, Grigoriadis N, Ivojevic S, Špiranec M (1976). Volumne tablice za jelu i sm-
onciling biodiversity conservation and timber Keren S, Kola H, Kostov G, Medarević M, Metaj reku [Volume tables for silver fir and Norway
production in mixed uneven-aged mountain M, Nicolescu N, Raifailov G, Stancioiu P, Vel- spruce]. Radovi 29: 1-119. [in Croatian]
forests: identification of ecological intensifica- kovski N (2018). Culture and silviculture: origins Watson JEM, Evans T, Venter O, Williams B, Tul-
tion pathways. Environmental Management 56: and evolution of silviculture in Southeast Eu- loch A, Stewart C, Thompson I, Ray JC, Murray
1118-1133. - doi: 10.1007/s00267-015-0557-2 rope. International Forestry Review 20 (1): 130- K, Salazar A, McAlpine C, Potapov P, Walston J,
Linares J, Camarero JJ (2012). Growth patterns 143. - doi: 10.1505/146554818822824228 Robinson JG, Painter M, Wilkie D, Filardi C, Lau-
and sensitivity to climate predict silver fir de- Paillet Y, Archaux F, Boulanger V, Debaive N, rance WF, Houghton RA, Maxwell S, Grantham
cline in the Spanish Pyrenees. European Jour- Fuhr M, Gilg O, Gosselin F, Guielbert E (2017). H, Samper C, Wang S, Laestadius L, Runting RK,
nal of Forest Research 131: 1001-1012. - doi: 10.10 Snags and large trees drive higher tree micro- Silva-Chávez GA, Ervin J, Lindenmayer D (2018).
07/s10342-011-0572-7 habitat densities in strict forest reserves. For- The exceptional value of intact forest ecosys-
Malnar J (2011). Migracije običnog jelena (Cervus est Ecology and Management 389: 176-186. - tems. Nature Ecology and Evolution 2 (4): 599-
elaphus L.) u zapadnom dijelu Gorskog kotara doi: 10.1016/j.foreco.2016.12.014 610. - doi: 10.1038/s41559-018-0490-x
kao odraz stanišnih čimbenika [The migration Parobekova Z, Pittner J, Kucbel S, Saniga M, Fil-
of red deer (Cervus elaphus L.) in the western ipek M, Sedmakova D, Vancurik J, Jaloviar P Supplementary Material
part of Gorski Kotar as a reflection of habitat (2018). Structural diversity in a mixed spruce-fir-
factors]. PhD thesis, Faculty of Forestry, Zagreb beech old-growth forest remnant of the West- Fig. S1 - Map of the Gorski kotar forest
University, Croatia, pp. 187. [in Croatian] ern Carpathians. Forests 9: 2-19. - doi: 10.3390/f region and research site location.
Meyer HA (1943). Management without rota- 9070379
tion. Journal of Forestry 41: 126-132. [online] Pirovano AR, Zecca G (2014). Black woodpecker Tab. S1 - Overview of general and stand
URL: http://academic.oup.com/jof/article-abstra Dryocopus martius habitat selection in the Ital- structure characteristics of the studied
ct/41/2/126/4706846 ian Alps: implications for conservation in Nat- selection fir-beech forests in Gorski kotar
Mikac S, Klopf M, Anić I, Hasenauer H (2013). Us- ura 2000 network. Bird Conservation Interna- region.
ing the tree growth model MOSES to assess tional 24: 299-315. - doi: 10.1017/S095927091300
the dynamics of Dinaric old-growth mixed 0439 Link: Cavlovic_3638@suppl001.pdf
392 iForest 14: 383-392You can also read