COVID-19 Latin American fall and rebound since the - CEMLA
←
→
Page content transcription
If your browser does not render page correctly, please read the page content below
Latin American fall and rebound since the
               COVID-19

 Luciano Campos1                    Danilo Leiva-León2                      Steven Zapata2

                                     1 Universidad
                                                de Alcalá
                                        2 Banco
                                             de España
                           3 Ministerio de Hacienda de Colombia

                                             July 2021
The views expressed in this presentation do not necessarily reflect the views of the Banco de España, the
                        Eurosystem or the Ministerio de Hacienda de Colombia.
Introduction
I The COVID-19 crisis has significantly challenged the
measurement of economic conditions around the globe
I Latin America is not the exception
BRASIL MEXICO PERU
6
Quarterly GDP Growth Before COVID-19
4
2
0
-2
-4
-6
-8
1994 1996 1998 2000 2002 2004 2006 2008 2010 2012 2014 2016 2018 2020
30
Quarterly GDP Growth Since COVID-19
20
10
0
-10
-20
-30
1994 1996 1998 2000 2002 2004 2006 2008 2010 2012 2014 2016 2018 2020Introduction
I Context: During COVID-19 times a continuous reading of
the Latin American economy’s vital sign is of the utmost
importance
I Aim 1:Tracking turning points in the region under this
unstable environment
I Aim 2: Tracking how deep (buoyant) an unfolding recessions
(expansion) in the region can become
I Problem: The magnitudes of real activity have become more
heterogeneous than ever
I This significantly complicates economic modellingLiterature
I Hamilton (1989): Univariate Markov-switching models where
unconditional means µexp and µrec are constant over time
I Chauvet (1998): Multivariate Markov-switching (dynamic
factor) models where unconditional means also constantLiterature
I Hamilton (1989): Univariate Markov-switching models where
unconditional means µexp and µrec are constant over time
I Chauvet (1998): Multivariate Markov-switching (dynamic
factor) models where unconditional means also constantLiterature
I Hamilton (1989): Univariate Markov-switching models where
unconditional means µexp and µrec are constant over time
I Chauvet (1998): Multivariate Markov-switching models where
unconditional means also constant
I Eo and Kim (2016): Univariate Markov-switching models
where unconditional means are time-varying
I Leiva-Leon et al. (2021): Multivariate Markov-switching
models where unconditional means are time-varyingWhat we do
I We employ the framework recently proposed in Leiva-Leon et
al. (2021) for the study of LATAM’s cyclical position:
1. Markov-Switching Dynamic Factor Model:
Accounts for business cycle asymmetries
2. Mixed Frequency and Ragged Edges:
Provides high-frequency real-time updates
3. Flexible Time-varying Means:
Measures heterogeneous recessions and expansions
I Estimate the proposed nonlinear factor model for the largest
LATAM economies, using quarterly GDP and monthly activity
indicators
I Argentina, Brazil, Chile, Colombia, Ecuador, Mexico and Peru.
I These inferences are summarized into a
Latin American Weakness Index (LAWI) that provides:
→ timely assessments of LATAM’s cyclical positionWhat we do
I We employ the framework recently proposed in Leiva-Leon et
al. (2021) for the study of LATAM’s cyclical position:
1. Markov-Switching Dynamic Factor Model:
Accounts for business cycle asymmetries
2. Mixed Frequency and Ragged Edges:
Provides high-frequency real-time updates
3. Flexible Time-varying Means:
Measures heterogeneous recessions and expansions
I Estimate the proposed nonlinear factor model for the largest
LATAM economies, using quarterly GDP and monthly activity
indicators
I Argentina, Brazil, Chile, Colombia, Ecuador, Mexico and Peru.
I These inferences are summarized into a
Latin American Weakness Index (LAWI) that provides:
→ timely assessments of LATAM’s cyclical positionThe Model
I Real activity indicators, yi,t , can be expressed as:
yi,t = γi Θ(ft ) + ui,t ,
I The idiosyncratic components, ui,t , are given by
ui,t = ψi,1 ui,t−1 + ... + ψi,P ui,t−p + ei,t , ei,t ∼ N (0, σi2 ) i.i.d.
I The common factor, ft , follows flexible nonlinear dynamics to
accommodate for recessions and expansions of different
magnitudes,
ft = µ0,τi (1 − st ) + µ1,τi st + ef ,t , ef ,t ∼ N (0, σf2 ) i.i.d.,
where st ∈ {0, 1}, with 0 for recessions, and 1 for expansions.
I The regime-dependent means, µ1,τi and µ0,τi , correspond to
the expected value of the factor, ft , during the τi−th
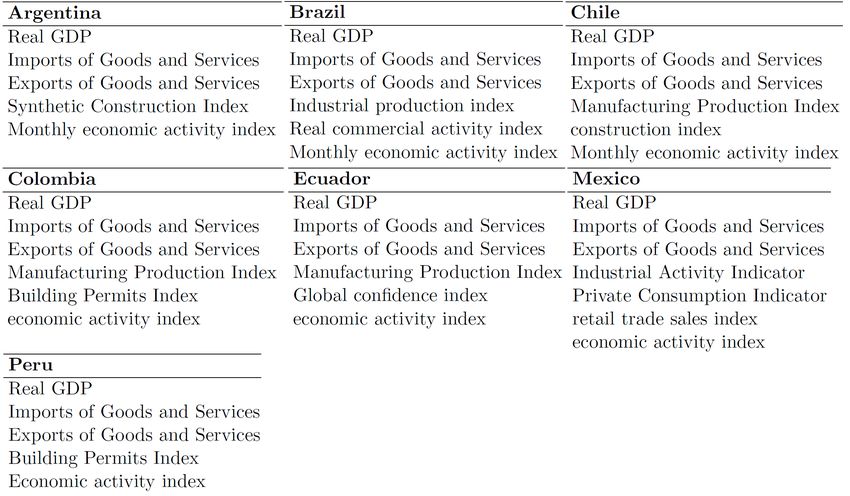
expansion or the τi−th recession.Data
I We fit the nonlinear factor model to the seven largest
economies in the LATAM region by employing the following
quarterly and monthly indicators of activity:Argentina
Quarterly Real GDP Growth
10
0
-10
-20
1995 2000 2005 2010 2015 2020
Monthly Activity Index
10
0
-10
1995 2000 2005 2010 2015 2020
Monthly Recession Probability
1
0.5
0
1995 2000 2005 2010 2015 2020Brazil
Quarterly Real GDP Growth
10
0
-10
2000 2005 2010 2015 2020
Monthly Activity Index
0
-5
-10
2000 2005 2010 2015 2020
Monthly Recession Probability
1
0.5
0
2000 2005 2010 2015 2020Chile
Quarterly Real GDP Growth
10
0
-10
2000 2005 2010 2015 2020
Monthly Activity Index
5
0
-5
2000 2005 2010 2015 2020
Monthly Recession Probability
1
0.5
0
2000 2005 2010 2015 2020Colombia
Quarterly Real GDP Growth
10
0
-10
-20
1995 2000 2005 2010 2015 2020
Monthly Activity Index
5
0
-5
-10
1995 2000 2005 2010 2015 2020
Monthly Recession Probability
1
0.5
0
1995 2000 2005 2010 2015 2020Ecuador
Quarterly Real GDP Growth
0
-5
-10
1995 2000 2005 2010 2015 2020
Monthly Activity Index
5
0
-5
1995 2000 2005 2010 2015 2020
Monthly Recession Probability
1
0.5
0
1995 2000 2005 2010 2015 2020Mexico
Quarterly Real GDP Growth
10
0
-10
-20
1995 2000 2005 2010 2015 2020
Monthly Activity Index
10
0
-10
-20
1995 2000 2005 2010 2015 2020
Monthly Recession Probability
1
0.5
0
1995 2000 2005 2010 2015 2020Peru
Quarterly Real GDP Growth
20
0
-20
2000 2005 2010 2015 2020
Monthly Activity Index
10
0
-10
2000 2005 2010 2015 2020
Monthly Recession Probability
1
0.5
0
2000 2005 2010 2015 2020Latin American Weakness Index
I LAWI: proportion of the LATAM economy in recession
K
(l) X (l)
LAWIt = ωκ,t sκ,t ,
κ=1
1
0.5
0
2000 2005 2010 2015 2020
Argentina Brazil Chile Colombia Ecuador Mexico Peru
1
0.5
0
2000 2005 2010 2015 2020Latin American Weakness Index: Zoom into COVID crisis
I The country-specific contributions to the LATAM economic
weakness have exhibited significant variations in recent times
I Monitoring the internal sources of economic weakness in the
region represents is crucial for policy makers
1
0.5
0
2020.2 2020.4 2020.6 2020.8 2021 2021.2 2021.4
Argentina Brazil Chile Colombia Ecuador Mexico Peru
1
0.5
0
2020.2 2020.4 2020.6 2020.8 2021 2021.2 2021.4Country-specific “Intensity” of Growth
t f = (µ0,τi (1 − st ) + µ1,τi st ) + ef ,t , ef ,t ∼ N (0, σf2 )
|{z} | {z } |{z}
Factor Intensity : µt Disturbances
Argentina Brazil Chile Colombia
5 4
3
2
2 2
1 0
0
0
-2 0 -2
-1
-4 -4
-5 -2
-6
-3 -6
-8
-4
-8
-10 -10 -5
2000 2005 2010 2015 2020 2000 2005 2010 2015 2020 2000 2005 2010 2015 2020 2000 2005 2010 2015 2020
Ecuador Mexico Peru
6
5
4 4
2
2 0
0
0
-2
-5
-2 -4
-6
-4 -10
-8
-6
-10
2000 2005 2010 2015 2020 2000 2005 2010 2015 2020 2000 2005 2010 2015 2020Latin American Intensity Index
I For each country, the common factor can be decomposed into
t f = (µ0,τi (1 − st ) + µ1,τi st )+ ef ,t , ef ,t ∼ N (0, σf2 )
|{z} | {z } |{z}
Factor Intensity : µt Disturbances
I LAII: Growth intensity of the LATAM economy
K
(l) X (l)
LAIIt = ωκ,t µκ,t ,
κ=1
1
0.5
0
-0.5
-1
-1.5
-2
2000 2005 2010 2015 2020Application: Effect of US Financial Conditions on LATAM
I What is the time-varying relationship between U.S. financial
conditions and LATAM’s economic weakness?
LAIIt = αt + βt FCIt + et ,
I where αt and βt are assumed to follow random walks
2.5 Latin American Intensity Index
U.S. Financial Conditions Index
2
1.5
1
0.5
0
-0.5
-1
-1.5
2000 2005 2010 2015 2020Application: Effect of US Financial Conditions on LATAM
I The contemporaneous correlation between LATAM real
activity and FCI have increased substantially since the COVID
crisis.
I This estimates suggest the increasing importance of U.S.
financial conditions for LATAM’s economic recovery
0.5
0
-0.5
-1
-1.5
-2
-2.5
-3
2000 2005 2010 2015 2020Country-specific “Intensity” of Growth
I There is heterogeneity regarding the sensitivity of
country-specific weakness to U.S. financial conditions.
0.5
0
-0.5
-1
-1.5
-2
-2.5
-3
-3.5
-4
2018 2019 2020 2021
Argentina Brazil Chile Colombia Ecuador Mexico PeruConclusions
I This paper brings new statistical measures for LATAM
economies to the table for the use of policy makers
1. Latin American Weakness Index (LAWI): measures the share
of LATAM region in recession
2. Latin American Intensity Index (LAII): measures the intensity
of LATAM crisis and recoveries
I The framework provides high frequency real-time updates on
the cyclical position of LATAM economies as new information
is released
I We also asses the effect of external developments on the
LATAM region, by focusing on the time-varying effect of U.S.
financial conditions.
I The estimates suggest that sensitivity of LATAM activity to
U.S. financial conditions has substantially increased since the
COVID-19 crisis.You can also read