CPB - New Directions for Data-Driven Transport Safety
←
→
Page content transcription
If your browser does not render page correctly, please read the page content below
CPB
               Corporate Partnership
               Board

New Directions
for Data-Driven
Transport Safety                       Corporate Partnership Board
                                       Report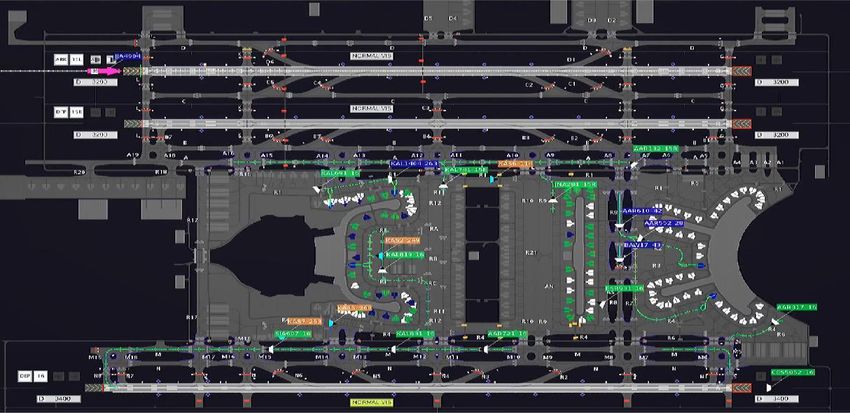
New Directions
for Data-Driven
Transport Safety   Corporate Partnership Board
                   Report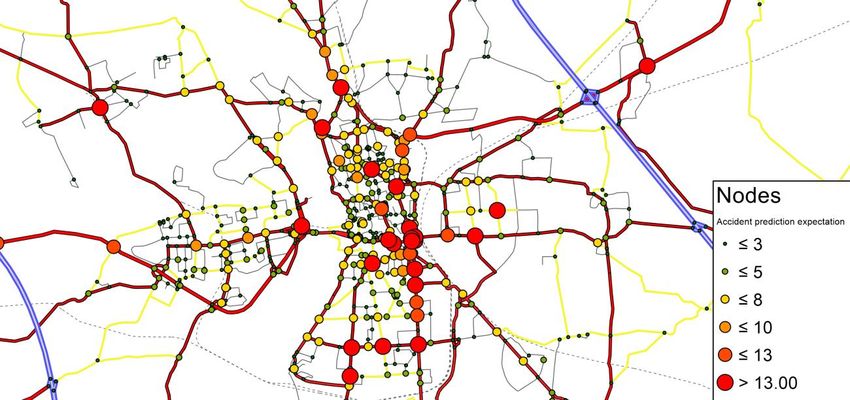
About the International Transport Forum
The International Transport Forum at the OECD is an intergovernmental organisation with 59 member
countries. It acts as a think tank for transport policy and organises the Annual Summit of transport
ministers. ITF is the only global body that covers all transport modes. It is administratively integrated with
the OECD, yet politically autonomous.

ITF works for transport policies that improve peoples’ lives. Our mission is to foster a deeper understanding
of the role of transport in economic growth, environmental sustainability and social inclusion and to raise
the public profile of transport policy.

ITF organises global dialogue for better transport. We act as a platform for discussion and pre-negotiation
of policy issues across all transport modes. We analyse trends, share knowledge and promote exchange
among transport decision makers and civil society. ITF’s Annual Summit is the world’s largest gathering of
transport ministers and the leading global platform for dialogue on transport policy.

Our member countries are: Albania, Argentina, Armenia, Australia, Austria, Azerbaijan, Belarus, Belgium,
Bosnia and Herzegovina, Bulgaria, Canada, Chile, China (People’s Republic of), Croatia, Czech Republic,
Denmark, Estonia, Finland, France, Georgia, Germany, Greece, Hungary, Iceland, India, Ireland, Israel,
Italy, Japan, Kazakhstan, Korea, Latvia, Liechtenstein, Lithuania, Luxembourg, Malta, Mexico, Republic of
Moldova, Montenegro, Morocco, Netherlands, New Zealand, North Macedonia, Norway, Poland, Portugal,
Romania, Russian Federation, Serbia, Slovak Republic, Slovenia, Spain, Sweden, Switzerland, Turkey,
Ukraine, the United Arab Emirates, the United Kingdom and the United States.

About the Corporate Partnership Board
The Corporate Partnership Board (CPB) is the International Transport Forum’s platform for engaging with
the private sector and enriching global transport policy discussion with a business perspective. The
members of the ITF Corporate Partnership Board are: Abertis, AB InBev, Alstom, Aramco, Bird, Bosch,
Brisa, ExxonMobil, Incheon International Airport, Kakao Mobility, Kapsch TrafficCom, Latvian Railways,
Michelin, North Adriatic Sea Port Authority, NXP, PTV Group, RATP Group, The Renault-Nissan-Mitsubishi
Alliance, SAS, Siemens, SNCF, Total, Toyota, Uber, Valeo, Volvo Cars, Volvo Group and Waymo.

Disclaimer
Funding for this work has been provided by the ITF Corporate Partnership Board. This report is published
under the responsibility of the Secretary-General of the ITF. It has not been subject to the scrutiny of ITF or
OECD member countries, and does not necessarily reflect their official views or those of the members of the
Corporate Partnership Board.

                                             www.itf-oecd.org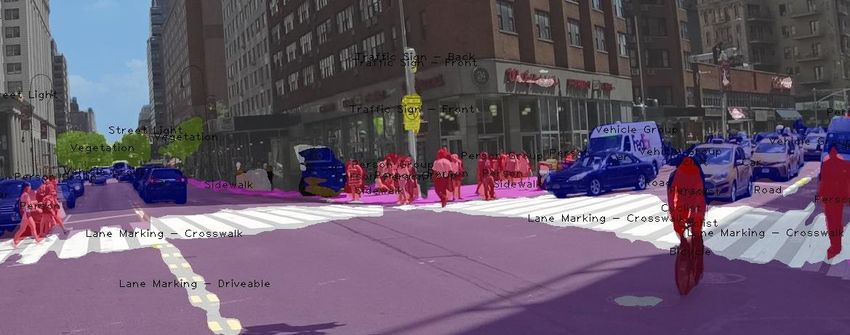
Acknowledgements
The work for this report was carried out in the context of a project initiated and funded by the International
Transport Forum's Corporate Partnership Board (CPB). CPB projects are designed to enrich policy discussion
with a business perspective. They are launched in areas where CPB member companies identify an
emerging issue in transport policy or an innovation challenge to the transport system. Led by the ITF, work
is carried out in a collaborative fashion in working groups consisting of CPB member companies, external
experts and ITF staff.

Many thanks to the members of the Corporate Partnership Board companies involved in this work: Abertis,
ABInBev, Alstom, Bosch, Brisa, ExxonMobil, Incheon International Airport Corporation, Kapsch TrafficCom,
Latvian Railways, Michelin, NXP, PTV Group, RATP Group, Renault Nissan Mitsubishi Alliance, SAS Institute,
Siemens, SNCF, Total, Toyota, TransDev, Uber, Valeo, Waymo.

The report draws conclusions from the ITF CPB Workshop “New directions for data-driven transport safety”
held 3-4 December 2018 at the OECD in Boulogne, France. Participants of the workshop included:

Jean Marc Beteille, RATP Group                      Mollie McArdle, Open Transport Partnership and
                                                    SharedStreets
Joao Bernardino, Transportes Inovação e
Sistemas                                            Laura Meynier, ITF

Jonathan Bibas, Ellis-Car                           Luis Miranda-Moreno, Brisk Synergies, McGill University

Jean-Baptiste Burtscher, Valeo                      Rachele Poggi, ITF

Maguelonne Chandesris, SNCF                         Marc Ribo, Abertis

Philippe Crist, International Transport Forum (ITF) David Roiné, Valeo

Véronique Feypell, ITF                              Manuelle Salathé, Observatoire National Interministériel
                                                    de sécurité routière
Rahul Goel, University of Cambridge
                                                    Sofia Salek de Braun, PTV
Karsten Kremer, PTV
                                                    Alexandre Santacreu, ITF
Takayuki Kusajima, Toyota
                                                    Neil Thorpe, Newcastle University
Vincent Ledoux, Cerema
                                                    Philippe Girard, Total
Manuel Lianos, NXP
                                                    Philippe Ventejol, RATP Group
Darren Lindsey, Michelin
                                                    George Yannis, National Technical University of Athens
Sharon Masterson, ITF

Special thanks go to Annie Chang (SAE), Ieva Kustova (Latvian Railways), Jasja Tijink (Kapsch TrafficCom),
Sam Chapman (The Floow), Jane Lupson (Transport for London) and Brendan Halleman (IRF Global) for
contributions and insightful comments. At the International Transport Forum, credits go to Sokob Challener
and Hilary Gaboriau for support and editing, to Veronique Feypell and Rachele Poggi for their contributions
to the workshop, to Katja Schechtner and Gyuhyung Lee for support on drones and aviation.

The principal authors of this report are Alexandre Santacreu, Laura Meynier and Philippe Crist. The project
was managed by Philippe Crist and Alexandre Santacreu of the International Transport Forum. Coordination
of CPB activities was carried out by Sharon Masterson.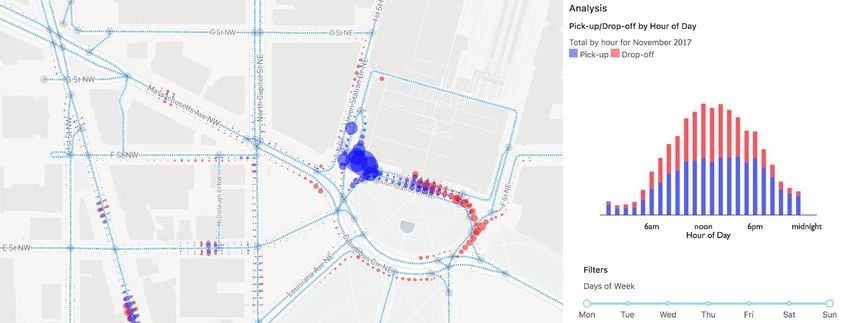
4 – TABLE OF CONTENTS
Table of contents
Executive summary....................................................................................... 7
Introduction ................................................................................................ 11
Safe System and Vision Zero: The role of data ................................................ 13
Road safety is a global issue ............................................................................................................................ 13
Enforcement is essential ................................................................................................................................. 14
Broadening the benefits of automation .......................................................................................................... 15
Protecting the most vulnerable road users ..................................................................................................... 16
Transit as a solution ........................................................................................................................................ 16
Gathering intelligence on crashes and injuries ................................................. 18
Merging data from police, hospital and insurance sources .............................................................................. 18
Self-reporting falls and crashes ....................................................................................................................... 21
In-depth crash investigation using Event Data Recorders ................................................................................ 24
Automatic crash notification ........................................................................................................................... 26
Proactive network management ..................................................................... 28
Surrogate safety metrics to power crash prediction models ........................................................................... 28
Mapping risk factors along the network.......................................................................................................... 31
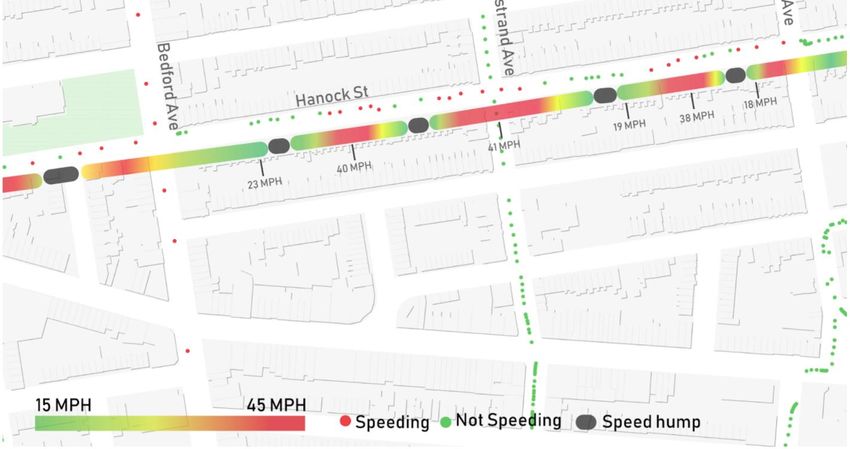
How to map and monitor speeding................................................................................................................. 33
Exposure data ................................................................................................................................................. 35
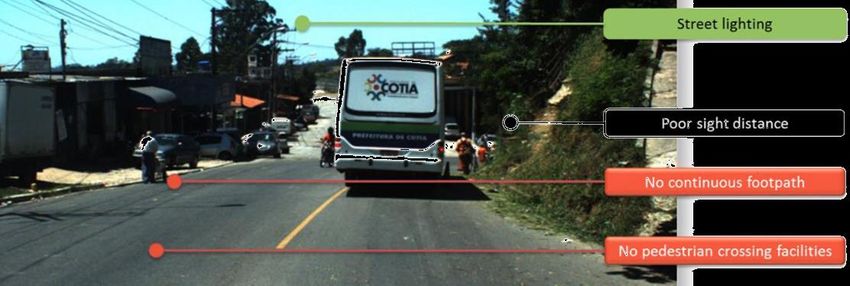
Infrastructure inspection and predictive maintenance through mobile sensors and imagery ......................... 36
A growing role for drones and satellites .......................................................................................................... 39
User feedback on infrastructure faults and incidents ...................................................................................... 41
Focusing on individuals and their behaviours ................................................... 44
Driver coaching ............................................................................................................................................... 44
Sensing driver distraction and drowsiness ...................................................................................................... 45
Monitoring the behaviour of professional drivers ........................................................................................... 47
Insurance telematics and their impact on behaviour ...................................................................................... 51
Driver accountability ....................................................................................................................................... 52
NEW DIRECTIONS FOR DATA-DRIVEN TRANSPORT SAFETY – © OECD/ITF 2019
TABLE OF CONTENTS –           5

Expanding Cooperative Intelligent Transport Systems ...................................... 55
  Road safety use case ....................................................................................................................................... 55
  Competing solutions for short range communication...................................................................................... 57
  Protecting vulnerable road users with cooperative systems ........................................................................... 58
  Risk mapping from collaborative intelligence.................................................................................................. 61
  Railway safety applications at level crossings ................................................................................................. 62
  Aircraft traffic safety ....................................................................................................................................... 63

Addressing the barriers to data sharing .......................................................... 64
  Privacy protection ........................................................................................................................................... 64
  Tools, models and partnerships for sharing data ............................................................................................. 66

Bibliography ................................................................................................ 69

Tables
Table 1. Comparing the traditional road safety approach with a Safe System ....................................... 13
Table 2. C-ITS safety-related use cases........................................................................................... 56

Figures
Figure 1. The Safe System approach to road safety........................................................................... 15
Figure 2. Portland e-scooter traffic density....................................................................................... 23
Figure 3. Separating regression to the mean from the true benefit of an intervention ............................ 28
Figure 4. Hydén’s safety pyramid ................................................................................................... 29
Figure 5. Predicted hotspot location mapped in Visum Safety ............................................................. 30
Figure 6. See.Sense crowd-sourced road surface defect mapping ........................................................ 32
Figure 7. Passenger pick-up and drop-off locations provided by ride-sourcing companies ........................ 33
Figure 8. High spatial resolution speed map using data from Dash ...................................................... 34
Figure 9. Computer vision applied to street imagery .......................................................................... 37
Figure 10. Street with one-star iRAP pedestrian rating ....................................................................... 38
Figure 11. Wireless technologies mobilised for C-ITS services ............................................................. 57
Figure 12. Some C-ITS safety-related use cases ............................................................................... 59
Figure 13. Dashboard of a surface movement control system at Incheon International Airport ................. 63
Figure 14. Map-matched GPS points generate data on roadway traffic speeds ....................................... 66

Boxes
Box 1. New York City matches police and hospital records ................................................................. 20
Box 2. Self-reported injury data from the British National Travel Survey .............................................. 21

NEW DIRECTIONS FOR DATA-DRIVEN TRANSPORT SAFETY – © OECD/ITF 2019
6 – TABLE OF CONTENTS
Box 3. Self-reporting of road crashes with smartphone apps in the Netherlands .................................... 22
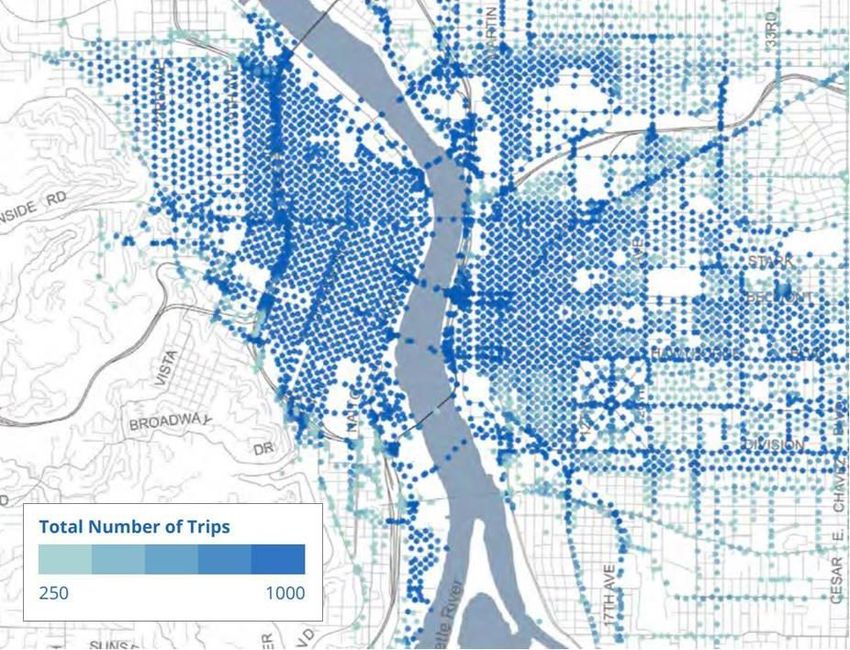
Box 4. 2018 Portland e-scooter routes travelled ............................................................................... 23
Box 5. NHTSA Event Data Recorder standard ................................................................................... 25
Box 6. Regression to the mean ...................................................................................................... 28
Box 7. Predicting collision counts at potential road safety hotspots ...................................................... 30
Box 8. Data reveals systematic inequalities between neighbourhoods .................................................. 31
Box 9. Vaccines for Roads assesses and maps road safety problems .................................................... 38
Box 10. Safety for rail transport: Siemens Mobility and Strukton Rail’s Video Track Inspector.................. 38
Box 11. Vision Zero Boston Safety Concerns Map ............................................................................. 42
Box 12. Five components of a safety culture .................................................................................... 48
Box 13. Coexistence of different standards on the 5.9 gigahertz band.................................................. 57
Box 14. European projects PROSPECT and XCYCLE develop innovative solutions to protect pedestrians
and cyclists ................................................................................................................................. 60
Box 15. Sweden monitors slippery roads with connected vehicles ........................................................ 61
Box 16. Latvian Railway and Datakom develop smart safety measures for level crossings ...................... 62
Box 17. Examples of de-identification techniques .............................................................................. 65
Box 18. Archive of Many Outdoor Scenes ........................................................................................ 66
Box 19. HERE’s Open Location Platform........................................................................................... 67
NEW DIRECTIONS FOR DATA-DRIVEN TRANSPORT SAFETY – © OECD/ITF 2019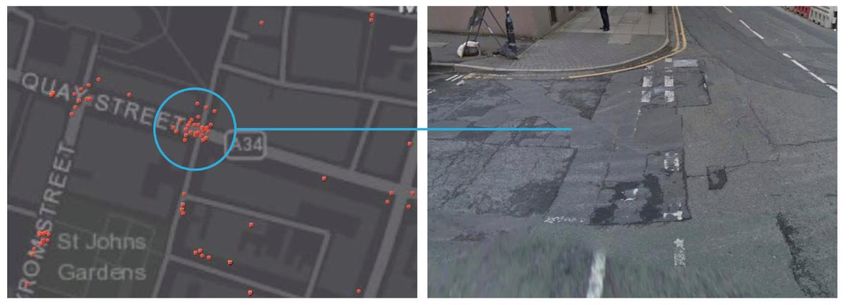
EXECUTIVE SUMMARY –   7

Executive summary
What we did
This report explores how seamless data collection, analysis and sharing can unlock innovations in transport
safety. The rise of smartphones, sensors and connected objects is relentlessly producing more data.
Progress in computing power, data science and artificial intelligence make it possible to interpret them. This
presents an opportunity for the transport sector in general and for transport safety in particular. This report
thus focuses on road safety, drawing on experiences from all transport modes. It examines emerging
solutions to better assess crash numbers and to understand factors that contribute to them. It also
identifies ways to address infrastructure safety problems in a proactive manner and to tackle road user
errors. Finally, the report explores how road safety can benefit from driver assistance systems and
cooperative connected solutions. The focus here is on the role of data sharing, including such important
aspects as privacy protection, data standards and the role of partnerships. The work builds on the findings
of a workshop held in December 2018 and on input from numerous experts.

What we found
The majority of countries lack reliable, complete and comparable data on road crashes and associated
injuries. Often only the number of fatalities is known. Information technology can help address this gap,
including through solutions that involve hospital data or self-reporting. New data sources also offer many
opportunities for understanding crash risks.

In the rail sector, a predictive maintenance model is already helping to prevent safety-critical failures on
tracks and trains. Along the road network, automatic data collection is also possible thanks to instrumented
vehicles and smartphones reporting information on factors including hard braking, poor road surfaces and
excess speed. Surrogate safety metrics could be developed using data on the engagement of active safety
systems. These include anti-lock braking systems (ABS), electronic stability control (ESP) and autonomous
emergency braking (AEB). The activation of such systems provides some of the simplest yet most relevant
surrogate safety data a vehicle can produce.

The concept of surrogate safety metrics is increasingly used to diagnose traffic safety problems and take
action before a serious crash happens. Surrogate safety metrics are based on identifying the occurrence
and severity of traffic conflicts involving evasive actions such as braking or swerving, but not necessarily
collisions. Using artificial intelligence, large amounts of video footage and data points from road-side
cameras and sensors can be analysed to identify close calls in which a crash was narrowly avoided.

Street imagery can be used to support the assessment of the safety characteristics of roads. This already
happens for the attribution of star ratings under road assessment programmes. The next generation of
star-rating programmes will most likely benefit from more frequent and broader collection of image data as
well as automated image analysis from computer vision solutions. Drones and satellites can capture
additional data and will play an increasing role for road safety. These innovations will facilitate the planning
of road safety investments as well as the monitoring of results.

Cooperative Intelligent Transport Systems (C-ITS) will enable connected vehicles to openly broadcast
relevant warnings. In addition to communicating with each other and with the road infrastructure,
connected vehicles will be able to report on system performance in real time and throughout the entire road
network. This should benefit all road users, connected or not. Network managers could use data from short
range messages as a rich source of information, where road-side receivers are installed.

NEW DIRECTIONS FOR DATA-DRIVEN TRANSPORT SAFETY – © OECD/ITF 2019
8 – EXECUTIVE SUMMARY

Sharing vehicle-related data in a common format could enhance road safety. Technologies like automatic
crash notification and event data recorders already propose data-driven systems for emergency response
and crash investigations.

A host of telematics solutions exist for fleet management, usage-based insurance, eco-driving and safe
driving coaching. Smartphones are becoming increasingly capable of running such applications and the
flexibility they offer could make such solutions increasingly popular. Their market penetration, processing
power and communication capability make them an obvious choice for transport safety-related data
collection. To complement automated data collection, transport users and workers can use smartphones to
voluntarily report close calls, infrastructure defects or unsafe behaviour, often in real-time.

New technologies offer solutions but also pose problems. Big data is prone to many of the same errors and
biases that plague smaller data sets. Thus, more data is not helpful in itself; it only provides better answers
if analysed with rigor. Big data also creates privacy threats, especially with the growing risk of re-
identification of individuals in anonymised data sets.

Information technology can also have negative impacts on road safety. For instance, drivers might evade
speed enforcement using dedicated alert systems. They could also be distracted from driving by new
services, from navigation and infotainment to Cooperative Intelligent Transport System (C-ITS) alerts and
coaching. And, conscious of the protection offered by active safety systems, drivers may take their eyes
away from the road over sustained periods of time. Generally, driver distraction is likely to increase as
smartphones, smart glasses and vehicle infotainment systems compete for the driver’s attention. There will
be little commercial incentive to shut down such systems during driving, as users will want to be
entertained during an increasingly automated, hence uneventful, drive.

What we recommend
Develop standards and platforms for the collection and sharing of safety-critical vehicle data

Requirements for the collection and sharing of data should be imposed on shared vehicles, whether cars,
bicycles or scooters, whether standard or electric. An international data standard would help operators to
launch services in new places. It would help public authorities to monitor whether services deliver on policy
targets. The data could include geo-located information about falls, crashes, and the engagement of safety
systems. Data on start and end points, turns, spot speed, pavement riding and wrong-way riding should
also be registered, as should traffic volumes. Standard data reporting formats should be jointly established
by the industry and regulators to facilitate processing and analysis. Excessive regulatory pressure on
emerging mobility services in comparison to traditional services should, however, be avoided.

Ensure privacy in the use of safety-critical data

The use of data to improve safety outcomes should not erode privacy or the protection of personal data.
Data collection and analysis should be fully in line with existing privacy frameworks and should evolve as
those frameworks themselves evolve. A wide range of privacy solutions exist to increase use of data for
traffic safety and respect the privacy of individual users. Approaches such as de-identification, data
swapping, variable sampling or encryption can help ensure the balance between optimising safety and
addressing privacy concerns.

Refine the applications of surrogate traffic safety metrics

Further research should aim to identify which surrogate safety metrics can predict road traffic crash
numbers most successfully and which can specifically predict the number of people killed and seriously
injured. Research should also explore how surrogate safety metrics could include factors such as the
fragility of a crash victim, speed, mass and crash angle. The transport community should work to

                                                      NEW DIRECTIONS FOR DATA-DRIVEN TRANSPORT SAFETY – © OECD/ITF 2019
EXECUTIVE SUMMARY –    9

harmonise terms, definitions and techniques for surrogate measures of safety to provide a sound basis for
this research.

Harness Big Data for road safety but beware of biases

A lot of excitement surrounds the potential of Big Data. Road safety professionals need to acknowledge a
number of pitfalls, however. Every dataset should be considered to be biased towards some user group, trip
purpose or other dimension unless proven otherwise. The expertise of qualified data scientists and
statisticians will be needed to counter the risk that the opportunistic analysis of low-cost data misleads
decision makers.

Review training needs for road safety professionals

The adoption of surrogate safety metrics provides an occasion to review statistical core competencies
among road safety professionals and identify training needs. A good understanding of key statistical
concepts is essential to prevent the misinterpretation and misuse of data. Strengthening links between
transport safety experts and specialised academic researchers could be beneficial.

Empower transport users and workers through mechanisms to report safety concerns

Feedback systems that maximise participation from workers and from the travelling public can provide
valuable data on transport safety. Transport workers should have access to a trusted channel for reporting
safety issues without fear of recrimination. Passengers should be able to help identify potential dangers, for
instance risky behaviour by drivers in the bus and taxi industries. Road users should have a mechanism to
submit video evidence of unsafe driving, or photos of road defects. Highway authorities should join forces
and provide such platforms, harmonise user experience, share costs and consider open-source solutions.

Make safety-critical vehicle data available for telematics applications

Vehicle telematics could have significant effects on driver behaviour. Solutions increasingly rely on
smartphones to detect vehicle dynamics. Establishing a new standard for the wireless dissemination of
vehicle information would encourage the use of valuable data. The standard data protocol should allow the
monitoring of driving conditions for insurance purposes, coaching or other uses. Hacking risk could be
eliminated by designing the standard as a one-way broadcast.

Find ways to integrate smartphones into Cooperative-ITS to benefit all users

Private cars should contribute to data collection as shared vehicle fleets do already. Cooperative ITS
technology enables every vehicle to openly and regularly broadcast its position and send warning messages
when relevant. For these messages to benefit the wider community, including non-connected vehicles,
smartphones should be integrated into the C-ITS system. Policy makers should allocate frequency bands for
C-ITS safety application and promote the introduction of interoperable C-ITS systems worldwide.

Improve and link police and hospital data on road crash injuries

Most countries have a poor understanding of the true number of serious injuries and of crash circumstances
leading to these injuries. Improving the quality of police and health records is important. Equally important
is to link data from transport and health spheres, be it for occasional or permanent linkages. Self-reported
traffic injury surveys also have a role to play in complementing other datasets.

Prevent, detect and signal driver distractions

New vehicles should include distraction and drowsiness alerts as a standard feature. These should
preferably be based on eye tracking technologies. Crash investigators should have access to eye tracking
data through event data recorders (“black boxes”). Smartphone apps developed by the car insurance

NEW DIRECTIONS FOR DATA-DRIVEN TRANSPORT SAFETY – © OECD/ITF 2019
10 – EXECUTIVE SUMMARY

industry could prevent the phone from functioning when activated by a driver, but potentially also monitor
eye movements and thus alert on other distractions.

Revise trigger mechanisms for automatic crash notification and event data recording

Vehicle crashes with pedestrians and other vulnerable road users often do not trigger airbags, which in turn
would typically trigger an automatic crash notification (such as eCall) and an event data recorder.
Vulnerable road users that become victims of a crash with a vehicle thus rarely benefit from such systems.
The trigger mechanism should thus be reconsidered and revised to ensure that all road users benefit from
these potentially life-saving alert and investigation systems. The solution could involve sensors or forward-
facing cameras that are already fitted to vehicles as part of autonomous emergency braking systems.

Share data to enforce limits on driving hours in the gig economy

In the gig economy, independent workers are hired as self-employed contactors to carry out short-term
assignments. Typical assignments in the gig economy include driving vehicles for ride-sourcing operators
and delivering goods and food for platform-based companies. The auto-entrepreneurs typically face high
pressure to work long hours to make their activity gainful. To prevent breaches in the driving hours
restrictions applicable to other commercial drivers, ride-sourcing and delivery platforms could be required
to share data on driving and riding time via the licence numbers of their contractors.

Favour more accurate and relevant geo-spatial accuracy for safety applications

Information about safety-relevant events such as hard-braking can help better target safety-improving
interventions. Their geo-spatial accuracy needs to be consistent and detailed, however. Hybrid geo-spatial
sensing approaches combining multiple sources should be preferred over single-sensor approaches (like
using only smartphone apps) for road safety applications.

Update legal frameworks to account for ubiquitous sensing data and their use in improving safety

Data streams from sensors, like those provided by increasingly ubiquitous video data, can contribute to
better safety outcomes if used for analysis. Legal frameworks should be reviewed and adapted to
accommodate the collection and use of such sensor data. In line with current data protection policies, only
post-incident data should be preserved for legal purposes, and only sufficiently de-identified and
aggregated data should be used for measuring safety outcomes and targeting interventions.

                                                     NEW DIRECTIONS FOR DATA-DRIVEN TRANSPORT SAFETY – © OECD/ITF 2019
INTRODUCTION – 11 Introduction Quantities of data are generated daily in transport from transactions, location services, and sensors (tracking physical activity, for instance). Transport provides an immense opportunity for data to be collected and turned into valuable insights. This report focuses on harnessing newly-available and large, often unstructured data with the aim of improving transport safety. Safety in road transport lags far behind the rail and aviation sectors, where safety takes precedence over efficiency or convenience, and where risks are addressed at system-level rather than at user-level. Train drivers and aircraft pilots, for example, are rarely given the responsibility of determining speeds and headways they wish to adopt. While rail and aviation systems are based on a zero tolerance policy and have relatively low per kilometre death rates, road traffic results in an intolerable 1.35 million deaths per year – a toll that continues to rise. Road crashes have become the leading cause of death in children aged between five and 14, but also in young people aged between 15 and 29 (WHO, 2018). In response to this, a number of countries have embraced the Safe System approach to transport safety. This approach treats crash-related deaths and serious injuries as largely preventable and not as an inevitable price to pay for the mobility of people and goods. This paradigm shift is gaining traction at a time when technology is creating opportunities for data-driven solutions to support the new approach. Current trends are shaping a future with ubiquitous connectivity. Smartphone penetration is near 80% in almost every developed country (Deloitte, 2017), and more than three billion people use mobile internet globally (GSMA, 2018). The number of Internet of Things (IoT) connections will increase more than threefold between 2017 and 2025, reaching 25 billion, driven by a proliferation of use cases for smart homes and smart cities. Location services built on location-sensing technologies and data from other location-relevant signals, such as Wi-Fi positioning, are widely adopted by members of the public, not least for navigation purposes, but also to identify nearby transport options and services. Beyond smartphones, location technologies are also embedded in vehicles and wearable technologies such as health monitors. Location services are becoming more accurate as the world becomes more connected, as every fixed connection serves as a location beacon. Their accuracy is complemented by a growing number of novel location-sensing technologies and new global satellite positioning systems. Sensors are increasingly embedded into mobile devices or vehicles. Facial scanners, embarked LIDAR (light detection and ranging) sensors, radars and cameras, combined with adequate processing power and adapted algorithms, are able to recognise users and make sense of their environment. Sophisticated mass- produced sensors are now on wearable devices and transport modes like shared bicycles and e-scooters. Sensors on vehicles provide new opportunities for enhanced safety (ITF, 2015). They provide vehicle- related data that, if shared in a common format, could enhance road safety. Work is underway to harmonise standards regarding data sharing protocols in order to accelerate safety improvements and lower implementation costs for conventional and increasingly automated vehicles. As the connected network of objects expands, it generates an amount of data which is growing at an exponential rate, creating opportunities and raising new challenges. Considerable uncertainty remains as to if and how data will contribute to a different approach to transport safety. Can we learn precious insights from the collected data, and use it to improve safety outcomes? If so, do we have the capacity to access, process (either on-board or remotely) and make sense of so much information? What might be the effects on other sectors? For example, will the insurance sector be transformed by the use of behaviour-tracking NEW DIRECTIONS FOR DATA-DRIVEN TRANSPORT SAFETY – © OECD/ITF 2019
12 – INTRODUCTION

technologies in smartphones and other devices to provide nudges for people to adopt safer behaviours? Will
data collection infringe on essential privacy protection principles and provoke public backlash which would
harm a range of safety use cases? Are adequate policies in place to guide the public and private
exploitation of this data along the whole data continuum – from sensing, to the extraction of relevant data,
to its transcription, retention, analysis and, finally, to its destruction? These are essential questions.

This report begins with a review of transport safety challenges and helps position data-driven innovative
solutions in the context of a wide range of interventions. The next section explores innovative solutions to
address deficiencies in both the reporting and in-depth investigation of crashes. The report then examines
data-led or data-informed proactive infrastructure management strategies. The following section reviews
innovative solutions focusing on people and their behaviours. The final section of the report looks at issues
related to retaining personal privacy, protecting commercially-sensitive information in the deployment of
data-led safety strategies, and addressing organisational barriers and technical interoperability challenges.

                                                       NEW DIRECTIONS FOR DATA-DRIVEN TRANSPORT SAFETY – © OECD/ITF 2019
SAFE SYSTEM AND VISION ZERO: THE ROLE OF DATA – 13
Safe System and Vision Zero: The role of data
Road crashes continue to kill over 1.3 million people each year (WHO, 2018), whereas not a single death
occurred in a commercial passenger jet in 2017. In response to this public health challenge, the Vision Zero
strategy seeks to eliminate traffic fatalities and serious injuries. It requires “a shift in how communities
approach decisions, actions, and attitudes around safe mobility” (Vision Zero Network, 2018a).
Vision Zero forms part of the Safe System approach pioneered in Sweden and the Netherlands. Sweden’s
Vision Zero strategy was adopted by Parliament in 1997. In the Netherlands, a similar policy, entitled
Sustainable Safety, was developed in the 1990s by the Dutch Institute for Road Safety Research (SWOV) in
an effort to promote “inherently safe road traffic” (ITF, 2016a). The Safe System approached was endorsed
by the European Commission in 2018.
According to the Safe System approach, death and serious injury in road collisions are not an inevitable
price to pay for mobility. The Safe System approach accepts that people make mistakes and acknowledges
that collisions will continue to occur, but it aims to ensure that such mistakes do not result in fatalities or
serious injuries (Table 1). Better vehicle construction, improved road infrastructure and lower speeds can all
contribute to reducing the impact of crashes, and better data can help us to understand and avoid future
crashes. The responsibility for the Safe System is shared in a coordinated manner across public and private
sectors. Its application is closely monitored to assess results and, if necessary, review measures, taking
into account experience, new data and new technologies.
Table 1. Comparing the traditional road safety approach with a Safe System
Question Traditional road safety approach Safe System approach
Crashes resulting in fatal and serious
What is the problem? All traffic crashes
injuries
Reducing fatal and serious injury
What is the goal? Eliminating fatal and serious injuries
numbers
Reactive to incidents Proactively target and treat risk
Which planning approaches? Incremental approach to reduce the Systematic approach to build a safe
problem road system
People inevitably make mistakes
What causes the problem? Non-compliant road users
People are fragile
Responsibility is shared by individuals
Who is ultimately responsible? Individual road users
and system designers
Different elements are combined so
How does the system work? Isolated interventions that if one fails, others provide
protection
Source: adapted from ITF (2016a).
Road safety is a global issue
The World Health Organisation (WHO, 2018) found the risk of a road traffic death remains three times
higher in low-income countries than in high-income countries. Although only half of the world’s motor
vehicle fleet is located in low- and middle-income countries, 90% of road traffic injuries and deaths occur
there (WB, 2017). For this reason, where high-income countries develop data-driven transport safety
solutions, their transferability to low- and middle-income countries should be a priority.
NEW DIRECTIONS FOR DATA-DRIVEN TRANSPORT SAFETY – © OECD/ITF 201914 – SAFE SYSTEM AND VISION ZERO: THE ROLE OF DATA
With their rapid penetration across the globe, their mass production and their range of capabilities,
smartphones may become the world’s number one transport safety equipment, helping low- and middle-
income countries leap-frog richer nations. But cellular data remains an expensive and somewhat scarce
commodity in many parts of the world. Many connections occur over fixed Wi-Fi networks as a result. This
erodes benefits that depend on ubiquitous connectivity and real-time applications. Where possible,
smartphone-related road safety innovation should be designed to deliver benefits in degraded conditions,
with only occasional connections to a Wi-Fi network. Some cities choose to roll out blanket Wi-Fi coverage
along their streets and public spaces. In a sense, such a policy can also facilitate the use of real-time
safety-relevant apps and enable their adoption by people who can’t afford a mobile data plan.
Enforcement is essential
Enforcement of traffic rules is necessary to promote safer behaviours. Not sufficient in itself, certainly better
when associated with awareness campaigns, enforcement is nonetheless required.
Technology facilitates enforcement of road traffic rules with tools like automatic number plate recognition
(Carnis, 2017). On the other hand, technology has provided road users with ways to evade enforcement.
For instance, drivers can report the position of speed control equipment, whether fixed or mobile,
effectively creating a live map that allows other drivers to reduce their speed at control sites. One should
bear in mind such challenges when designing enforcement strategies which are both acceptable and
effective. A better use of data, especially on speed and crash risk, seems important in this context.
Managing speeds
A range of solutions exist to bring speeds down to a level which prevents fatal and serious injuries. They
include engineering, enforcement, education and nudges. The deployment of such tools would benefit from
the identification of speeding hotspots in time and space and from an immediate evaluation of the results
on speeds. Leveraging on new data sources, speed analytics can develop and guide the elaboration of
speed and speeding management solutions.
Inappropriate speed is responsible for 20% to 30% of all fatal road crashes according to the ITF
International Road Traffic Safety Analysis and Data Group (IRTAD), whose analysis confirms the very strong
relationship between speed and crash risk. When average speed increases by 1%, the number of fatal
crashes goes up 4%. (ITF, 2018a)
Speed is, therefore, one of the key action areas in a Safe System approach, as represented on Figure 1.
Speed limits should be set and enforced to achieve safe conditions for the specific roadway context, and to
protect those road users most at risk in the event of a crash. To better manage speeds, one needs to
“measure and analyse the scope of problem related to inappropriate speeds, share this data to raise
awareness, and develop measurable improvement strategies with timelines for action” (Vision Zero
Network, 2018a). The Proactive network management section of this report makes the case for developing
robust methods in the collection of spot speed distribution data. Such efforts are extremely rare at present.
Intelligent Speed Assistance (ISA) solutions are being developed to help drivers adhere to posted speed
limits. Such solutions would typically involve both sign-recognition video camera and a GPS-linked speed
limit database (ETSC). Implemented on a voluntary basis, the system would impose a resistance in the gas
pedal when the driver attempts to exceed the speed limit. The system can be overridden by pushing harder
on the gas pedal. ISA is seen as one of the most effective driver support systems to reduce the number of
road deaths (Vaa, Assum and Elvik, 2014). Its feasibility and positive benefit-to-cost ratio were confirmed
by Hynd et al. (2016). In 2018, the European Commission proposed that ISA is fitted on all vehicles sold in
the European Union. With the uptake of ISA, mechanisms for road rule compliance begin a shift from an ex-
NEW DIRECTIONS FOR DATA-DRIVEN TRANSPORT SAFETY – © OECD/ITF 2019SAFE SYSTEM AND VISION ZERO: THE ROLE OF DATA – 15
post criminal enforcement approach to an ex-ante product safety approach. Such a shift was anticipated by
ITF (2018d) in the context of autonomous vehicle regulation.
Figure 1. The Safe System approach to road safety
Source: Welle et al. (2018).
Following the exact same principle as ISA, geofenced speed regulations are now imposed on e-scooters in
some sensitive pedestrian areas in the USA. In Santa Monica, California, e-scooter operator Lime
automatically reduces scooter speed when a rider enters a geofenced area designated by the City, and
returning it to normal speed as soon as the rider exits the zone (Sun, 2018). Also in California, the City of
San Diego is proposing that e-scooter operators apply lower speed caps in sensitive pedestrian areas
defined by a geofence (Grass, 2018).
Broadening the benefits of automation
Train automation is seen as a solution to increase network capacity, and offers transport safety benefits at
the same time. Many driverless metros already exist and in 2018 the European Train Control System
(ETCS) successfully illustrated the capacity for Automatic Train Operations on the mainline railway during
passenger service (GRR, 2018).
Automation of road passenger and freight transport is likely over the medium term. Road safety gains could
be substantial if the deployment of the technology prevents human error and follows the Safe System
principles (ITF, 2018c). Yet, even in the most optimistic deployment scenarios, it will be decades before
autonomous vehicles have a substantial impact on road fatalities. This is due in part to the road safety crisis
being worse in countries where autonomous vehicles will likely come last.
This report therefore raises the question of what can autonomous vehicles do, even where they represent
say 1% of the fleet, to deliver safety benefits. The answer could be found in the utilisation of sensors fitted
on such vehicles towards a collective intelligence effort.
NEW DIRECTIONS FOR DATA-DRIVEN TRANSPORT SAFETY – © OECD/ITF 201916 – SAFE SYSTEM AND VISION ZERO: THE ROLE OF DATA
Protecting the most vulnerable road users
Pedestrians and cyclists are particularly fragile in the event of a crash. In the United Kingdom, one of the
few countries where data is available, their risk of fatality per unit distance travelled is more than ten times
higher than if they travelled in a passenger car (DfT, 2018). This over-representation becomes more acute
when considering what little threat pedestrians and cyclists present to other road users. They have
benefited very little from recent car safety improvements (airbags in cars, for example, offer them no
protection) and suffer the consequences of uptake of sport-utility vehicles (SUVs) in some markets.
Data-driven solutions for the protection of vulnerable road users are needed not only to protect them, but
also to promote walking and cycling. Indeed, the real and perceived risks of traffic injury deter people from
cycling or from letting their children walk to school, despite efforts from public authorities to encourage
walking and cycling as healthier, cleaner and more efficient mobility options.
Some have advocated the uptake of technologies that “wire-up” cyclists and pedestrians so that they may
be connected to the “smart” vehicular network in order to improve their virtual and real visibility to cars
and trucks. This raises equity concerns given that the most vulnerable and least dangerous road users are
asked to be responsible for their own safety while the most dangerous and least vulnerable road users are
under no such obligation. In terms of fairness and proportionality of responsibility, it seems that cyclists
and pedestrians should be “detected, not connected”.
Data-driven solutions for improving the safety of vulnerable road users should not require them to carry
specific equipment. Camera assisted vision, detection and warning systems seem more promising avenues
for rapid and innovative safety-improving pathways. Such systems can be mounted on vehicles or on the
roadside. Their value should always be benchmarked against direct vision, achieved through better vehicle
design, for instance.
Transit as a solution
Innovative techniques for the collection and analysis of big data already play a key role in transport
planning, as discussed by ITF (2015). As such, when data analytics support the adoption of public transport
and reduce the risk of road traffic crashes, they contribute significantly to reaching road safety targets.
In urban planning, transit-oriented development (TOD) is an approach which seeks to maximise the amount
of residential, business and leisure space within walking distance of public transport. This approach can
include building density regulations, parking policies, urban design, and first- and last-mile facilities that
support ridership and reduce auto dependency.
Where TOD principles create a transit-oriented community, residents are five-times less likely to be injured
or killed in road crashes than in automobile-dependent communities. A reason for this is the relatively low
risk of injury associated with public transport. In the United States, public transit commuters’ per mile crash
rates are ten-times less than those of automobile users (Litman, 2016). Data collected across the ITF Safer
City Streets network indicates that bus travel is safer than private vehicles, not only for passengers, but
also in terms of wider road safety impacts on third parties involved in collisions (Santacreu, 2018a).
Transit-oriented communities are also safer because they provide alternatives to private vehicle use for
individuals who consume alcohol, take medication or suffer from poor eyesight or any other condition that
may impede driving capacity. Alternative mobility options provide teenagers with substitutions for cars and
mopeds, and allow older people to stop driving when they wish. Transit-oriented developments include
facilities for walking and cycling, reduce traffic and further enhance the safety performance.
Overall, diminished dependence on private motor vehicles reduces traffic volumes and contributes to
transport safety (Ahangari, Atkinson-Palombo and Garrick, 2017; Litman, 2019). Traffic volume reduction
NEW DIRECTIONS FOR DATA-DRIVEN TRANSPORT SAFETY – © OECD/ITF 2019SAFE SYSTEM AND VISION ZERO: THE ROLE OF DATA – 17 has traditionally been overlooked as a road safety policy. Travel demand management, multi-modal planning and more efficient pricing should be accepted as Vision Zero policies. Car-dependent communities often result from poor land-use planning. Planners should seek to create denser neighbourhoods, and create permeability by means of a direct pedestrian and cycle network. Public transit is also a relevant solution to improve road safety in low- and middle-income countries. For instance, the introduction of the Macrobus, a mass transit system, in Guadalajara, Mexico, has led to a 46% decrease in road traffic injuries (WB, 2017). NEW DIRECTIONS FOR DATA-DRIVEN TRANSPORT SAFETY – © OECD/ITF 2019
18 – GATHERING INTELLIGENCE ON CRASHES AND INJURIES
Gathering intelligence on crashes and injuries
Traffic crash information is fundamental in diagnosing safety problems, assessing crash costs, monitoring
progress towards targets and guiding decision-making. Inaccurate crash records may bias the results of
traffic safety analyses, leading to misguided crash-prevention strategies and resulting in wasted efforts.
Including non-severe injury data, which are notably missing or inaccurate in many crash statistics, helps in
understanding how safety, or the lack of it, is experienced and perceived by people and how this impacts
their travel decisions.
Most countries rely on police data to count road traffic crashes, which results in systematic under-reporting
of injury data, especially slight injuries (ITF/OECD, 2011). The level of under-reporting varies according to
the profile of people injured, e.g. by mode or demographic group, which is skewing analytical results. Low-
income communities, where people often suffer from a lack of trust in the police force and insufficient
health insurance, are particularly likely to under-report crashes. Some crashes may simply be out of scope
for police data collection. For instance, national crash databases are typically designed to exclude
pedestrian falls.
In a report focusing on low- and middle-income countries, the World Bank (WB, 2017) identifies the lack of
reliable data as a challenge to understand the aggregate impact of road traffic injuries on economic growth.
It recommends improving surveillance systems such as data collection instruments to better assess the
causes, extents, and risks associated with road traffic injuries.
Merging data from police, hospital and insurance sources
Several sources of data exist to assess the number and characteristics of crashes as well as their health
outcomes: police records, coroner’s reports, and data from the insurance and health care sectors.
In low-income countries, 80% of road fatalities are not included in official statistics (Krambeck, Job and
Sultan, 2018). As a result, there is no trusted baseline against which authorities may monitor progress. In
response to the situation, the World Bank developed a tool for crash data management which:
links multiple agencies involved in recording road crash data—local government units, the police,
and the health system
standardises terms and definitions for reporting, and
provides analytical tools to support evidence-based investments and policies and to monitor the
impact of interventions (Krambeck, Job and Sultan, 2018).
The tool is called DRIVER (Data for Road Incident Visualization Evaluation and Reporting). It was developed
and deployed in the Philippines, and is now available on an open-source platform for other governments to
adopt. To further facilitate adoption, it feeds on free OpenStreetMap data. Tools such OpenStreetMap, a
collaborative project to create a free editable map of the world, are an essential building block towards the
implementation of road safety polices.
Hospital data
In many countries, hospital data are mainly used for medical purposes and seldomly for official statistics on
road safety (ITF/OECD, 2011). This is a missed opportunity. Yet things are slowly changing as more cities
and countries are now using hospital data to better assess the number of people injured in road crashes. In
the United States, for example, Portland officials collected data from emergency rooms across the county
during a four-month e-scooter trial to assess the number of associated injuries (PBOT, 2019). In the city of
Barcelona and in the French Rhone area, permanent data collection on crash circumstances is conducted in
NEW DIRECTIONS FOR DATA-DRIVEN TRANSPORT SAFETY – © OECD/ITF 2019GATHERING INTELLIGENCE ON CRASHES AND INJURIES – 19 hospitals. This dynamic benefits from the support of the European Commission, which seeks to accurately monitor the number of serious injuries across member states. The Commission promotes a harmonised injury severity scale across countries, the Abbreviated Injury Scale, which requires a medical assessment. Several challenges remain associated with hospital data collection. The main pitfall is when the source of injury is not rightly coded. Another challenge is the need for a consistent injury severity scale, essential for both monitoring and benchmarking purposes. Ambulance data Not all crashes require police intervention. However, many crashes not attended by the police do attract emergency medical services and open opportunities for gathering data. In such situations, ambulance services could encourage the victim to post a self-report to the police at a later stage. Emergency medical services could also share data electronically and systematically, to the police and highway authorities, on injuries resulting from falls and road traffic crashes. Initiatives involving electronic recording of ambulance patients already exist. They have been made possible by beforehand standardisation of ambulance data. In the United States, the National Emergency Medical Service Information System (NEMSIS) defined a standard for aggregated ambulance data, data that it stores and shares. In 2016, the NEMSIS database included over 30 million data points submitted by ten thousand ambulance agencies active in 49 US states and territories (NEMSIS, n.d.). In the United Kingdom, the National Health Service (NHS) sponsored a similar project. Completed in March 2014, it resulted in a new national standard for the structure and content of the clinical records of ambulance patients (College of Paramedics, 2014). Based on this standard, the implementation of electronic patient clinical records (ePCR) was discussed (Porter et al., 2018). While the aim of these efforts towards digitalisation and standardisation is to improve the health system’s efficiency through better cooperation between health providers, the resulting high-quality data could complement police and hospital sources to provide a more comprehensive understanding of road safety. Smartphones Smartphone apps are often used for journey planning and navigation. Citymapper, Google Maps and Moovit provide a number of options for a single destination and include multiple modes of transport. Strava, GeoVelo and Bike Citizens are dedicated to finding cycling routes. Specific apps could also be developed allowing users to report crashes they witness or are involved in, but it seems unlikely that large numbers of the public would install an app which is used only on extremely rare occasions. Instead, crash reporting solutions could be integrated in existing apps where citizens can report broader issues (such as FixMyStreet, described further down in this report). Bridging municipal boundaries, such apps should best be developed at the national level to gain and retain a large amount of contributors. Smartphone apps could ask their users to rate their journey in terms of safety. Citymapper, for example, already seeks to assess the security of late journeys. Partnership between app developers and governments could generate valuable insights. If and when wearable devices become widely adopted, such apps could seek to detect close call incidents through heart beat monitoring and crashes from accelerometer readings. They would later prompt the user to confirm if an incident happened and seek a self-report in this case. Less serious than crashes, yet more frequent, close call incidents significantly affect people’s quality of life and mobility choices. Collecting data on such incidents should be on the radar of policy makers (Aldred and Crosweller, 2015). NEW DIRECTIONS FOR DATA-DRIVEN TRANSPORT SAFETY – © OECD/ITF 2019
You can also read