Deciphering the laws of social network transcendent COVID 19 misinformation dynamics and implications for combating misinformation phenomena
←
→
Page content transcription
If your browser does not render page correctly, please read the page content below
www.nature.com/scientificreports
OPEN Deciphering the laws of social
network‑transcendent COVID‑19
misinformation dynamics
and implications for combating
misinformation phenomena
Mingxi Cheng, Chenzhong Yin, Shahin Nazarian & Paul Bogdan*
The global rise of COVID-19 health risk has triggered the related misinformation infodemic.
We present the first analysis of COVID-19 misinformation networks and determine few of its
implications. Firstly, we analyze the spread trends of COVID-19 misinformation and discover that
the COVID-19 misinformation statistics are well fitted by a log-normal distribution. Secondly, we
form misinformation networks by taking individual misinformation as a node and similarity between
misinformation nodes as links, and we decipher the laws of COVID-19 misinformation network
evolution: (1) We discover that misinformation evolves to optimize the network information transfer
over time with the sacrifice of robustness. (2) We demonstrate the co-existence of fit get richer and
rich get richer phenomena in misinformation networks. (3) We show that a misinformation network
evolution with node deletion mechanism captures well the public attention shift on social media.
Lastly, we present a network science inspired deep learning framework to accurately predict which
Twitter posts are likely to become central nodes (i.e., high centrality) in a misinformation network
from only one sentence without the need to know the whole network topology. With the network
analysis and the central node prediction, we propose that if we correctly suppress certain central
nodes in the misinformation network, the information transfer of network would be severely
impacted.
With the SARS-CoV-2 pandemic outbreak, COVID-19 related rumors and misinformation infodemic has
become a serious problem. The rapid spread of COVID-19 misinformation provokes the social panic, influences
political battles1, and propagates some dangerous false/fake rumors, e.g., drinking bleach to cure coronavirus2,
can cost lives. Academic researchers and government authorities are working intensively to fight COVID-19
infodemic by monitoring, identifying, analyzing, and blocking misinformation3–6. Commercial giants such as
Facebook7, Twitter8, Google9 are also trying to show their efforts in combating misinformation phenomena.
Along these lines, a recent mathematical model illustrates how governments and social media platforms’ efforts
can dis-incentivize the spread of fake news by social media u sers10. Previous w
orks11–13 analysing misinformation
or fake news focusing on misinformation sentences themselves are mainly from natural language processing
aspect, i.e., analyze sentiment, veracity, stance, etc. The social feature of misinformation such as how a piece of
fake news spreads from one account/website to its vicinity has also been studied from complex network and
statistics aspects14. Related machine learning problems such as fake news classification and social bot detection
are also well-studied15. Understanding how (COVID-19) misinformation evolves and spreads by combining both
natural language processing techniques and complex network analysis has not been well-studied.
Network science investigated extensively the mathematical characteristics of social (including collabora-
tion and c oauthorship16), technological (computer, World Wide Web17), biological, semantic18 and financial
networks19 and identified various connectivity mechanisms (e.g., linear and nonlinear preferential a ttachment20,
node fitness m odels21, weighted multifractal measure m odels22,23). Various examples exist of complex network
techniques applied to natural language processing tasks, and the ways of network construction are different in
diverse applications. However, few of these are taking care of full sentences and to the best of our knowledge,
we are among the first to analyze the time-varying networks. For example, a document can be converted into a
University of Southern California, Los Angeles, USA. *email: pbogdan@usc.edu
Scientific Reports | (2021) 11:10424 | https://doi.org/10.1038/s41598-021-89202-7 1
Vol.:(0123456789)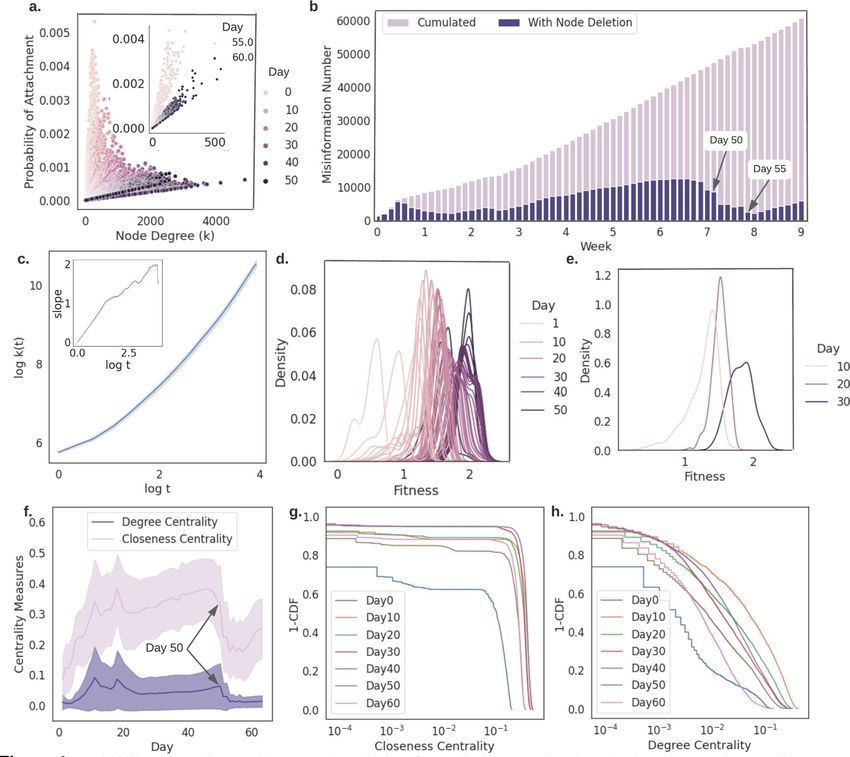
www.nature.com/scientificreports/
complex network where words are represented as nodes and relationships between words, such as s emantic24,
syntactic25, and/or co-occurrence26 relationships, are represented as edges. Another branch of research consid-
ers chunks of document, i.e., sequence of words, as nodes and similarities between sequences as e dges27. The
exercise of complex network in combination with natural language processing is diverse and most of the time,
the extracted complex network is time invariant. In contrast, here, we investigate the mathematical characteristics
of time-varying COVID-19 related misinformation network representations (we analyze three such network
constructions), where the nodes denote the misinformation sentences and the edges capture the sentence-to-
sentence similarity. This allows us to decipher the statistical laws that characterize the COVID-19 misinforma-
tion phenomenon.
Results
In this section, we present misinformation characterization, misinformation network evolution analysis, and
misinformation central nodes prediction. We first provide an analysis of the COVID-19 misinformation in terms
of popularity. We study the COVID-19 misinformation spread trends and discover that the misinformation
mean popularity data are, as a group, indistinguishable from an independently and identically drawn sample
from a log-normal distribution. We then present three ways of misinformation network construction and their
corresponding analysis. We find that newly constructed misinformation graphs evolve and optimize the net-
work information transfer over time. Formulation of misinformation network with node deletion might better
describe the rapidly changing reality of misinformation and reveals the need for new complex network models
and tools. At last, we present a deep learning-based misinformation network measures predictor that can work
in real time to predict network central nodes. With network centrality measures and our deep-learning predictor,
we can identify central nodes in misinformation networks with speed and accuracy, therefore we could combat
misinformation by removing those important nodes before they become vital.
Characterization. Statistical laws characterizing COVID‑19 misinformation phenomenon. Researchers
have noticed for decades that many measured data retrieved from biological and social sciences can be described
by log-normal distribution28,29 and power-law d istribution30. In this work, we estimate the log-normal and pow-
er-law models for 5 types of COVID-19 misinformation31: unreliable, political, bias, conspiracy, and clickbait
misinformation (Data was retrieved from https://usc-melady.github.io/COVID-19-Tweet-Analysis/misinfo.
html. Detailed dataset information can be found in Methods section “COVID-19 Misinformation Data”). We
use a hypothesis test32,33 to estimate model parameters and model plausibility ( pKS ). Estimation methodology
can be found in Method section “Power-law and log-normal analysis”. The estimated log-normal model has 3
parameters: xmin, which represents the smallest value above which the log-normal pattern holds, µ, which is
the expected value, and σ , the standard deviation. Similarly, the estimated power-law model has 3 parameters:
xmin, which represents the smallest value above which the power-law pattern holds, α, which indicates the scal-
ing parameter, and σ , the standard error of the fitted parameter α. The parameters of estimated log-normal and
power-law models are included in Fig. 1. However, these distribution fitting estimates do not represent that
the empirical data, i.e., mean popularity of misinformation in our case, are independent and identically drawn
(iid) from the fitted models30. We need to evaluate the plausibility of the fitted models quantitatively. Following
a standard assessment process, goodness-of-fit t est33, we find that pKS of log-normal distribution for all 5 types
of misinformation and the overall misinformation are much greater than 0.1. That is, log-normal distribution
cannot be rejected as a data-generating process.
To further ensure that log-normal rather than power-law distribution is the plausible data generating process,
we compare the log-normal distribution and power-law distribution using an appropriately defined likelihood
ratio test32. The likelihood ratio test provides two values: R, the log-likelihood ratio between the two candidate
distributions (log-normal and power-law in our case), and p, the significance value for the favored direction. If
the empirical data is more likely to obey the first distribution, then R is positive; otherwise, R is negative. The
favored distribution is a strong fit if p > 0.0532. As we reported in Fig. 1, log-normal is the favored distribution
since the R values are all positive and p in all likelihood ratio tests are much greater than 0.05. These findings
could suggest that the popularity of COVID-19 misinformation could obey a multiplicative process and resembles
the generalized Lotka-Volterra (GLV) system34. GLV systems are often used to model direct competition and
trophic relationships between an arbitrary number of species, e.g., a predator–prey relationship35. In this potential
misinformation GLV, all kinds of misinformation and individual misinformation generators, e.g., social bots,
may be constantly created (and distinguished), and compete with other members in the system for attention.
Misinformation networks optimize the network information transfer overtime. To characterize misinformation
on the semantic level, we construct misinformation networks where nodes and corresponding edges represent
the sentences and their sentence similarity, respectively (see Methods section “Misinformation network for-
mulation I” for network formulation details). The new misinformation captured in a day form a distinct mis-
information network. In order to investigate the network information transfer characteristics associated with
the dynamics of misinformation networks, we quantify their degree-, closeness- and second order-centrality
metrics36,37. Due to the complex networks’ highly heterogeneous structure, some nodes can be recognized as
more significant than others, and centrality measures how important a node is. For instance, in a social net-
work, influencers, recognized as influential nodes with higher centrality, have a lot of followers and can easily
propagate specific messages to other nodes. Therefore, calculating the centrality about networks sheds light on
information transfer analysis in complex networks38.
There are various centrality measures in complex network literature. Degree centrality measures the number
of links connected upon a target node and can be utilized to determine the throughput capacity or network
Scientific Reports | (2021) 11:10424 | https://doi.org/10.1038/s41598-021-89202-7 2
Vol:.(1234567890)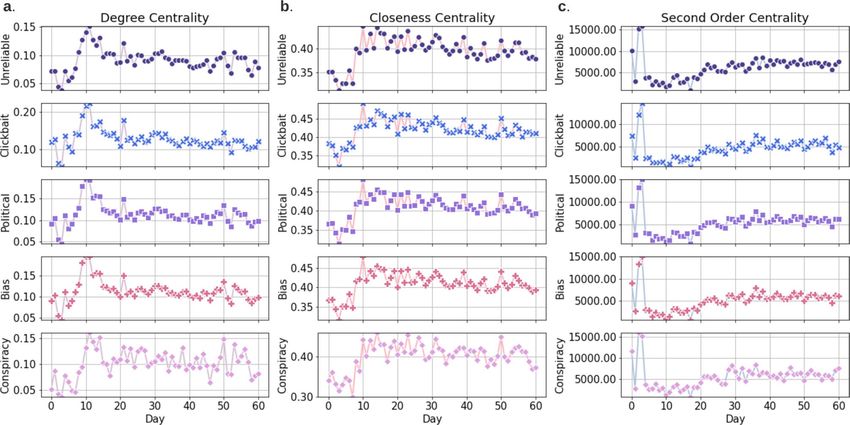
www.nature.com/scientificreports/
Figure 1. The fitted power-law model (red dash line) and log-normal model (green dash line) of the COVID-19
misinformation mean popularity. (a–e) Models fitted for different types of misinformation. (f) Models fitted for
all COVID-19 misinformation. Log-normal is a plausible data-generating process of the misinformation mean
popularity since the plausibility values pKS are greater than 0.1. Both goodness-of-fit test and likelihood ratio test
indicate that compared to power-law, log-normal is more plausible. (Detailed hypothesis test procedure is stated
in Methods section, “Power-law and log-normal analysis”.) The log-likelihood ratios (R’s) and significance values
(p’s) between the two candidate distributions, log-normal and power-law, are (0.422, 0.429), (0.911, 0.289),
(1.832, 0.245), (1.335, 0.352), (1.066, 0.369), (0.565, 0.203), for unreliable, political, bias, conspiracy, clickbait,
and all types of misinformation, respectively.
localized transmission. The higher the degree centrality is, the higher the chance to receive the information
transmitted over a network. Closeness centrality of a node quantifies the average length of the shortest path
between the node and all other nodes in a graph and reflects the information transmission latency across a
complex network. Thus, the higher the closeness centrality of a node is, the closer it is to other nodes. Second
order centrality is a random walk-based betweenness centrality which measures the average time for revisiting
a node if following a random walk on a complex network. The standard process of random walk is defined by
Newman39 where a single node has a probability to direct to a neighbor node (the probability is picked uniformly
at random). The higher the second order centrality of a node is, the more information paths pass through it and
the less robust the network is to targeted attacks on this node (for details on the degree-, closeness-, and second
order-centrality, see Methods section “Networks centrality measures”).
Figure 2a illustrates the mean degree centrality estimated from 60 misinformation networks. Over the first
10 days, the degree centrality of the misinformation networks exhibits an increase tendency towards higher
values. It is known that a node achieves an increase in degree centrality by establishing new connections to
its neighboring nodes. The high degree centrality of a node means that this node can propagate the received
information in an efficient way. Thus, the increasing phenomenon in the first 10 days demonstrates that the
misinformation networks tend to optimize their network topology to support higher information flow across
the network over time. In addition, when it comes to the last 50 days, the degree centrality enters a relatively
stable state which means that after increasing the degree centrality, misinformation networks try to maintain
the high speed spread property.
Along the same lines, Fig. 2b shows that the mean of the closeness centrality among 60 misinformation net-
works across 5 different misinformation categories. In the first 10 days, the mean value of the closeness centrality
for misinformation networks is increasing. Higher closeness centrality means that the target node is closer to
other nodes and the information sent by the target node can reach other nodes faster. Consequently, this result
shows that the misinformation network tends to optimize their network topology to minimize the information
transmission latency. In the last 50 days, the mean of the closeness centrality tends to stay stable, which indicates
that misinformation networks try to maintain superior transmission latency to keep the network in a high-speed
transport state. It is worth noting that the degree- and closeness-centrality are two dual approaches for quantify-
ing information transmission across a network and show a similar network performance optimization behavior
in the period of our observation.
Figure 2c shows the second order centrality mean value curves for the 5 misinformation categories in 60 days.
On social media, some people periodically delete some old posts. If a post that removed from the network has
high second order centrality, the misinformation network has a higher chance to be disconnected. In the first 10
Scientific Reports | (2021) 11:10424 | https://doi.org/10.1038/s41598-021-89202-7 3
Vol.:(0123456789)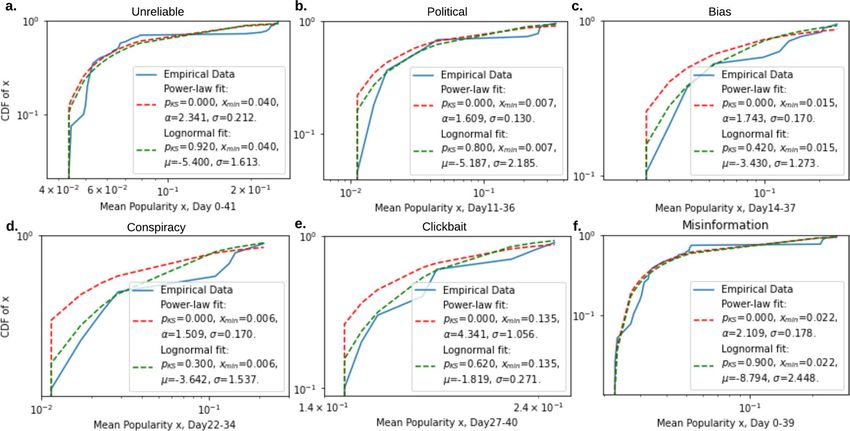
www.nature.com/scientificreports/
Figure 2. Misinformation network centrality measures. The mean value curves of the degree centrality (a),
closeness centrality (b) and second order centrality (c) for misinformation networks of 60 days across five
different misinformation categories: unreliable, clickbait, political, bias and conspiracy.
days in Fig. 2c, we observe that the second order centrality exhibits an irregular fluctuation behavior. When it
comes to the last 50 days, the second order centrality shows a saturation (slowing in increasing rate) trend, which
means that misinformation networks become less-robust/unhealthy over time (a graph is robust/healthy if it is
robust to multiple targeted/random a ttacks40). In addition, empirically, a robust graph has most of its elements
lying close to each other, and linked by many paths. We conclude that since misinformation networks tend to
increase the second order centrality after the early irregular fluctuation, the topology of the misinformation net-
works becomes more vulnerable to targeted/random attacks over time. In conclusion, the study of the degree-,
closeness- and second order-centrality shows that the COVID-19 misinformation networks tend to optimize the
information transmission and the topology of the networks becomes more fragile over time.
Co‑existence of fit get richer and rich get richer phenomena in misinformation network. Various mechanisms
have been studied to explain the complex network evolution, such as preferential attachment (PA), node fitness
theory, node birth/death process. The mapping of network growth onto a Bose-Einstein condensation phe-
nomenon elucidated three phases in the network evolution41: a scale-free phase, where all nodes in a network
have the same fitness; a fit get richer phase, where nodes with high fitness/quality are more likely to draw new
connections; and a Bose-Einstein condensate phase, where the node with largest fitness becomes a clear winner
and takes all the new links. In contrast to fit get richer effect, PA is a rich get richer mechanism where nodes
with more connections are likely to win more new connections in link c ompetition42. The General Temporal
model43 unifies both PA and node fitness by defining the probability of a node with degree k getting new links as
P ∝ Ak × η, where Ak is the PA function and η is node fitness (both Ak and η are time-invariant).
To show the first evidence of how misinformation network evolves under the assumption of co-existence of
PA and node fitness mechanism, we construct the misinformation network by taking the first day’s sentences and
construct a base network where nodes are sentences and links represent the sentence similarity. We then grow
the network by adding nodes and links as a function of time (days). New misinformation sentences appearing in
the next day connect to nodes in the base network if the sentence similarity is over 80%. We analyze the PA func-
tion Ak and node fitness η with P AFit43 and the results are shown in Fig. 3 (detailed network growth and analysis
methods are described in Methods section “Misinformation network formulation II”). The estimated node
fitnesses in day 10, 20 and 30 are all centered around 1, while there exists some nodes with slightly higher node
fitness. The heavy-tailed distributions serve as a clear sign of fit get richer effect. From Fig. 3a–c, the maximum
node fitness increases, which suggests that fit get richer effect becomes stronger, while the overall effect remains
low (the maximum value remains in a medium fitness range [1, 2]). By inspecting the estimated PA function in
the in-plots shown in Fig. 3, we make the following two observations: (1) the estimated PA functions Ak ’s in day
10, 20 and 30 are all increasing with respect to degree k, which suggests the existence of a rich get richer effect;
and (2) the estimated PA functions are exhibiting a log-linear trend, which matches the widely used log-linear
assumption of PA function Ak = kα as in extended BA m odel44.
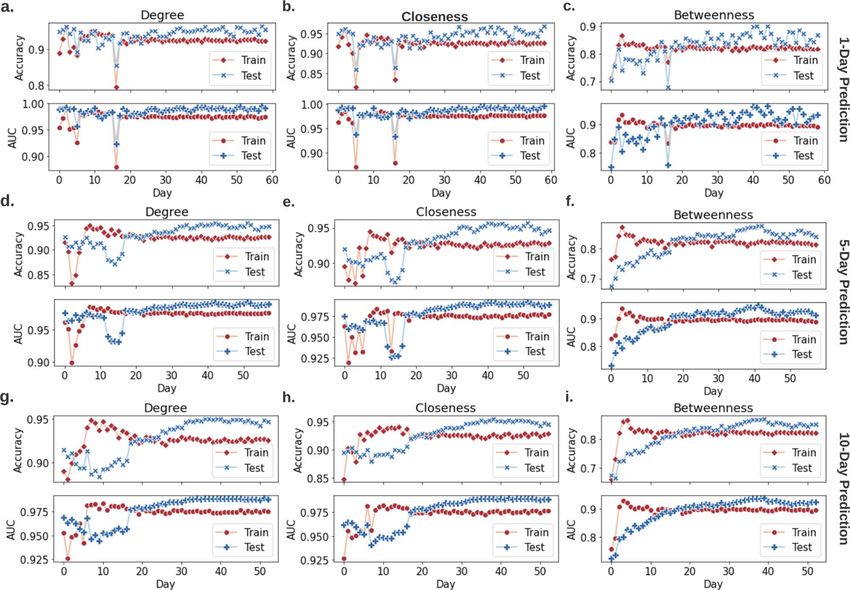
In misinformation network with node deletion mechanism, node fitness is time‑varying and probability of attach‑
ment is linear to node degree. While the complex network evolution is heavily studied in the literature, the
Scientific Reports | (2021) 11:10424 | https://doi.org/10.1038/s41598-021-89202-7 4
Vol:.(1234567890)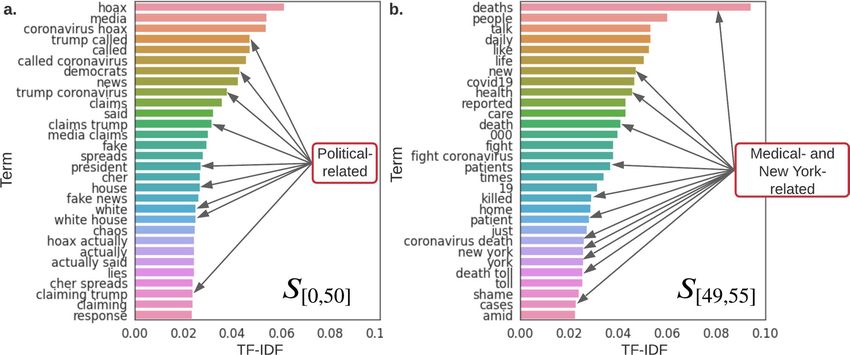
www.nature.com/scientificreports/
Figure 3. Node fitness and PA function (shown as in-plot) co-estimation for nodes in the misinformation
networks on days 10 (a), 20 (b) and 30 (c). The heavy tails of fitness distributions show the existence of the fit get
richer phenomenon. The estimated PA functions imply that the higher the node degree, the more competitive
the node is in terms of link competition; it also shows a rich get richer phenomenon.
popular models are mostly based on assumptions that PA function and node fitness are time-invariant, and the
fundamental network evolution does not consider node deletion mechanism or includes random node deletion
mechanism45. However, these assumptions are not fully applicable to rapidly changing misinformation networks
where people switch attention from one hot topic to another quickly. Under this consideration, we form our
misinformation network with a realistic node deletion mechanism, i.e., when a node’s degree is not changing for
three days, we delete the node (and its attaching links) from the network with the assumption that this sentence/
topic is no longer active or popular at the time. (Detailed network formulation and analysis methods are
described in Methods section “Misinformation network formulation III”.) Based on this network formulation
method, we estimate the probability of attachment of nodes, node fitness, and network centrality measures and
the results are demonstrated in Fig. 4. Firstly, we estimate the probability of attachment of node j as ki kj as in
j
the BA model46, where k represents the degree of a node. We find that different from other real-world networks,
such as WWW, citation networks, the attachment probability in misinformation networks is linear with respect
to node’s degree as shown in Fig. 4a instead of log-linear. This implies that the misinformation network evolution
with the consideration of node deletion has weak rich get richer phenomenon. In addition, we observe that the
misinformation network evolution experiences expansion-shrink cycles. The slope of the probability of attach-
ment first decreases from day 0 to day 50, then increases to the similar values as in day 0 on day 55. This sudden
change between days 50 and 55 shows that the network experiences a destruction and reconstruction phase. We
verify this observation by inspecting the network size as shown in Fig. 4b, where the light purple bars represent
the cumulative sum of newly emerged misinformation on Twitter (i.e., the afore-mentioned misinformation
network constructed in Methods section “Misinformation network formulation I”), and the dark purple bars are
the node numbers in the misinformation network constructed with node deletion mechanism. The light purple
bars equivalently demonstrate how the misinformation network expands under classical network formulation,
which cannot reflect the rapidly changing nature of misinformation network. On the other hand, the dark purple
bars demonstrate the network evolution under our realistic misinformation network construction method. It is
verified by the dark purple bars that the network does experience a shrink-expand phase between day 50 and 55.
In addition, the fluctuations in node centrality measures in Fig. 4f also provide verification. Furthermore, we
hypothesize that topic/attention shifting on social media causes this destruction and reconstruction, and we
provide evidence in the following discussion and in Fig. 5.
Next, we investigate the node fitness and observe that on day 51, all sentences from day 0 (used for base net-
work) were deleted except one. It is worth noting that we construct our network based on sentence similarity, if
some nodes (sentences) in the network do no relate to the newly emerged misinformation, then these nodes are
removed from the network. Equivalently speaking, topics or misinformation that are not gaining attention do not
fit anymore and will be removed from the misinformation network. If a large-scale node deletion appeared, the
misinformation network may experience a destruction phase as we observed previously. Node fitness measures
the node quality and reflects the node competitiveness41, therefore, we inspect all sentences that survived by day
50 (denoted as S[0,50]) and disappear on day 51, and estimate their fitness by tracking the node’s accumulated
degree over time k(t). The slope of k(t) in a log-log scale, i.e., growth exponent, is therefore equivalent to node
fitness45 (detailed estimation strategy of node fitness is given in Methods section “Misinformation network
formulation III”). Figure 4c–e present the estimated node fitness values and distributions of S[0,50]. We find that
before a node deletion, its fitness is increasing until two days before deletion. This observation is distinct from
the fit get richer phenomenon usually assumed in traditional complex networks without node deletions. When
rich get richer and fit get richer are both in play, nodes with high fitness have a higher probability to attract
new links and become rich nodes; then, rich nodes reinforce the effect. However, in our network, the rich get
richer effect becomes weaker in a cycle, while fitness grows higher. Then, suddenly the nodes with high fitness
Scientific Reports | (2021) 11:10424 | https://doi.org/10.1038/s41598-021-89202-7 5
Vol.:(0123456789)
www.nature.com/scientificreports/

                                            Figure 4.  Probability of attachment (a), network evolution (b), node fitness estimations (c-e), and network
                                            centrality measures (f-h) of misinformation networks with deletion mechanism. (a) The probability of
                                            attachment is linearly correlated with the node degree. From day 0 to day 50, the probability of attachment for
                                            nodes with same degrees is decreasing. This observation shows that the rich get richer effect becomes weaker.
                                            Then the probability of attachment from day 55 appears to be similar as in day 0 to 10. (b) Misinformation
                                            network size (node) evolution comparison. Different from classical network expansion method (as shown in
                                            light purple bars), our realistic network construction method with node deletion mechanism appears to be
                                            sensitive to public attention/topic shifting. (c) The evolution of 158 surviving nodes S[0,50]’s accumulated degrees,
                                            k(t) over time. Node fitness is approximated as the slope and it increases from day 0 until day 49 as shown in
                                            in-plot. This finding is distinct from the frequently used time-invariant fitness assumption in complex network
                                            evolution models. Hence, we further inspect the fitness (growth exponent) distribution of S[0,50] as shown in
                                            (d). These distributions do not have heavy tail property, which indicates that there is no clear sign of fit get
                                            richer phenomenon. Moreover, to compare with fitness distribution we observed in Fig. 3 more clearly, in (e),
                                            we inspect the fitness distributions of S[0,10], S[0,20], and S[0,30], which correspond to the misinformation network
                                            (with node deletion) on day 10, 20, and 30. We find that these non-heavy tail distributions again indicate that
                                            there is no clear sign of fit get richer effect. (f–h) Network centrality measures. Degree centrality first increases
                                            then becomes stable until day 50. This confirms that the rich get richer effect is weak. The closeness is slightly
                                            increasing with regard to time and indicates that the newly added nodes lower the average of the shortest path .
                                            Nodes with low fitness are deleted in the process, and nodes that survived must maintain high fitness to be close
                                            to new nodes. This matches the observations in (b–c).

          Scientific Reports |   (2021) 11:10424 |               https://doi.org/10.1038/s41598-021-89202-7                                                    6

Vol:.(1234567890)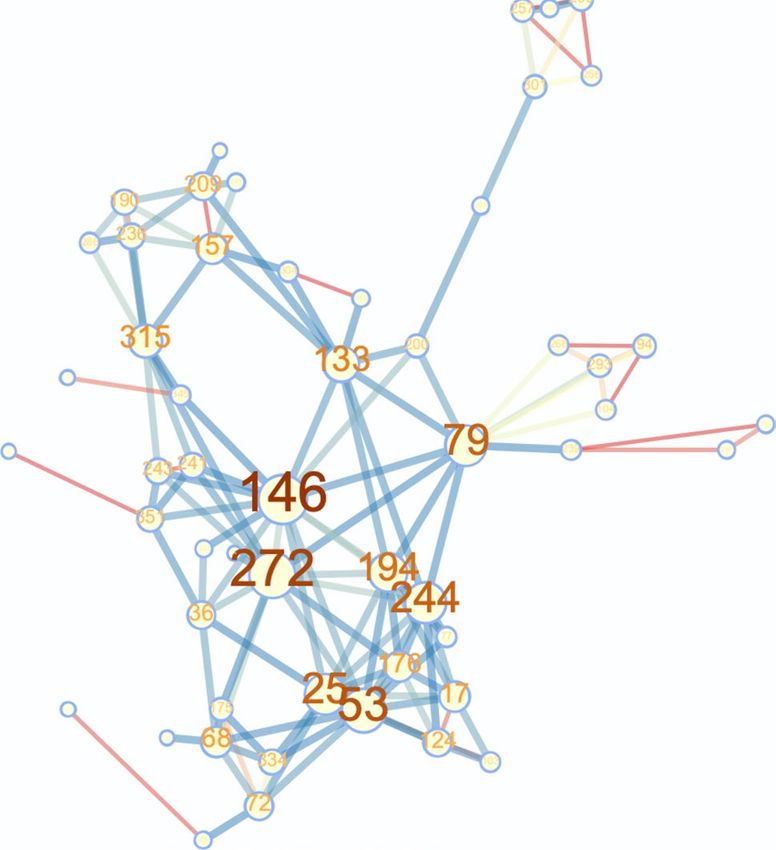
www.nature.com/scientificreports/
Figure 5. Top words in S[0,50] (a) and S[49,55] (b). Top words are the words with the highest TF-IDF scores
and represent the most influential and important words/topics in sentences. We take n = 1 and 2 for n-grams,
therefore, in the results there exist unigrams and bigrams. We find that sentences that survived from day 0 to
50 mainly discussed political-related topics, and sentences that survived from day 49 to 55 are more discussing
non-political- or medical-related topics. Specifically, 75.31% in S[0,50], and 41.50% in S[49,55] are discussing
political-related topics, respectively. This shift of topic may in fact is the reason for cyclical behavior of
probability of attachment we discovered in Fig. 4a.
are deleted at the end of one network evolution cycle. This distinct misinformation network behavior cannot
be explained by conventional network models, and may be caused by the rapid attention shift characteristic of
social media as we discussed.
We further investigate several hot topics in order to validate the above-mentioned hypothesis on misinfor-
mation network evolution. We manually inspect the sentences that survived in the network from day 0 to day
50, noted as S[0,50]. Since S[0,50] are all deleted from the network on day 51, and considering our misinformation
network construction method, there will be no new links attached to S[0,50]. We also study sentences collected
on day 49 that managed to survive to day 55, denoted by S[49,55]. We compare the top words, i.e., the words with
highest TF-IDF (term frequency-inverse document f requency47) scores, in S[0,50] and S[49,55] as shown in Fig. 5.
We find that political words appear the most in the top 30 words of S[0,50] (e.g., “Trump”, “president”, “white
house”-related phrases appear about 9 times). In comparison, no political words exist in S[49,55]’s top 30 words.
This evidence shows that public attention shifts from political-related content to non-political in the time period
we investigated. Furthermore, we find that “New York”-related phrases along with medical words such as “deaths”,
“killed”, “patients”, “cases” represent the majority of the top 30 words of S[49,55]. Which matches the COVID-19
break out in New York from April 18th to 24th. These examples confirm that our network construction method
with node deletion mechanism can capture the actual misinformation network evolution. In addition, our net-
work formulation is more sensitive to rapid network changes, e.g., the public attention shift, than classical PA
or fitness-based network models.
Prediction. Deep learning methods accurately predict in real time, which Twitter posts are the central nodes in
the misinformation network. Complex network measures such as centrality are calculated based on network
topology, i.e., adjacency matrix. However, these metrics are highly computationally expensive and require the
adjacency matrix information. In this work, we construct misinformation networks where nodes are sentences,
hence, we hypothesize that network measures can be predicted by deep learning and natural language process-
ing (NLP) methods by considering as inputs only the sentences (without adjacency matrix). We verify that
complex network metrics of misinformation networks can be easily predicted with high accuracy using deep
neural networks (DNNs). In our centrality prediction, to predict day(s) t’s central nodes, we take daily mis-
information networks from day t=0 up to day t-1 as training data, and the trained DNN outputs predictions
for day(s) t. Specifically, we perform 1-day, 5-day, and 10-day prediction, meaning that for example, in 5-day
prediction, if we predict central nodes from day 20 to day 25, we take daily misinformation networks from day
0 to day 19 as training data. In addition, instead of feeding DNN with adjacency matrix, we utilize techniques
from natural language processing and feed the DNN with sentence embeddings, specifically, BERT embeddings
(training setup can be found in Methods section “Deep learning-based misinformation network measures pre-
diction”). Throughout this process, there is no need to run time-consuming network analysis algorithms, and
DNNs predict network measures with high accuracy in real time. Specifically, in 1-day prediction, our DNN
predicts degree centrality, closeness centrality, and betweenness centrality, with 94.19 ± 0.03%, 94.25 ± 0.04%,
83.25 ± 0.22% accuracies, and 98.54 ± 0.01%, 98.47 ± 0.01%, 90.44 ± 0.21% AURoCs, respectively, as shown in
Fig. 6. The key contributor to this outstanding result is the extracted natural language features in rumors. We
believe that the trained neural network learns the syntactic and semantic patterns of influential tweets. This find-
ing enables real time misinformation combat by online identification of fast-spreading and influential misinfor-
Scientific Reports | (2021) 11:10424 | https://doi.org/10.1038/s41598-021-89202-7 7
Vol.:(0123456789)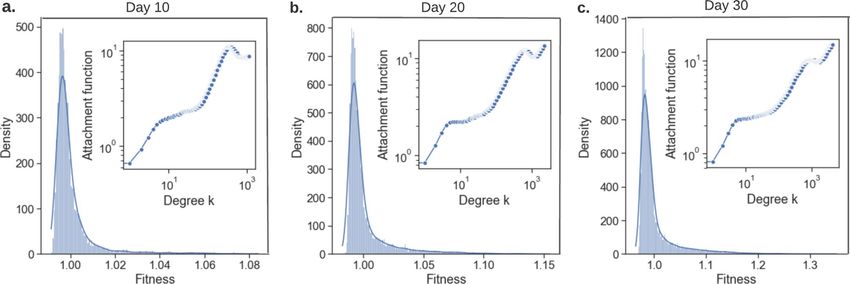
www.nature.com/scientificreports/
Figure 6. Centrality predictions of daily misinformation networks. To predict day(s) t’s central nodes with
respect to degree, closeness, or betweenness centrality, daily misinformation networks prior to day(s) t are used
as training data. Instead of network topology, e.g., adjacency matrix, we take the natural language embedding of
each misinformation as the input to the DNN. The DNN then predicts which nodes are going to be the top 100
central nodes in day(s) t. E.g., in 1-day prediction, we predict day 10’s top nodes based on day 0–9’s information;
and in 5-day prediction, we predict days 5–10’s top nodes based on day 0–5’s information.
mation. With an online misinformation detection mechanism, we can utilize the proposed deep learning-based
network measure predictor to quickly identify, filter, and delete significant sentences before they actually become
the central nodes. Therefore, break the misinformation network before it forms.
Discussion
Researchers have noticed for a very long time that many measured data retrieved from biological and social
systems can be described by log-normal d istribution28,29, e.g., survival time after cancer d
iagnosis48, number of
words per sentence for writers49, and size of holes in cocoa cake29. During the last decade, power-law distributions
are often observed as well, e.g., size of wars30. In this work, we analyze the trends of COVID-19 misinformation
spread and discover that the log-normal distribution cannot be rejected as a plausible model for misinformation
mean popularity data. With COVID-19 credible and unreliable information pushed to smart devices in real time
across the globe, the true/false information constantly competes for finite collective attention in this COVID-
19 infodemic. The log-normal distribution may suggest that the popularity of COVID-19 misinformation can
obey a multiplicative process and resembles to the GLV, where individual misinformation and generators born
and die, and compete for attention. These inspirations could contribute to the future analysis of misinformation
collective attention and GLV related modeling and control.
To further decipher the laws behind COVID-19 misinformation network evolution, we construct misinforma-
tion networks through three different strategies and analyze these networks from information flow and network
evolution aspects. We first construct misinformation networks where nodes are misinformation sentences col-
lected within one day, and links represent their sentence similarity. Each network represents the misinforma-
tion that appeared on Twitter within one day and the inspection of these networks shows how the COVID-19
misinformation evolves. Analysis of the network centrality measures, i.e., degree centrality, closeness centrality,
and second-order centrality, shows that misinformation first learns to optimize information transfer to be more
efficient and then maintains the fast-spreading property. Compared to true information, researchers found that
misinformation/fake news spreads differently even in early s tages50. In addition, false news is discovered to be
more novel and spread faster than true n ews51. In our work, we showed from the information transfer aspect
Scientific Reports | (2021) 11:10424 | https://doi.org/10.1038/s41598-021-89202-7 8
Vol:.(1234567890)www.nature.com/scientificreports/
that misinformation does evolve to be fast-spreading. However, the optimization of information transfer comes
with a price, sacrificing the network robustness. In addition, centrality measures reveal the important nodes/
influential misinformation in the network, which lay down the foundation of misinformation control. Currently,
the estimation of centrality measures is not only time-consuming, but also requires complete information about
the topology (e.g., adjacency matrix) of the misinformation networks. Therefore, with sentences as nodes and
sentence similarity as links, we propose a deep learning method to predict the centrality measures with the input
of sentence only. Utilizing this method, we can predict the next hot topics or central nodes without the need of
knowing the whole network topology52, which allows us to filter the potential influential misinformation before
it actually becomes a center of attention. Researchers have expressed the concern about blocking information on
COVID-19 that blocking can in turn fuel the spread of misinformation53. This can be true from the perspective of
network information flow revealed in this work. If wrong nodes, e.g., certain nodes with low centrality measures,
are deleted from the network, the information transfer of the whole network might be enhanced. In contrast, if
we correctly remove certain central nodes, then the information transfer of network would be severely impacted.
After inspecting the misinformation evolution in terms of information transfer, we construct the second series
of misinformation networks, where we grow the network from a base network. We first form the base network
with day 0’s misinformation. Then we add day 1’s misinformation to the base network; and we grow the network
with regard to time (days). With the well-established network science methods, PA and node fitness theory, we
find the co-existence of fit get richer and rich get richer phenomena. However, this way of network construction
may not capture the true nature of the fast-changing feature of misinformation network due to lack of node
deletion mechanism. Without node deletion, the time measure is ignored and a hot topic will remain popular
regardless of time, and this is in contradiction with the fact that public attention may shift.
To reveal the true nature of the rapidly evolving misinformation network, we propose a third way of mis-
information network construction which grows the topology from the base network, while including the node
deletion mechanism to reflect that public may forget things. The determination of the node fitness and probability
of attachment show distinct evolution behavior that is not fully explainable by fit get richer and rich get richer
effects, i.e., some nodes with high fitness do not attract new connections and are deleted from the network. This
distinct behavior may be caused by the public attention shift from one hot topic to another. We also find that
different from the time-invariant assumptions in node fitness and PA theories, our misinformation network
changes rapidly as well as the node fitness and the probability of attachment. These observations reveal the need
for new theoretical network models that can characterize and explain the real world fast-evolving networks such
as misinformation networks; and also link the collective attention with network science.
Furthermore, rumors are likely to have fluctuations over time54. With the node deletion mechanism, we
observe evolution cycles of the misinformation network. The size of the misinformation expands and shrinks
cyclically. We also find that the misinformation topics that survived in the network are mostly politically moti-
vated. Our study provides a comprehensive data-driven and data science validation and invalidation of the
hypotheses enunciated in55. Determining in advance potential targets for fake news is an important aspect of
misinformation control56. We hope by identifying long-lasting, influential, fast-spreading misinformation in the
network, we can help fight the COVID-19 and future infodemics by breaking the network before the increasingly
popular nodes become influential; and control the misinformation by inserting combating information into
the network. Lastly, through three different network formulations, we find limitations of current widely-used
network models and researchers should study alternative novel strategies to properly construct networks from
observations.
We believe the findings and analysis of this work contribute new knoledge to the current state-of-the-art fake
news/rumor/misinformation research and inter-discipline studies of natural language processing and complex
networks. In the future, we foresee that our findings and models can also contribute to fruitful technologies that
help combat misinformation, identify fake news in early stages, forecast how popular fake news evolves, spreads,
and shifts the public opinion during important events. For instance, as we have exemplified with our deep learn-
ing framework, these results can be exploited for developing a technology for detecting and forecasting popular
opinions that are likely to become dominant or influential in a fast-evolving heterogeneous network. With our
network analysis, to make fake news network to destroy itself, we can insert real news in the network at the lowest
price and remove significantly influential false news nodes from the network with the highest reward. However,
aside from the positives, more problems need solutions, and more questions require answers. In reality, given
that we can only partially observe the misinformation or information network, how can we design accurate and
efficient algorithms to reconstruct the whole network from partial, scarce, uncertain, and noisy observations?
With strategies to monitor accounts and information flow, how to control the network to make users aware of
something? How can we control multiple interacting opinion dynamics that are evolving rapidly? In our future
work, we will make an effort to tackle these issues, and in particular, misinformation combating problem, study
the interaction between true and false information.
Methods
COVID‑19 misinformation dataset. We analyzed a COVID-19 misinformation dataset containing mis-
information collected from Twitter from March 1st to May 3 rd31. The data was retrieved with Twitter API service
(https://developer.twitter.com/en/docs/tweets/filter-realtime/guides/basic-stream-parameters) using keywords
related to COVID-19: ‘Covid19’, ‘coronavirus’, ‘corona virus’, ‘2019nCoV’, ‘CoronavirusOutbreak’, ‘coronapoca-
lypse’, from the platform in real time. We used in total 60798 pieces of misinformation identified to build our
misinformation networks. There are 6 categories in the retrieved dataset: unreliable, clickbait, satire, bias, politi-
cal, and conspiracy. More specifically, the unreliable category is defined to include false, questionable, rumorous
and unreliable news. Conspiracy category includes conspiracy theories and scientifically dubious news. Clickbait
Scientific Reports | (2021) 11:10424 | https://doi.org/10.1038/s41598-021-89202-7 9
Vol.:(0123456789)www.nature.com/scientificreports/
Figure 7. An example misinformation network with 50 nodes (misinformation sentences).
news is misleading, distorted or exaggerated to attract attention. Political and biased news are in support of a
particular point of view or political orientation. In addition, satire is based on the consideration that satire has
the potential to perpetuate misinformation57,58. However, due to the fact that satire category is extremely small
(only 29 tweets are labeled as satire), our analysis only focuses on the other five types. We note that in Fig. 1, the
last category “misinformation” contains all the misinformation categories including satire.
Power‑law and log‑normal analysis. In this section, we describe the methodology of power-law and
log-normal fitting of misinformation mean popularity data. The popularity of a misinformation sentence (tweet)
is the number of times it appears on Twitter in the time span of dataset, March 1st to May 3rd. The mean popu-
larity is taken across all misinformation records. There are 5 major types of COVID-19 misinformation in the
dataset: unreliable, political, bias, conspiracy, and clickbait. We analyze the power-law and log-normal fits with
regard to all 5 types individually and as a whole. By using the powerlaw Python package33, we perform a statisti-
cal hypothesis test analysis as follows: (i) we estimate the parameters, e.g., xmin, α, of the power-law model and
the log-normal model via powerlaw. (ii) We calculate the goodness-of-fit between mean popularity data and
the power-law (and log-normal). Specifically, we inspect a plausibility value pKS in goodness-of-fit test. If pKS is
greater than 0.1, the power-law (or log-normal) is a plausible hypothesis for the data. (We will describe how to
calculate pKS in detail later.) (iii) We compare hypotheses, power-law and log-normal, via a likelihood ratio test
provided in powerlaw, e.g., R, p = distribution_compare(′ lognormal ′ ,′ powerlaw ′ ), where R is the log-likelihood
ratio between the two candidate distributions. If R > 0, then the data are more likely to follow the first distribu-
tion, otherwise the data are more likely to obey the second distribution. p is the significance value for that direc-
tion. The favored distribution is a strong fit if p > 0.05.
Now we describe the procedure of goodness-of-fit test and the calculation strategy of pKS32. Given a dataset
and the hypothesized distribution, e.g., power-law, from which the data are drawn, we calculate pKS based on
measurement of the “distance” between the distribution of the empirical data and the hypothesized model. This
distance D is given by powerlaw when we fit the data, which is the “Kolmogorov-Smirnov (KS)” statistic. Next,
we generate a large number of power-law synthetic data with the estimated parameters and we fit the synthetic
data using powerlaw. After fitting the synthetic data, we get the distance of synthetic data and the hypothesized
power-law model (fitted by the synthetic data), noted as Dsyn. Then we repeat this procedure by generating 50
sets of synthetic data with 50 Dsyn’s. Finally we calculate pKS as the percentage of D < Dsyn.
Misinformation network formulation I. We form networks of new misinformation with respect to time
(days). We construct 60 COVID-19 misinformation networks based on misinformation identified on Twitter
from March 1st to May 3rd31 (days with missing data are discarded). Nodes in a network are sentences, i.e.,
COVID-19 misinformation, appearing within one day on Twitter. Nodes are connected if two sentences have
similarities more than 70%. We provide a sample network in Fig. 7, along with original sentences of the top 10
most connected nodes in Table 1. To calculate sentence similarity, we first encode sentences by sentence Trans-
former model59 into vectors with length 786. Then, we measure sentence similarity based on cosine distance.
Each misinformation network contains new misinformation that appeared on Twitter per day, and we analyze
Scientific Reports | (2021) 11:10424 | https://doi.org/10.1038/s41598-021-89202-7 10
Vol:.(1234567890)www.nature.com/scientificreports/
Node Corresponding Misinformation
146 “MOORE, as usual, IS LYING!!Michael Moore: Trump Is Making Coronavirus ‘Partisan’ While Sick People Can’t Get a Test.”
272 “Top Science journal fires off an unusual barrage against Trump for his ‘dangerous’ distortion of coronavirus facts.”
79 “Patton Oswalt Jokes About Trump Supporters Dying of Coronavirus - Big League Politics.”’
53 “Conservative angrily pins blame on ‘Captain Chaos’ Trump for making coronavirus fallout worse than it should be.”
25 “Schumer on Coronavirus: ‘We Are Very Worried About the President’s Incompetence’ This guy is an idiot!”
244 “Congressman erupts on Trump’s health officials for not correcting his ‘bizarre’ lies about coronavirus - Raw Story.”
194 “Congressman erupts on Trump’s health officials for not correcting his ‘bizarre’ lies about coronavirus.”
133 “Donald Trump Jr accuses Hunter Biden of dodging child support as Biden blames coronavirus for skipping court.”
315 “Trying to Cover His Tracks? Trump Reportedly Ordered Coronavirus Talks Classified Common Dreams News.”
157 “‘Stealth attack on Social Security’: Trump condemned for exploiting coronavirus crisis to push tax cut – Raw Story.”
Table 1. Top 10 most connected nodes (and their corresponding tweets) in the example network shown in
Fig. 7.
network features of these networks to characterize how misinformation evolves over time. This distinct choice of
network construction comes from the fact that we would like to see how the public opinion and misinformation
trends are shifted or evolved from a natural language processing point of view while assuming the emergence
of new collective intelligence phenomena. This way of network construction helps us to predict next popular
misinformation phenomenon on the social media and helps to combat them.
Misinformation network formulation II (without node deletion) with PA and node fitness anal‑
ysis. We construct a misinformation network to capture the evolution of misinformation appeared on Twit-
ter in March 2020. Firstly, we form a base network containing misinformation extracted on March 1st, with
the nodes representing misinformation sentences and links indicating the text similarity between two misin-
formation. We then add nodes and links to the base network based on misinformation extracted from Twitter
on the daily basis. Note that we connect the nodes when the text similarity is more than 80% to constrain the
network size within a reasonable scale for later analysis. Having the misinformation network, we report the first
evidence of co-existence of rich get richer and fit get richer effect in COVID-19 misinformation networks by
using PAFit43, a general temporal model. To co-analyze both PA and node fitness of a complex network (with the
assumption that both fit get richer and rich get richer exist), the probability of a node attracting a new connec-
tion is P ∝ Ak × η, where Ak is the PA function and η is node fitness (both are time-invariant). The estimation
tasks of Ak and η are performed by the R package PAFit.
Misinformation network formulation III (with node deletion) with the probability of attach‑
ment and node fitness analysis. Similarly to the network growth procedure without a node deletion
mechanism, we have a base network containing misinformation collected on March 1st . Then differently than the
afore-mentioned monotonic growing process, we include a node deletion mechanism as follows: if a node (sen-
tence) does not attract new connections in δ consecutive days, we remove this node from the network along with
its all edges. The statistics comparison between networks extracted using formulation I-III are shown in Fig. 8.
We take δ = 3 in this work and links exist only when the text similarity of two nodes is over 80% to keep the
reasonable size of the misinformation network. We keep track of this misinformation network from March 1st
to May 3rd and estimate the probability of attachment and node fitness. The general temporal model, PAFit, used
to measure the misinformation network without node deletion assume the co-existence of fit get richer and fit
get richer based on time-invariant PA function and node fitness. However, it may not be applicable to the misin-
formation network with node deletion. Therefore, we estimate the probability of attachment of each node every-
day as ki kj using Barabasi-Albert model, where i is the target node and j represents all other nodes in the net-
j
work. Node fitness represents how attractive a node is in the network, and it can be estimated as the growth
exponent β45. Following Kong et al’s w ork45, assume the cumulative degree of a node i at time t is k(i, t), and its
logarithm reads: logk(i, t) = ( A − 1−c
ηi c
)logt + B = βi logt + B, where A and c are constants, B is some time-
invariant offset. From this equation, node fitness and the growth exponent are related by a linear transformation,
hence the slope of k(i, t) gives an estimation of node fitness value.
Deep learning‑based misinformation network measures prediction. We utilize both deep learn-
ing and natural language processing techniques to enable fast network measures prediction. Our DNN takes
daily misinformation networks from day 0 to day t − 1 as training data and predicts which misinformation in
day(s) t will end up as central node. The input to our DNN is misinformation sentence embeddings, i.e., BERT
embeddings with length 786. The output of our DNN is binary where 0 and 1 indicate a tweet (i.e., a node in a
misinformation network) is with low centrality or high centrality, respectively. Our training data is obtained as
follows. With 60 misinformation networks, we calculate the centralities via traditional complex network analysis
mechanism and take nodes with top 100 centrality measures and label them as 1, otherwise label them as 0.
Hence, the training data are misinformation sentences with binary labels. With this way of labeling, the train-
ing data end up with imbalanced classes, therefore, we up-sample the minor class to balance the data prior to
training. After data balancing, we train a DNN with 3 hidden layers to do binary classification, i.e., to classify if a
Scientific Reports | (2021) 11:10424 | https://doi.org/10.1038/s41598-021-89202-7 11
Vol.:(0123456789)www.nature.com/scientificreports/
Figure 8. Statistics comparison between networks constructed by formulation I–III. (a–c) Node number
comparison. (d–f) Edge number comparison. We can see that the cumulated misinformation networks (with
and without node deletion mechanism) are larger in scale and contain much more nodes and edges compared to
daily misinformation networks.
misinformation sentence is “important” or not. The architecture of our DNN is IN(786)-FC(32)-Dropout(0.5)-
FC(32)-Dropout(0.5)-FC(32)-Dropout(0.5)-OUT(2), where IN, FC, Dropout, OUT represent input layer, fully-
connected layer, dropout layer, and output layer, respectively, and the number in parenthesis indicates the num-
ber of neurons or dropout rate. Fully-connected layers all use ReLU as activation function and output layer uses
softmax as activation function. We utilize early stopping training technique to prevent overfitting.
Network centrality measures. The network centrality measures the importance of a node across a
complex network. In this study, the network centralities are calculated by the NetworkX package in the Python
library60. The degree-, closeness-, and second order-centrality are introduced as follows:
Degree centrality61 is of node n is defined as:
Degree(n) = deg(n) (1)
where deg(n) is the number of edges connected with the node n.
Closeness centrality62 of a node measures its average inverse distance to all other nodes and is a way of detect-
ing nodes that can transport information across the network efficiently. The closeness centrality of a node n can
be defined as follows:
1
Closeness(n) = (2)
u d(u, n)
where d(u, n) is the distance between node u and node n. Of note, u = v.
Second order centrality37 is a kind of random walk based centrality which measures the robustness of the
networks. The centrality of a given node n is the expectation of the standard deviation of the return times to the
node n of a perpetual random walk on graph G, where the lower that deviation, the more central the node n is.
Received: 10 February 2021; Accepted: 21 April 2021
References
1. Donovan, J. Social-media companies must flatten the curve of misinformation. Nature (2020).
2. Tony, R. Facebook will remove misinformation about coronavirus (2020). https://www.washingtonpost.com/technology/2020/
01/30/facebook-coronavirus-fakes/.
3. Caulfield, T. Pseudoscience and covid-19-we’ve had enough already. Nature (2020).
4. Subhra, P. Fighting the coronavirus misinformation epidemic. Nature India (2020).
5. Cheng, M., Yin, C., Nazarian, S., & Bogdan, P. From rumor to genetic mutation detection with explanations: a GAN approach.
Scientific Reports 11.1 (2021): 1-14.
6. Cheng, M., et al. A COVID-19 Rumor Dataset. Frontiers in Psychology 12 (2021): 1566.
7. Facebook. Facebook: combating misinformation (2021). https://about.fb.com/news/tag/misinformation/.
Scientific Reports | (2021) 11:10424 | https://doi.org/10.1038/s41598-021-89202-7 12
Vol:.(1234567890)You can also read