Delivering on London's Housing Requirement - interim report
←
→
Page content transcription
If your browser does not render page correctly, please read the page content below

Delivering on London’s
Housing Requirement
interim report
This is a joint report by the London Housing Directors’ Group, a professional network of
senior housing officers from across London’s 33 local authorities, and the G15 group of
London’s largest housing associations. The report is supported by data and analysis provided
by Savills.

This is an interim report, with comments and further evidence welcome from across the
sector to inform the policy debate on unlocking housing supply in London. Please send
responses to the consultation questions included in this report – and any further evidence as
appropriate – to alex.sewell@londoncouncils.gov.uk by Friday 17 September.

Cover image: Bourne Estate (London Borough of Camden); architects: Matthew Lloyd Architects;
photograph by Benedict Luxmoore

                                                                                            2
1. Summary

London’s housing crisis is deep, prolonged, and with the current range of policies tasked with
solving it, has no realistic end in sight. Households from a range of economic backgrounds are
affected by the lack of decisive action, but fundamentally, London’s housing crisis is an
affordable housing crisis, caused by a decade long failure to build enough affordable housing
options.

The Mayor of London’s London Plan, adopted in March 2021, outlines a target to achieve
52,000 new housing completions per year (following the independent planning inspection);
an increase from just over 42,000 in the previous London Plan. This compares to the 2017
Mayor’s Strategic Housing Market Assessment, which identified a need for 66,000 new homes
a year to satisfy housing need. Under the government’s latest version of the Standard Method
for calculating housing need, the figure for London is 85,000 homes per year. Savills estimates
an even higher level of required delivery to meet need and improve affordability, suggesting
that 90,000-100,000 new homes are needed each year.

These ambitious targets dwarf current rates of delivery, which MHCLG currently estimates at
41,718 in the year 2019/20.1 Latest figures on housing delivery from Molior (who track
developments comprising more than 20 private homes) shows 22,848 completions in the year
to Q2 2021, an annual increase of 8 per cent, but still 13 per cent below the peak in 2017. The
shortfall of affordable homes is even more acute, with an estimated 42,500 sub-market
homes required each year; when considering that only 7,900 have been delivered on average
per year over the five years since 2015/16, the need for action becomes clear. 2

Without an enhanced role for the social sector, London will continue to fail to meet the
housing needs of low and middle-income Londoners, particularly the growing need for more
social rented homes. This paper directly addresses this reality by illustrating the very real need
for a renaissance in social home building; highlighting where we are now, the failure of the
market to balance supply with demand and provide affordable options, and by exploring the
obstacles we must overcome to make this happen. These include:

      1. Market failure in housing: short-term forecasts from Savills show that the market is
         unlikely to meet the housing delivery targets in the revised London Plan. There is also
         an affordable housing paradox that persists in London: high prices, low wages relative
         to house prices, a high demand for affordable homes, and a continuing over-supply of
         new homes aimed at higher earners, and an under-provision of homes for low- and
         middle-income households.
      2. Decline in value of the cross-subsidy development model: the social sector’s reliance
         on a cross-subsidy model to deliver new affordable housing, following the reduction
         in the proportion of scheme costs met through grant funding since 2010, is reaching a
         tipping point. Market prices are too high to support market sales, yet the slowing
         growth in house prices, coupled with pressure on social housing providers’ financial
         covenant limits, makes the cross-subsidy model increasingly difficult.

1
    https://www.gov.uk/government/statistical-data-sets/live-tables-on-net-supply-of-housing
2
    Savills

                                                                                                3
3. Challenges in mobilising development through the Housing Revenue Account (HRA):
      despite the lifting of the HRA borrowing cap, high levels of HRA debt, restrictions on
      councils’ ability to use Right to Buy receipts, the effects of the 1 per cent per year
      social rent reduction policy from 2016/17-2019/21 combined with increased
      requirements to invest in existing stock from a safety and decarbonisation perspective
      have all severely limited the sector’s ability to maximise the delivery of affordable
      housing through the HRA.
   4. Skills shortage and wider market uncertainty: the shortage of housing development
      staff in London is a constraint on boroughs seeking to create development teams,
      while wider challenges persist in relation to the supply of skills and uncertainty around
      market conditions. These risks are exacerbated by cost pressures arising from the
      disruption caused by the COVID-19 pandemic.
   5. Support for social housing providers to meet building safety and net-zero costs:
      meeting the twin challenges of tackling the building safety crisis and ensuring social
      housing plays its full role in tackling the climate emergency will require significant
      resource investment, potentially impacting the supply of new affordable homes.

This report will make the case for greater funding and support for the social housing sector
to deliver the right type of housing, at the pace and scale London needs, utilising data analysis
provided by Savills, London boroughs and the G15, and building on the previous work
undertaken by the Greater London Authority through its review of the Council Homes for
Londoners programme. It highlights the role that both councils and the wider housing
association sector can play in enabling new development.

                                                                                               4
2. The challenge of meeting London’s housing need – where are we?
London particularly sees very high levels of demand for housing, driven by employment
growth in excess of the UK average, population growth, and the expansion of a world class
higher education sector.
London’s population is projected to increase to 9.8 million people by 2041. 3 The revised
London Plan outlines a requirement for a minimum of 52,000 new homes every year as part
of efforts to meet existing and new housing need, along with space for tens of thousands of
new jobs. Savills’ analysis of demand in London estimates 90,000 to 100,000 homes need to
be built per year in order to meet this demand and improve affordability; addressing the
historic shortfall in supply. 4 Savills’ analysis of the future pipeline of new homes shows that
there will still be a continuing imbalance between supply and demand in London, with future
housing delivery only forecast to be around half of what is needed.
Brexit does not yet appear to have impacted London’s population growth or the requirement
for more housing. While ONS data has shown a fall in EU migration to the UK since 2015, this
has been offset by a rise in non-EU migration, and net migration in 2019 was at its highest
level since June 2015.5
The outlook for London’s housing supply
According to MHCLG data, there was a net total of 41,572 new Energy Performance
Certificates issued over the year July 2020-July 2021 (a recognised method of estimating new
home completions). 6 See figure 1 below for a timeline of total housing delivery.
According to Molior data, compared to figures from 2015 when both the number of starts
and the number of planning permissions peaked, the figures for 2020 were lower, showing
signs of caution. Planning consents have fallen every year since 2018 and in 2020 were down
46 per cent against 2015. The same pattern is true for starts, with a fall of 47 Per cent. As a
consequence, over the next five years, London supply is expected to fall well short of both
the Mayoral target and Savills estimated delivery requirements.
Savills are forecasting that completions over the five-year period 2021-2025 will average
43,000 homes per year, with around 30 per cent of units expected to be affordable or
intermediate housing. Completions are expected to peak in 2022, and fall for the following
three years, reflecting the lower levels of permissions and starts in 2018-2020. By 2023, Savills
forecast that the number of homes under construction in London will be at its lowest level for
10 years.
3
Office for National Statistics population projections
4
This is based on analysis of projected growth in workplace employment, household projections by type and
income distributions.
5
‘Provisional long-term international migration estimates’, Office for National Statistics, 27 August 2020
6
Live tables on Energy Performance of Buildings Certificates, Ministry of Housing, Communities and Local
Government
5In response to a survey on new housing delivery within their local housing market, London
borough Housing Directors highlighted the five main barriers to supply: (1) uncertainty in the
wider economy and housing market, (2) developers not building out planning permissions, (3)
the high cost of land, (4) a lack of land and (5) high building costs.
Figure 1 – Total housing delivery in London
Annual Molior completions (schemes over 20 private units)
Annual Energy Performance Certificates
30,000 50,000
Annual Molior completions (schemes
45,000
25,000
Annual EPC certificates
40,000
over 20 private homes)
20,000 35,000
30,000
15,000 25,000
20,000
10,000 15,000
5,000 10,000
5,000
- -
Q4 2009
Q2 2010
Q4 2010
Q2 2011
Q4 2011
Q2 2012
Q4 2012
Q2 2013
Q4 2013
Q2 2014
Q3 2014
Q2 2015
Q4 2015
Q2 2016
Q4 2016
Q2 2017
Q4 2017
Q2 2018
Q4 2018
Q2 2019
Q4 2019
Q2 2020
Q4 2020
Q2 2021
Source: EPCs, Molior
Figure 2 – London delivery and forecasts by tenure
Market Affordable Housing need London Plan target
100,000
90,000
80,000
Housing Delivery
70,000
60,000
50,000 40,553 41,720 43,151
35,358
40,000 28,739 31,851 36,129
30,000
25,096 23,777 24,606 26,749
19,792
20,000
10,000
-
2009/10 2010/11 2011/12 2012/13 2013/14 2014/15 2015/16 2016/17 2017/18 2018/19 2019/20 2021-25
GLA Annual Monitoring Report (Year to March) MHCLG Savills
(year to Forecast
March) (annual
average)
Source Savills, MHCLG
The consequence of the supply/demand mismatch
In this situation of demand outstripping supply, the inevitable consequence is housing
hardship. The boroughs have seen significant increases in homelessness, with 10,180
homelessness acceptances in 2010/11, compared to 24,630 households that were owed a
6homelessness relief duty by a London local authority in 2019/20.7 Over the same period
temporary accommodation placements have also increased, with more than 60,000
households, including 88,000 children living in temporary accommodation in London at the
end of 2020. 8 Research by LSE, commissioned by London Councils, found that in 2017/18 the
London boroughs spent £730 million on providing temporary accommodation to residents,
and £919 million in total on homelessness services. 9 Undertaken prior to the COVID-19
pandemic response, the research estimated that borough homelessness spend would
increase to over £1 billion by 2021/22.
The challenge for more middle-income households in accessing affordable rented
accommodation or home ownership in London is also well known, with rents and house prices
both rising well above incomes over the last decade (see section 3).
The policy environment
1. How can the planning system better support the delivery of new housing supply, with
reference to recent changes (such as the new London Plan and revised National Planning
Policy Framework) and proposed reforms detailed in the Planning for the Future white
paper?
2. Is the Housing Delivery Test an effective tool for driving increased housing supply?
3. How does the funding of the social housing sector need to be shaped to better maximise
the delivery of new housing supply?
4. How long-term is your organisation’s development strategy, and what resource and other
conditions can support that long-term approach?
7
Live table on homelessness: Detailed local authority level tables: financial year 2019-20 – change in
terminology reflects the changes in local authorities’ statutory duties following the Homelessness Reduction
Act.
8
Statutory Homelessness Live Tables, Ministry of Housing, Communities and Local Government
9
‘The Cost of Homelessness Services in London’, LSE London, October 2019
73. The affordability paradox in London’s housing market
The affordability paradox in London’s housing market has four facets to it, each of which is
explored below.
London’s rapid house price growth
London house prices currently sit at 66 per cent above their 2007/8 peak, compared to just
31 per cent across the rest of England & Wales. The average house price in London in March
2021 stood at £666,614 compared to £346,263 in England. 10 This rapid growth can be seen in
figure 3 below, and while London has experienced negative growth from Q4 2017, positive
price growth has returned to London following the onset of the Covid-19 pandemic.
Predictions by Savills see house price growth remaining strong in 2021 before returning to
more lower levels of growth between 2022-2025, limited by a forecasted rise in interest rates
along with stretched affordability.
Figure 3 - Annual & quarterly London house price growth, Q2 2021
Annually Quarterly
30%
25%
House price growth (%)
20%
15%
10%
5%
0%
-5%
-10%
-15%
-20%
-25%
Q2 2000
Q4 2000
Q2 2001
Q4 2001
Q2 2002
Q4 2002
Q2 2003
Q4 2003
Q2 2004
Q4 2004
Q2 2005
Q4 2005
Q2 2006
Q4 2006
Q2 2007
Q4 2007
Q2 2008
Q4 2008
Q2 2009
Q4 2009
Q2 2010
Q4 2010
Q2 2011
Q4 2011
Q2 2012
Q4 2012
Q2 2013
Q4 2013
Q2 2014
Q4 2014
Q2 2015
Q4 2015
Q2 2016
Q4 2016
Q2 2017
Q4 2017
Q2 2018
Q4 2018
Q2 2019
Q4 2019
Q2 2020
Q4 2020
Q2 2021
Source: Nationwide index (seasonally adjusted)
London’s imbalance with wage growth and house prices
The average wage in London is £42,667 while the UK average is £31,590 (November 2020).11
Considering this differential, the mismatch is clear; average house prices in the capital are 93
per cent higher than the UK average compared to wages that are just 49 per cent higher.
Research from Savills has analysed the affordability constraints faced by households in all
regions since the 2007/08 downturn. The results of which are illustrated in figure 4. This
shows that while the house price to earnings ratio has been increasing in all regions, London’s
house price to earnings ratio has grown significantly and diverged from the national average:
the house price to earnings ratio for London is 12.5, considerably above the national average
of 7.7.
10
Land Registry, March 2021
11
Office for National Statistics, Annual Survey of Hours and Earnings
8Figure 4 – House price to earnings ratio
England and Wales North East North West
Yorkshire and The Humber East Midlands West Midlands
East London South East
South West Wales
14.00
dian house price to median residence based
12.00
10.00
8.00
earnings ratio
6.00
4.00
2.00
0.00
Affordable housing demand
The need for affordable housing in London and the South East is far greater than the wider
country. Based on affordability alone, the annual need for additional affordable housing in
London is 7.6 times greater than supply, compared to 2.6 in England. 12 This is before
considering the wide range of other socio-economic reasons for households being unable to
access a suitable home in the market. These wider reasons contribute to the 246,575
households who were on local authority waiting lists in London in 2020. 13
According to Savills’ estimate of housing need, at least 42,500 sub-market homes are required
in London per annum (figure 5). This compares to an average of 7,900 sub-market homes that
have been delivered annually since 2015/16. 14
Under supply of affordable tenures
Savills’ forecast of future supply against demand indicates that the largest supply shortfall will
persist in the lower mainstream market segment below £450 pound per square foot (psf) and
in the sub-market rent segment. These figures are illustrated in figure 5 and demonstrate the
market’s failure to deliver an adequate supply of homes that are affordable to low- and
middle-income households (the demand in each price band are estimated based on
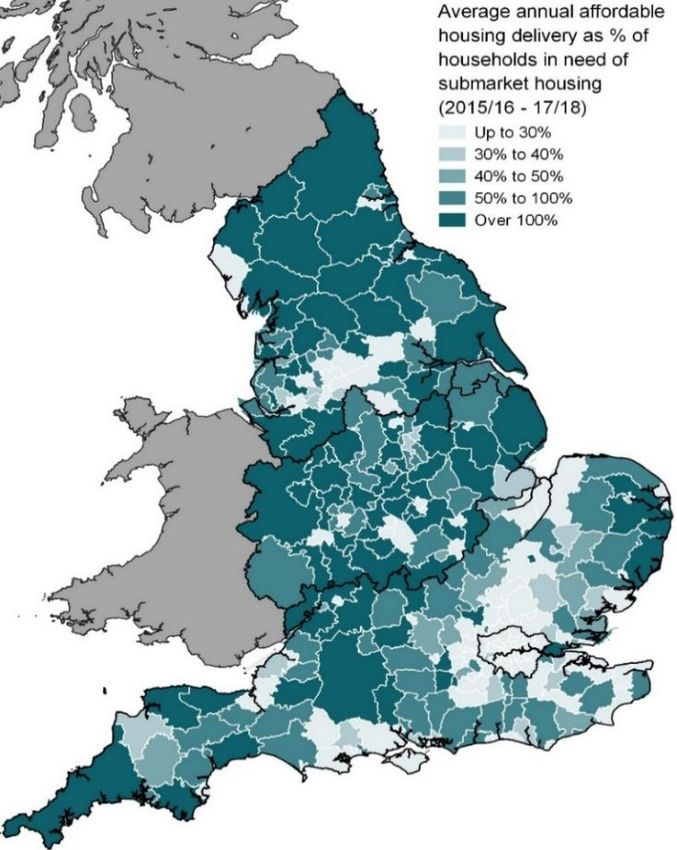
affordability of Londoners for both renting and owner occupation). Figure 6 below shows the
areas of England where affordable housing is under supplied. Contrasted with figures 4 and
5, it highlights the extent to which London’s housing market has failed, and looks set to
continue failing, to deliver the levels of affordable housing supply needed.
12
Analysis by Savills
13
Households on Local Authority Waiting List, Borough, Ministry of Housing, Communities & Local
Government (accessed via London Data Store)
14
Analysis by Savills
9Table 4 shows the average transaction value and annual change in values of each London
borough and emphasises the challenge of affordability in London. Every London borough,
with the exception of City of London, has seen average values increase over the last twelve
months. The three most affordable boroughs by transaction value have all seen price
increases of over 4.5 per cent in the year to March 2021, putting home ownership further out
of reach for many Londoners.
Figure 5 – Supply shortfall by price band (2021-25)
Source: Savills Research using Molior, CACI and Oxford Economics
10Figure 6 – Shortfall in affordable housing delivery
Source: Savills using HM Land Registry, EHS, Rightmove, MHCLG
11Table 4 – Values and price growth by London Borough, March 2021
Average price (as at Prices above Annual Quarterly
March 2021) 2007/08 peak growth growth
Barking and Dagenham £324,694 159% 4.5% 2.7%
Barnet £668,519 157% 2.8% 1.0%
Bexley £388,224 161% 4.7% 2.2%
Brent £578,724 163% 4.4% 1.8%
Bromley £524,954 162% 4.6% 1.8%
Camden £1,042,420 161% 3.0% 0.9%
City of London £960,391 160% -0.5% -1.7%
Croydon £408,696 156% 3.8% 1.6%
Ealing £601,912 160% 4.5% 1.4%
Enfield £467,454 155% 3.1% 2.5%
Greenwich £507,158 169% 5.6% 2.1%
Hackney £622,476 190% 4.0% 1.3%
Hammersmith and Fulham £924,715 160% 3.7% 0.1%
Haringey £681,687 178% 4.5% 1.8%
Harrow £544,890 152% 1.3% 1.1%
Havering £415,740 159% 3.6% 1.5%
Hillingdon £477,368 159% 4.4% 1.1%
Hounslow £536,302 154% 3.8% 0.3%
Islington £776,145 172% 6.7% 1.3%
Kensington and Chelsea £1,923,559 153% 4.2% 0.5%
Kingston upon Thames £589,701 158% 5.2% 2.2%
Lambeth £652,017 182% 5.2% 1.3%
Lewisham £492,818 183% 6.6% 2.0%
Merton £676,001 168% 5.8% 2.1%
Newham £397,806 163% 5.8% 1.7%
Redbridge £482,994 159% 5.8% 2.0%
Richmond Upon Thames £856,576 160% 5.0% 1.0%
Southwark £659,494 186% 6.4% 1.4%
Sutton £430,061 155% 4.6% 1.9%
Tower Hamlets £536,746 152% 4.3% 0.8%
Waltham Forest £497,492 198% 7.7% 2.5%
Wandsworth £783,417 168% 4.1% 1.0%
Westminster £1,461,156 158% 2.4% 0.5%
The affordability paradox
The affordability paradox follows: the situation persists where house prices are high in the
capital and set to continue rising in the medium to long-term. Meanwhile, wages have not
kept pace with this rise, which has left housing unaffordable for the vast majority of
Londoners. Consequently, there is a huge demand for sub-market and lower mainstream
housing options. Yet, market delivery is focussed on the upper mainstream price bands that
are affordable to higher earners, while significantly under-delivering new homes that are
affordable to households that are most locked out of London’s housing market. The forecasts
provided by Savills show that, left to its own devices, the market will not correct these
12imbalances. With this in mind, it is essential that social sector builders get the support and
funding they need to fill this void and correct this market failure.
Figure 8 – the affordability paradox
High & rising house prices
High affordable Low affordable
housing demand housing supply
High house price to earnings ratio
134. The social sector’s determination to increase supply and the importance of
the social sector in meeting housing need
The analysis above shows the extent to which the private market will continue to
underprovide for low- and middle-income households over future years. London’s social
housing sector is determined to fill this gap, and indeed, is the best and only viable option to
do so. The sector has already shown significant commitment towards this end, and given the
right tools, could fill the gap in private market delivery.
Enabled by recent reforms to the Housing Revenue Account (HRA), and with additional grant
funding recently being made available by the Greater London Authority, London local
authorities have set out ambitions plans to deliver new council housing at scale for the first
time in over 30 years. From a standing start, this has involved significant change in local
councils to develop the skills and institutional organisation to deliver on behalf of Londoners.
As a sign of their ambition, in October 2018 councils were awarded £1 billion of funding from
the Mayor of London to deliver 11,000 new council homes across the capital. 15 The fund was
significantly oversubscribed, with bids submitted by boroughs for almost 6,000 further homes
that the Mayor was unable to fund.16
For housing associations, there has been significant increases in average delivery rates over
recent years to meet stretching affordable housing targets. The number of completions
achieved in 2020-2021 was 11,252 (an increase of 19 per cent from 2019-2020), with 80 per
cent of these affordable housing units.17
Under the Mayor’s funding arrangements, GLA strategic partnership status is available to
housing associations committed to building substantial numbers of new homes in the capital,
with at least 60 per cent being affordable. In signing GLA strategic partnerships, many G15
members increased their bids by 50 per cent during the 2021/26 Affordable Homes
Programme, reflecting the attractiveness of these arrangements. In return, strategic partners
are granted certain privileges, including the possibility of more flexible funding conditions and
support for land acquisitions.
All eleven of the current GLA strategic partners are GI5 members, and collectively, G15
members have been awarded over £2 billion of mayoral grant funding by City Hall to build
53,700 affordable homes by March 2023 18.
Despite this commitment, and support through grant funding, serious challenges remain that
make the environment challenging for social sector providers.
15
‘Mayor agrees £1 billion plan to build 11,000 new council homes’, Greater London Authority, 23 October
2018
16
Council Homes Scheme (4), Mayor’s Question Time, 22 November 2018
17
Greater London Authority Affordable Housing Statistics
18
https://www.whatdotheyknow.com/request/strategic_partnership_agreements
14Addressing the affordability challenge
5. What interventions could better ensure that market housing is delivered at a price point
the meets the needs of Londoners?
6. What strategies are your organisation taking forward to maximise affordable housing
supply?
7. How are market pressures (including the weakening potential for cross-subsidy) affecting
your organisation’s development programmes and the level of affordable housing that
can be brought forward?
8. How could more short-term capacity be released from your borough’s long-term Housing
Revenue Account business plans?
9. What impact do the recent Right to Buy flexibilities have on your borough’s local
development programmes?
155. Challenges to social sector delivery
Despite some improvements in the policy and funding framework for social housing
providers, there are still structural factors that make the environment for housing delivery
more challenging. The consequences of these is a greater difficulty for the social sector to
deliver new homes, particularly in higher value parts of London.
Threats to the cross-subsidy development model
As grant rates for new social sector housing have been cut, the sector has been encouraged
to develop a greater reliance on the cross-subsidy model to fund affordable housing delivery;
utilising funds raised through open market sales to fund the gap in grant funding.
Taking a longer-term view, the grant rates available to support development have fluctuated
over the past decade, with a 2014 G15/Frontier Economics research paper highlighting a
substantial reduction in grant rates from 41 per cent of unit costs under the 2008/11 National
Affordable Homes Programme to 23 per cent under the 2011/15 Affordable Homes
Programme. This cut was predicated on the introduction of Affordable Rent, 19 which replaced
capital grant funding with an increased rental stream and enabled housing associations to
take on more borrowing against the higher rental income to fund development.
In London, grant rates for affordable rented homes increased under the 2021/26 Affordable
Homes Programme to a maximum of £70,000 for housing associations and £100,000 for local
authorities. However, total scheme costs have risen to nearly £400,000 per unit in the capital
on average, so current grants constitute around 17.5 per cent of total scheme costs. This
means that for every £1 of GLA grant housing associations receive, they spend a further £6
from their own borrowing and resources.
Data from individual G15 members clearly illustrates this challenge. 2019 analysis by Network
Homes 20 showed that 51 per cent of the cost of their home building programme was
government funded between 2008 and 2011. In contrast, the government grant received for
the 2016/21 programme is covering only 12 per cent of scheme costs.
The cross-subsidy model is becoming increasingly untenable in the face of market conditions
and pressures on financial covenant limits. While it could be viewed as a good example of
effective public-private partnership, it also increases market exposure, which brings fresh
challenges, including the prospect of regulatory downgrades and poorer credit ratings as the
regulator and credit agencies reflect on the higher degrees of risk.
The G15 has previously expressed serious concerns about the impact that a slowing housing
market and rising development costs would have on the cross-subsidy development model.
Illustratively, one association’s stress testing – conducted in June 2018 – showed that, based
on a 35 per cent fall in house prices, interest rates rising to 4 per cent and a doubling of
19
Affordable rent is no more than 80 per cent of the local market rent (including service charges, where
applicable).
20
‘Why aren’t housing associations building more affordable homes?’, Network Homes, 2019
16unemployment, their development programme would need to be scaled back by around a
quarter. In theory, housing associations have the capacity to ‘flip’ market sale homes to
affordable rent to reduce their exposure to the market. However, this would inevitably mean
fewer homes being built across tenures, given the loss of cross-subsidy from homes for open
market sale or shared ownership.
Across the G15, homes for shared ownership or open market sale represent a substantial
proportion of total forecast starts and completions in the capital. In 2020/21 they are
expected to constitute 44 per cent of starts and 54 per cent of completions 21. Both tenures
carry a commercial risk. Shared ownership could expose social housing providers to greater
risk in the event of a downturn, given it is open to buyers with comparatively low incomes
who are more economically precarious. Furthermore, the government’s recent changes to
the shared ownership model have introduced the ability for customers to purchase initial
shares from as little as 10 per cent, alongside ‘micro-staircasing’ in increments of 1 per cent,
and a new repairs contribution from providers. These changes all require additional
investment from providers in delivering shared ownership units, or for greater levels of grant
funding to be made available, further reducing the level of cross-subsidy that shared
ownership housing can currently generate.
For local authorities, a house price downturn would have some negative impact on the
majority of councils’ ability to deliver affordable housing. The extent of this impact is variable
depending on the assumptions made in boroughs’ development proposals and how extensive
scheme proposals are (for example, estate regeneration schemes, which unlock significant
levels of new supply, are likely to be more vulnerable to negative impacts on the cross-subsidy
model because of the mix of tenures usually involved). However, a significant minority of
boroughs identify a more limited impact, primarily because their programmes only rely on a
small proportion of cross-subsidy from market sale and have taken a more cautious approach
in their viability assessments that accounts for the possibility of a house price downturn.
Boroughs also identify potential remedies to a downturn, such as flipping the tenure of units
in their programmes. Some also highlight the potential opportunities that may be presented
by a downturn, including the acquisition of distressed private developments to increase the
council-owned housing stock, while others would expect to see build cost reductions as
private sector developers search for work in the public sector.
As Savills has identified, pressure on housing associations’ finances is emerging in the form of
interest cover. 22 Whilst the end of the government’s centrally imposed 1 per cent rent
reduction over recent years is welcomed, the fall in income from the rent reduction whilst
costs continue to rise is adding pressure to operating margins and in turn interest cover.
Similarly, the additional investment being made in planned maintenance works exacerbates
this challenge. This places further pressure on the cross-subsidy model.
21
Greater London Authority Affordable Housing Statistics
22
‘What can housing associations do to ease financial pressure?’, Savills blog post
17Challenges in mobilising development through the Housing Revenue Account
Boroughs strongly welcomed the government’s removal of the HRA borrowing caps in
October 2018. However, challenges remain to mobilising development through the HRA,
including the difficulty of ensuring the viability of individual schemes, insufficient levels of
grant subsidy and land availability. For larger schemes, councils will still find it challenging to
leverage the level of borrowing needed to fund these developments, particularly where the
potential for cross-subsidy is uncertain. Many council HRA’s have also felt significant negative
impacts as a result of the COVID-19 pandemic, with data from June 2021 projecting a £33
million hole in finances for the financial year 2021/22 as a result of lost revenue income (e.g.
from higher rent arrears and longer void periods) and increased spending (such as from
workforce pressures and additional personal protective equipment) alongside the pressures
from investment requirements in existing stock.
Prior to the removal of the HRA borrowing caps, the aggregate borrowing cap in London
totalled £7.8 billion compared to actual borrowing of £6.2 billion (i.e. leaving 20 per cent
‘headroom’ for additional borrowing). In 2018/19, boroughs were expected to generate £2.8
billion of HRA income, of which £722m will be spent on servicing existing HRA debt (26 per
cent). This compares to £1.7bn of expected expenditure on repairs, supervision and other
running costs (58 per cent) and £440m of other expenditure (16 per cent).
Modelling conducted by London Councils in 2018 suggested that additional rents generated
from new housing stock would not be sufficient to cover necessary additional financing costs
that would be generated over the 30-year duration of an HRA business plan. For example,
15,000 additional homes would generate £4.5bn of additional HRA income over 30 years
whilst creating additional debt servicing costs of £8.5bn. As new stock would not be self-
financing over a business plan period, any additional borrowing would need to be serviced by
reducing spending on other areas (e.g. repairs, supervision etc.) or through the acquisition of
grant funding. As an example, under the model’s central assumptions, the financing costs of
15,000 additional homes would mean that aggregate 30-year expenditure on non-financing
costs would need to reduce from £84bn to £81bn over 30 years.
The relatively high level of existing HRA debt and the very long time it takes for a new house
to ‘pay for itself’ means that the removal of the HRA cap has a relatively modest impact in
terms of additional housebuilding in London. The provision of grant funding, and the higher
rate of £100,000 per property to reflect the boroughs’ unique position as house builders, has
been welcome, but further measures – discussed in the recommendations section – are
needed to support councils further. The situations will be different in different boroughs, but
the lifting of the cap alone will not lead to the step change in supply needed.
Social rent reduction
A particular issue remains the lasting impact of the 1 per cent a year reduction in social sector
rents, introduced by government for the financial years 2016/17 to 2019/20, which forced
boroughs to revise their HRA business plans and considerably scale-back plans for stock
improvement and new building. Given the previous policy was to raise rents by CPI inflation
+ 1 per cent each year, it was expected that social rents would be 12 per cent lower than they
would otherwise have been by 2019/20. Councils make HRA spending plans over 30 years, so
the negative impact to local ambitions is plain to see.
18For Housing Associations, the policy was estimated to have created a cumulative £3.85 billion
loss in rental income nationally over the four years that it has been in place; the equivalent
cost of building around 27,000 new affordable homes. It is estimated that the cut equated to
a loss of around £500 million in rental revenue per year across the G15 group.
While the reversion back to a CPI+1 per cent rent policy for the five years from 2020 is
welcome, the legacy of rent reduction has left significant funding shortfalls in HRA funds that
will be entrenched under the new rents regime. This issue is particularly problematic for local
authorities that had historically kept rents very low, as the CPI +1 per cent policies
exacerbates these differences and disproportionately impacted on those councils. The ability
of Government to influence rents in this way impacts on some boroughs business plan
assumptions, which impacts on future long-term capacity.
Right to Buy
Another key determining factor in capacity of the HRA to deliver homes is the failure to
replace social housing sold through Right to Buy (RtB). In 2012 the Government decided to
‘reinvigorate’ Right to Buy, increasing the discount on council homes to £75,000 across
England. The following year the discount was increased to £100,000 in London. The
Government promised one-for-one replacement, and despite the significant fall in Right to
Buy sales since 2015, 13,182 homes have been sold by councils in London under RtB since
2015/16, while just 9,562 replacement homes have been started over the same period using
receipts from the scheme. 23 A 2018 study by CIH’s estimated that reducing discounts by just
a third could free up enough funds to deliver an extra 12,000 homes a year nationwide. 24
In March 2021 the government introduced welcome reforms to RtB. These increased the time
limit for spending receipts from 3 years to 5, increased the proportion of spending permitted
on individual developments from receipts from 30 per cent to 40 per cent, and allowed
councils to use receipts to deliver shared ownership and First Homes. However, reforms also
introduce a cap on the number of existing properties that could be acquired by councils,
which provides an avenue for quick additions to the council’s housing stock and can provide
a positive strategic use of receipts (for example, to acquire properties near to existing housing
stock).
RtB has steadily eroded the council housing stock for three decades. Moreover, there are
serious questions as to the social outcome of the scheme. A 2019 study found that councils
in London were spending over £22m each year renting back homes sold under RtB and that
number of RtB homes now in the private rented sector has risen by at least 11,825 over the
preceding last five years to approximately 54,000. The stats now show that 42 per cent of
homes sold through RtB in London are now let by private landlords at market rates – up from
36 per cent in 2014. 25
23
Live tables on social housing sales, Ministry of Housing, Communities and Local Government
24
‘CIH calls for right to buy to be suspended as discounts climb to ‘£1bn’’, Public Finance, 4 October 2018
25
‘Councils fork out millions renting back Right to Buy properties’, 21 January 2019
19Build costs, material availability and skills shortages
The impact of Covid-19, Brexit and a global surge in demand as construction recovers from
the pandemic have all driven build cost inflation across the sector. From its 2015 baseline to
2019, the government’s Construction Material Price Index for new housing shows an average
annual increase of 3.1. But in the last 6 months, costs have soared, with the latest index for
May 2021 reaching 124.6. 26 The price of tender responses for construction projects is also
anticipated to increase significantly over the next few years as a result, with projections of
around 3 to 4 per cent inflation per year.
Figure 9: New Housing Construction Material Price Index
130
New housing construction material price
125
120
index (100=Jan 2015)
115
110
105
100
95
90
85
80
Jul-16
Jul-17
Jul-18
Jul-19
Jul-20
Apr-16
Apr-17
Apr-18
Apr-19
Apr-20
Apr-21
Jan-16
Jan-17
Jan-18
Jan-19
Jan-20
Jan-21
Oct-16
Oct-17
Oct-18
Oct-19
Oct-20
Source: BEIS
The availability of materials was cited as a major development constraint by 59 per cent of
respondents in the Q1 2021 HBF survey, up from 26 per cent the previous quarter. Global
demand for raw materials has outstripped supply resulting in disrupted supply chains and
inflated prices. Material prices rose by 5.6 per cent in the year to Q1 2021 and are forecast to
increase by 7.2 per cent in the year to Q2 2021, according to the BCIS Materials Cost Index,
with materials such as timber, steel and concrete witnessing the greatest price increases.
Timber has experienced a significant spike in popularity driven by global demand from
countries such as the US. Many developers are also using the material as an effective means
to reduce embodied carbon emissions in construction and new development, tying in with
the Government target of net zero carbon emissions by 2050. Material shortages are one of
the most significant challenges facing the sector, as warned by RICS. Housing associations
have faced unprecedented development delays of up 10 weeks on completion as a result of
material shortages, according to Inside Housing.
26
Building materials and components statistics: June 2021, Department for Business, Energy & Industrial
Strategy
20Labour shortages could also prove another fundamental obstacle for the sector with the
construction industry facing shortages in specific trades as a result of EU workers leaving the
UK, the increasing demand for construction workers to retrofit buildings and the scale of
workers required for large infrastructure projects such as HS2. Analysis for the Home Builders
Federation in 2017 showed almost half of all housebuilding workers in the capital are from
EU27 countries, as compared to 18 per cent across Great Britain.27 Since 2017, there has been
a 42 per cent decline in the UK’s EU construction workforce, according to ONS figures.
Furthermore, it is estimated that the average age of a construction sector worker is 56 years,
highlighting the future challenges in resourcing much needed housing development. While
wage inflation within the sector was suppressed by the pandemic, there is evidence that they
may be set to rise, with reported wage inflation of 4.8 per cent on London construction sites
between May and June 2021 alone.28
For councils, there are also associated gaps in skills within local authority development teams.
From a standing start, councils have had to attract and develop the necessary skills in order
to start building council housing at scale for the first time in over 30 years.
While the disruption caused by the global pandemic may be short lived, material and labour
shortages are anticipated to continue to impact the development sector. The Future Homes
Standard will come into effect from 2022. It mandates a 75-80 per cent reduction in emissions
in new build homes by 2025 and estimates of additional costs to meet the standard are
predicted to be in the range of 1-2.5 per cent per house, according to figures published by
some of the major housebuilders. Pressures on better design and placemaking under the
National Model Design Code published at the start of 2021 will further drive up build costs.
27
Home Builders Federation analysis
28
‘London wage inflation attributed to Brexit factor’, The Construction Index, 15 June 2021
216. Impact on delivery in locations and by products
The trends in the housing and land markets, along with the financial and structural challenges
faced by social sector providers, have resulted in a changing geographic pattern of delivery
and increased the difficulty of delivering particular tenures without significant subsidy.
Delivery by tenure
With the challenges of delivering new homes increasing in London, this has had an impact on the
viability of particular tenures, which are explored below.
• Social/London Affordable Rent: Whilst boroughs place the highest priority on delivering
these tenures, it also faces the greatest viability barrier due to the lack of public subsidy.
Boroughs identified related barriers, such as the strain on HRAs and the need for certainty
in rent policy over 30 years to enable business planning. In many instances boroughs
receive an insufficient number of tender responses from the development sector when
putting forward schemes including significant levels of social rent, highlighting the viability
challenge for these schemes.
• Shared ownership: Barriers to delivering shared ownership include the lack of political
support in some boroughs, 29 the insufficient level of available grant subsidy and the
particular challenges for councils in holding the long-term debt on their balance sheets.
Shared owners can also face difficulties in staircasing and up-sizing to larger
accommodation.
• First Homes: The introduction of First Homes presents a particular concern in relation to
the affordability of the product in London. Analysis undertaken by Savills found that the
average household income required to afford a First Home across the Greater London
region would typically be £67,600 for a two-bedroom property (with a 15 per cent
deposit), compared to the median household income of £38,500,30 and accessible to just
12 per cent of households. The discounts offered on properties, at up to 30 per cent of
value, also raise concerns that the provision of First Homes will limit the supply of
genuinely affordable homes, such as social rented housing, that can be leveraged through
planning gain.
• London Living Rent and other intermediate rent: London Living Rent (LLR) is generally
viewed as the least favoured affordable tenure to deliver locally. In many boroughs,
shared ownership is favoured over LLR as an affordable home ownership option because
the ‘buy or leave’ element of LLR caused concern, while the product also creates
complexities in management and is less financially viable than shared ownership.
Housing Associations have similarly raised concerns about the tenure, particularly
highlighting that delivery levels have been low due to the uncertainty regarding the
precise expectations of housing associations after a household has been in-situ for 10
29
While recognising the role that shared ownership can play in many parts of London to provide an accessible
route to home ownership.
30
Household income data provided by Experian.
22years. At this point the tenant is expected to have purchased the home on a shared
ownership basis, but it is unclear what happens if the tenant is unable to do so. It is also
possible that the option to buy is never enacted if successive households move out
without exercising the right to purchase, which heightens financial uncertainties within
business plans.
Location of housing delivery
The increase in land values in central- and inner-London, along with the reducing viability of
the cross-subsidy model, has made delivery more challenging in these areas for social sector
providers. An outcome of the more challenging delivery environment in London has led to a
longer-term trend whereby a greater proportion of G15 delivery is now taking place outside
of London (although the number of homes being delivered have increased in both areas, and
with a significant increase in starts within London in 2020/21).
Starts London Outside London Completions London Outside London
2015/16 69% 31% 2015/16 76% 24%
2016/17 68% 32% 2016/17 76% 24%
2017/18 63% 37% 2017/18 65% 35%
2018/19 56% 44% 2018/19 69% 31%
2019/20 59% 41% 2019/20 62% 38%
2020/21 67% 33% 2020/21 65% 35%
This trend does not reflect a strategic decision to move development away from London.
However, this is likely to reflect that land values continue to increase in London relative to
the rest of the country, with less competition for sites outside the capital, and a greater
buoyancy in the market outside of London, which better supports the cross-subsidy model.
Building safety
The 2017 Grenfell Tower disaster highlighted the devastating shortcoming of the regulatory
system governing building safety. The response to the crisis has led to significant investment
across the social sector to remediate buildings with unsafe cladding systems. G15 members
have already invested £350m on fire remediation works between 2019 and 2021, and
collectively have set aside £2.9bn over the next 10 years to fund further works. This
investment is equivalent to the delivery of 58,000 affordable homes, assuming each new
affordable home in London requires additional housing association investment of around
£50k. The changing legislative and regulatory environment that will see the implementation
of the Fire Safety Act, Building Safety Bill, and the creation of the new Building Safety
Regulator, will undoubtedly have further challenge local authorities and housing associations
resources to invest in affordable housing delivery.
23Achieving net-zero carbon by 2050
It is widely recognised that existing and future homes will have a significant role to play in
meeting the UK’s ambitions to achieve net-zero carbon by 2050, with 40 per cent of UK
emissions coming from households. 31
The government has consulted on proposals to require all rented homes to meet an Energy
Performance Certificate (EPC) rating of at least C by 2035 (2030 for fuel poor households),
while the London boroughs have collectively set a target to achieve EPC B across all tenures
by 2030.32 Achieving these necessary but stretching targets will be a challenge and requires
significant investment, but it represents a significant step on the way to a net zero carbon
position, which has a statutory target to be achieved by 2050 (although many local authorities
and the Mayor of London have set a shorter timeframe for this).
Housing providers are modelling the costs associated with retrofitting existing homes and
progressing the development of new technologies to improve the performance of new
homes. However, it has been estimated that to decarbonise the UK’s social housing stock
would require investment of £104bn, based on the average per property investment figure
landlords have forecast of £20,742 per home. 33
In London, the boroughs (led by LB Enfield and LB Waltham Forest) have established Retrofit
London Home Action Plan to set out a collaborative path to achieving their home retrofit
objectives. A further piece of work (led by LB Hackney) also seeks to ensure low carbon
development is the norm across London. Limitations on resources, especially for local
authorities through Housing Revenue Accounts, but also for housing associations due to
financial covenants and regulatory requirements, mean that pace at which progress towards
net-zero is made could have a material effect on investment in new affordable housing.
Delivery by tenure and location
10. Does your programme seek to prioritise delivery in areas with the greatest affordability
challenges and how has the location of delivery changed for your organisation in recent
years?
11. How can the provision of infrastructure and place-based grant funding programmes
better unlock housing delivery?
12. Has your organisation’s appetite for shared ownership changed with the introduction of
the lower entry model?
13. To what extent can estate regeneration proposals unlock supply and improve housing
conditions, and what funding programmes are needed to support this?
31
Committee on Climate Change fifth carbon budget analysis
32
London Councils pages on climate change
33
‘The cost of net zero: social landlords’ decarbonisation plans revealed’, Inside Housing, 23 November 2020
247. Recommendations
1. Market failure in housing: short-term forecasts from Savills show that the market is
unlikely to meet the housing delivery targets in the new London Plan. There is also an
affordable housing paradox that persists in London: high prices, low wages relative to
house prices, a high demand for affordable homes, and a continuing over-supply of new
homes aimed at higher earners, and an under-provision of homes for low- and middle-
income households.
o The market is not delivering the homes to meet demand. There is a clear
opportunity for social housing to step up to fill more of this gap, and a clear appetite
to do so. The government needs to work with and fully back social housebuilders to
deliver on this agenda.
o Government and the GLA where possible should seek to align the objectives and
delivery of the multiple grant funding programmes operating in London to achieve
place-based investment that will unlock new supply and improve existing housing
conditions through regeneration. This will seek to ensure that these achieve the
biggest impact and succeed in unlocking new development opportunities.
o Government should commit to fund key infrastructure that supports development
sites, giving confidence to the market, and bring forward further infrastructure
opportunities for this, building on the success of programmes such as the Housing
Infrastructure Fund.
o Revenue funding should be provided to councils to undertake an assessment of all
land opportunities for affordable housing, with a view to establishing their
development potential, infrastructure requirements and suitability for
development.
2. Threats to the cross-subsidy development model: the social sector’s reliance on a cross-
subsidy model to deliver new affordable housing, following the reduction in the
proportion of scheme costs met through grant funding since 2010, is reaching a tipping
point. Market prices are too high to support market sales, yet the slowing growth in house
prices makes the cross-subsidy model increasingly difficult.
o The government should significantly increase grant funding for affordable housing
to support the delivery of genuinely affordable homes that meet local need as both
a proportion of scheme costs and to expand overall supply.
o Government should make a 30 year commitment to increase social housing rents
by CPI + 1 per cent starting immediately. Flexibility on rent rises should also be
granted to councils that can demonstrate a positive correlation between additional
house building and reductions in housing benefit, and/or have historically low rents.
o Government should provide financial backing to housing associations and councils
to act as a ‘buyer of last resort’ for bulk purchase of unsold market homes at cost
where they deliver value for money.
253. Challenges in mobilising development through the HRA:
o Complete flexibility over RtB receipts: Government should go further in removing all
caps on the proportion of RtB receipts that can contribute to new homes, the time
limit on their use, and punitive interest charges that penalise councils for proper
long-term planning of sustainable housing developments. Furthermore, local
flexibilities should be granted to set discount rates commensurate to local
conditions and needs and to enable partnering of RtB receipts with other forms of
grant funding.
o HRA flexibilities: To increase delivery and better meet local demand by direct
support to enable a range of tenures to be delivered inside the HRA, including
intermediate and market rent. The goal would be to meet different community
needs and cross subsidise to deliver a net increase in social housing.
o Council owned housing companies: Permit borough housing companies to access
and use all forms of borough funding, including RtB receipts and s106.
o Consider re-opening the HRA debt settlement to enable more overall housing
supply through this route.
o Government should provide a longer-term commitment to PWLB interest rates to
enable longer-term planning of new development sites.
o Councils and housing associations should be supported with grant funding for
replacement homes to take forward estate regeneration schemes where these have
the support of local residents and lead to an increase in overall supply, with greater
certainty of funding for replacement homes either directly through the Affordable
Homes Programme or outside of this to enable new supply.
o Government should support councils to take forward complex sites through the
provision of longer-term grant funding arrangements. This would provide certainty
to councils when taking a position on large or complex sites, encouraging acquisition
of a land pipeline for future programmes, and contribute to improved quality and cost
control.
4. Skills shortage and wider market uncertainty: wider challenges persist in relation to the
supply of skills and uncertainty around market conditions. These risks are exacerbated by
post-Brexit and general market conditions.
o Local authorities and the G15 should work together to develop opportunities for
skills sharing arrangements between willing partners, that enables secondment
possibilities and other forms of knowledge transfer.
o Local authorities will work jointly to establish joint opportunities for training and
development. This includes taking forward the recommendations of a recent
Future of London report for the London Housing Directors’ Group, including in
relation to developing a new skills academy and shared graduate development and
apprenticeship routes.
o Government should develop a post-Brexit visa system for construction workers to
support continued capacity within the sector.
o Government should work with local authorities and the GLA to establish a further
dedicated round of revenue funding to support local authorities to improve
26capacity within development team and upskill development staff, building on the
successes of the Home Building Capacity Fund.
5. Support for social housing providers to meet building safety and net-zero costs: meeting
the twin challenges of tackling the building safety crisis and ensuring social housing plays
its full role in tackling the climate emergency will require significant resource investment,
potentially impacting the supply of new affordable homes.
• Government should immediately expand the Building Safety Fund to support
remediation costs facing social housing providers in addition to those that would
have otherwise been met by leaseholders.
• Government to work with the Fire Service, fire safety experts, lenders, insurers,
and valuation agencies to ensure that a proportionate approach to risk
prioritisation is adopted that ensures buildings with the highest risk are addressed,
without trapping thousands of homes in the building safety crisis despite posing
low levels of risk.
• Government to work with social housing providers to set agreed targets for carbon
reduction in existing and new homes and bring forward access to the £3.8bn Social
Housing Decarbonisation Fund in a manner that supports long-term investment in
home retrofit and provides certainty to the trades sector to develop capacity.
• Government to work with councils, the Mayor of London and the wider social
housing sector to develop London’s skills base in relation to home retrofit and
zero-carbon development.
27You can also read