Discrimination of Geographical Origin of Agricultural Products From Small-Scale Districts by Widely Targeted Metabolomics With a Case Study on ...
←
→
Page content transcription
If your browser does not render page correctly, please read the page content below
ORIGINAL RESEARCH
                                                                                                                                                       published: 24 May 2022
                                                                                                                                               doi: 10.3389/fnut.2022.891302

                                               Discrimination of Geographical
                                               Origin of Agricultural Products From
                                               Small-Scale Districts by Widely
                                               Targeted Metabolomics With a Case
                                               Study on Pinggu Peach
                                               Jie Zhao 1,2 , An Li 1,2 , Xinxin Jin 1,2 , Gang Liang 1,2 and Ligang Pan 1,2*
                                               1
                                                   Institute of Quality Standard and Testing Technology, Beijing Academy of Agriculture and Forestry Sciences, Beijing, China,
                                               2
                                                   Risk Assessment Lab for Agro-Products, Ministry of Agriculture, Beijing, China

                                               Geographical indications of agricultural products are characterized by high quality and
                                               regional attributes, while they are more likely to be counterfeited by similar products
                                               from nearby regions. Accurate discrimination of origin on small geographical scales is
                                               extremely important for geographical indications of agricultural products to avoid food
                                               fraud. In this study, a widely targeted metabolomics based on ultra-high-performance
                                               liquid chromatography–tandem mass spectrometry combined with multivariate statistical
                            Edited by:
                                               analysis was used to distinguish the geographical origin of Pinggu Peach of Beijing
                    Marco Iammarino,
Experimental Zooprophylactic Institute         and its two surrounding areas in Heibei province (China). Orthogonal partial least
 of Puglia and Basilicata (IZSPB), Italy       squares-discriminant analysis (OPLS-DA) based on 159 identified metabolites showed
                        Reviewed by:           significant separation from Pinggu and the other adjacent regions. The number of the
                       Rosa Perestrelo,
   Universidade da Madeira, Portugal           most important discriminant variables (VIP value >1) was up to 62, which contributed
                  Aly Farag El Sheikha,        to the differentiation model. The results demonstrated that the metabolic fingerprinting
  Jiangxi Agricultural University, China
                                               combined with OPLS-DA could be successfully implemented to differentiate the
                   *Correspondence:
                                               geographical origin of peach from small-scale origins, thus providing technical support
                          Ligang Pan
             panligang2012@126.com             to further ensure the authenticity of geographical indication products. The greenness of
                                               the developed method was assessed using the Analytical GREEnness Metric Approach
                    Specialty section:
                                               and Software (ARGEE) tool. It was a relatively green analytical method with room
          This article was submitted to
                        Food Chemistry,        for improvement.
                a section of the journal
                                               Keywords: Analytical GREEnness metric approach, metabolic fingerprint, origin discrimination, peach, small-scale
                    Frontiers in Nutrition
                                               districts, widely targeted metabolomics
            Received: 07 March 2022
             Accepted: 21 April 2022
             Published: 24 May 2022
                                               INTRODUCTION
                               Citation:
Zhao J, Li A, Jin X, Liang G and Pan L         Food fraud, motivated by economic profit, which includes adulteration, misbranding, false
(2022) Discrimination of Geographical          geographical origin, untrue agricultural production, and so on, is a growing worldwide concern
  Origin of Agricultural Products From
                                               among consumers, government agencies, policymakers, industry, and scientists in recent years
       Small-Scale Districts by Widely
 Targeted Metabolomics With a Case
                                               (1). Food authenticity is not only related to the quality and safety of food but also an
              Study on Pinggu Peach.           influencing factor for consumers’ interests and the rebuilding of consumer confidence (2). Geo-
                 Front. Nutr. 9:891302.        origin is one of the most important aspects of food authenticity, consumers have the right
      doi: 10.3389/fnut.2022.891302            to know the complete information of the food they are eating (3). However, the food trade

Frontiers in Nutrition | www.frontiersin.org                                             1                                               May 2022 | Volume 9 | Article 891302
Zhao et al.                                                                                  Discriminate Geographical Origin of Agricultural Products

globalization and the lack of reliable information during                ingredient authenticity (19), geographical origins of oranges and
food production and processing present challenges to food                shrimps, wine and cheese origin discrimination (20–23), and fruit
trustworthiness. Thus, determining food origin becomes essential         juice authenticity (24, 25). Widely targeted metabolomics analysis
in food supply chain management.                                         is a novel approach that integrates the advantages of nontargeted
    Geographical indication (GI) is a sign used on products that         and targeted metabolites. Based on multiple reaction monitoring
have a specific geographical origin and possess qualities or a           (MRM) and multiple ion monitoring, the aforementioned
reputation that are due to that origin, which is defined by the          analysis is a sensitive and accurate method for simultaneously
World Intellectual Property Organization (4). GI is not only             quantifying hundreds of known metabolites and nearly 1000
the local symbol but also a quality and reputation sign, which           known and unknown metabolites (26). Meanwhile, Rychlik et al.
contains a huge economic and cultural value. Some GI products            estimated that the conservative number of all considered food
have even become a major force and industrial pillar for regional        metabolites could be 500,000; it is expected that the analysis
economic growth. However, with the higher retail price and               of food metabolites may play an important role in food field
higher financial benefit of GI products, the commercial fraud            (27). In recent years, widely targeted metabolomics analysis has
issue is usually more likely to occur (5). China is promoting the        been successfully applied to analyze the metabolic response,
rural revitalization strategy to realize economic development and        metabolic alterations, and metabolite accumulation in plants
poverty reduction; therefore, the protection of good GI products         (28–30). Therefore, this study aimed to estimate the feasibility
is vital (6).                                                            of authenticating peach origins from adjacent producing regions
    China, as one of the origins of peach, is the largest peach          using the widely targeted metabolomics technique and provide
production country in the world. Pinggu, one district of Beijing,        a reliable geographical origin discrimination method for GI
is the largest peach-producing region in China, known as the             product protection.
“Homeland of Chinese peach.” Pinggu District has also received
the honorary titles “China’s High-Quality Peach Production               MATERIALS AND METHODS
Base” and “Nationally Advanced District for Standardized Peach
Production.” Pinggu Peach is the Chinese famous GI product               Chemicals and Reagents
known for its quality and flavor. It has been exported to more           Chromatogram-class methanol and acetonitrile were supplied
than 20 countries in Asia, Europe, and America. In addition,             by Honeywell (NJ, USA), and formic acid was supplied by
Pinggu Peach is one of China’s 10 native products with the               Sigma–Aldrich (MO, USA). Ultrapure water (18.3 MΩ cm) was
European Union protection (7); its brand value was estimated as          obtained from a Milli-Q purification system (Merck Millipore,
more than 10 billion in 2019. However, the counterfeiting by very        Darmstadt, Germany).
similar peach products from nearby regions is still happening
in the market, which damages the interests of the consumers              Sample Collection and Treatment
and producers and is not conducive to promoting the long-term            “Okubao” peach samples, which are a widely cultivated and
development of the brand. How to accurately distinguish the              popular variety, were collected from three adjacent and different
producing areas of peaches in adjacent areas or in small-scale           ecotype regions in the harvest season. The regions were Pinggu
districts is the key to solve this problem.                              Beijing (PG, the only large-concentrated contiguous mountain
    So far, a significant number of analytical methods have              plain in North China), Laoting Hebei province (LT, belongs to
been reported for identifying food geographical origins, such as         the coastal plain), and Shunping Hebei province (SP, classified as
isotopic analysis to trace the geographical origin of trout (8),         the inland plain region). The geographical location map of peach
amino acid carbon stable isotope fingerprinting to authenticate          samples is shown in Figure 1. A total of 24 representative peach
sea cucumber (9), multi-element analysis to determine the                samples with a medium size (diameter around 9 cm) and uniform
pork and tea (10, 11), combination of elemental and isotopic             maturity from the three areas were used for detecting metabolites.
composition to discriminate Asian rice and green tea in                  The samples were treated using a liquid-nitrogen flash freezer
China (12, 13), organic composition analysis to separate the             and saved at −80◦ C until use.
geographical origins of Lycium ruthenicum Murray (14), and
DNA barcoding or DNA fingerprinting to determine the                     Extraction of the Metabolites of Samples
geographical origin of fruits and mushrooms (15–17). These               Small pieces of samples were initially freeze-dried and then
methods can well trace the geographical origins of multiple              crushed with a mixer to extract the metabolites. Then, 100 mg
foods from a large geographical scope, such as different countries       powder of each sample was extracted with 1000 µL of
and even provinces. However, enough attention is not paid to             methanol/water mixture (v:v = 3:1) with vortexing for 30 s
distinguishing similar products from nearby places, which is             and then treated ultrasonically for 15 min in an ice bath. The
more challenging. Also, appropriate technologies or methods              samples were shaken overnight and centrifuged at 10 000 g for
have not been well developed and applied.                                15 min at 4◦ C. Then, 500 µL of the supernatants were dried
    Omics-based technologies, such as metabolomics, related to           under gentle nitrogen flow. The residue of each sample was
the strength of massive molecular tools can help circumvent              re-dissolved in 250 µL of methanol/water mixture (v:v=1:1)
the limitations of traditional methodologies, and therefore are          with vortexing for 30 s and sonicated at maximum frequency
being developed for the authentication of a wide range of food           (40 kHz) continuously for 15 min in the ice bath. Afterward, the
commodities, such as organic carrot authentication (18), food            samples were centrifuged at 10 000 g for 15 min at 4◦ C (31).

Frontiers in Nutrition | www.frontiersin.org                         2                                          May 2022 | Volume 9 | Article 891302
Zhao et al. Discriminate Geographical Origin of Agricultural Products
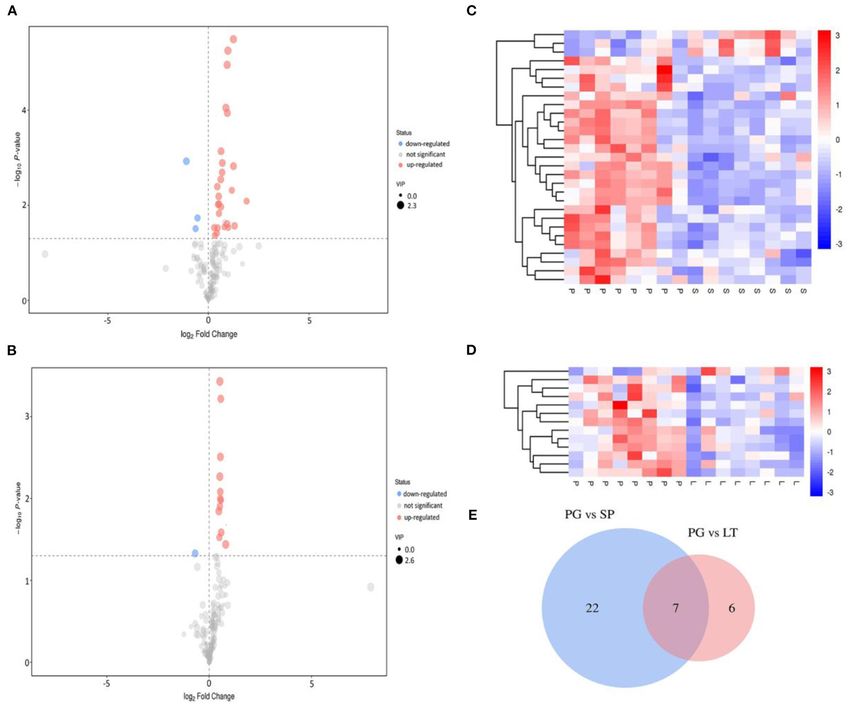
FIGURE 1 | Geographical map of peach sampling sites from different regions in China and the specific localities of peach samples within Pinggu (Beijing, capital city),
Shunping (Hebei province), and Laoting (Hebei province).
The resulting supernatant was taken for ultra-high-performance as follows: spray voltage: +3500/−3500 V; capillary temperature:
liquid chromatography–tandem mass spectrometry (UHPLC- 350◦ C; sheath gas: 30; aux gas: 10; CE: 10, 30, and 50. A Qtrap
MS/MS) analysis. The quality control (QC) sample was prepared 6500 (MA, USA) mass spectrometer was applied for metabolite
by mixing an equal aliquot of every sample and injected five times quantification in the MRM mode. The ion source parameters
to ensure the stability and repeatability of the system. were as follows: ion spray voltage: +5000/−4500 V; curtain gas:
35 psi; temperature: 500◦ C; ion source gas I: 55 psi; ion source gas
II: 60 psi; declustering potential: ±100 V (33).
Metabolite Acquisition and Identification
A widely targeted metabolomics analysis was conducted on a Statistical Analysis
Waters ACQUITY UPLC (MA, USA) coupled with a Thermo Q The raw MS data files were converted into the mzXML
Exactive Focus mass spectrometer (MA, USA) and a SCIEX 6500 format using ProteoWizard software and pre-processed (peak
Qtrap mass spectrometer (MA, USA) to evaluate the differences detection, data mining, alignment, and normalization) using
in metabolites among the three regions. The chromatographic MAPS software (version 3.2) (34). The metabolites were
separation was achieved on a Waters UHPLC HSS T3 column identified based on the in-house MS2 database, Human
(2.1 mm × 100 mm, 1.8 µm) maintained at 40◦ C. The injection Metabolome Database (HMDB), and Kyoto Encyclopedia of
volume was 2 µL, and the flow rate was 300 µL/min. The mobile Genes and Genomes (KEGG) database with Skyline software. The
phase A was 0.1% formic acid in water, and the mobile phase B multivariate statistical analysis, including principal component
was acetonitrile. The solvent gradient was as follows: 0–2 min, 2% analysis (PCA) and orthogonal partial least squares-discriminant
B; 2–11 min, 2–98% B; 11–13 min, 98% B; 13–15 min, 98%−2% analysis (OPLS-DA), was performed on mass spectral data
B (32). sets using SIMCA 14.1 software (Umetrics, Umeå, Sweden).
The QE Focus mass spectrometer (Thermo, MA, USA) Hierarchical cluster analysis (HCA) was performed with R
was used to acquire high-resolution MS/MS spectrum data software (www.r-project.org/). KEGG pathway analysis was used
in an information-dependent acquisition mode. In this mode, to annotate and enrich differential metabolites (35).
the acquisition software (Xcalibur 4.1, Thermo, MA, USA)
continuously evaluated the full scan survey MS data while RESULTS
collecting and triggering the acquisition of MS/MS spectra
depending on preselected criteria. In each cycle, three precursor Data Quality Assessment
ions whose intensities were greater than 5000 were chosen The accuracy and reproducibility of the analysis process were
for fragmentation at collision energy. Acquired mass range monitored using QC samples, which were inserted for every five
was divided into 70–300, 290–600, and 590–1100 with three test samples, to obtain high-quality mass spectrum data. The
injections. Elaectrospray Ionization source conditions were set retention time and the peak area of QC samples in the total ion
Frontiers in Nutrition | www.frontiersin.org 3 May 2022 | Volume 9 | Article 891302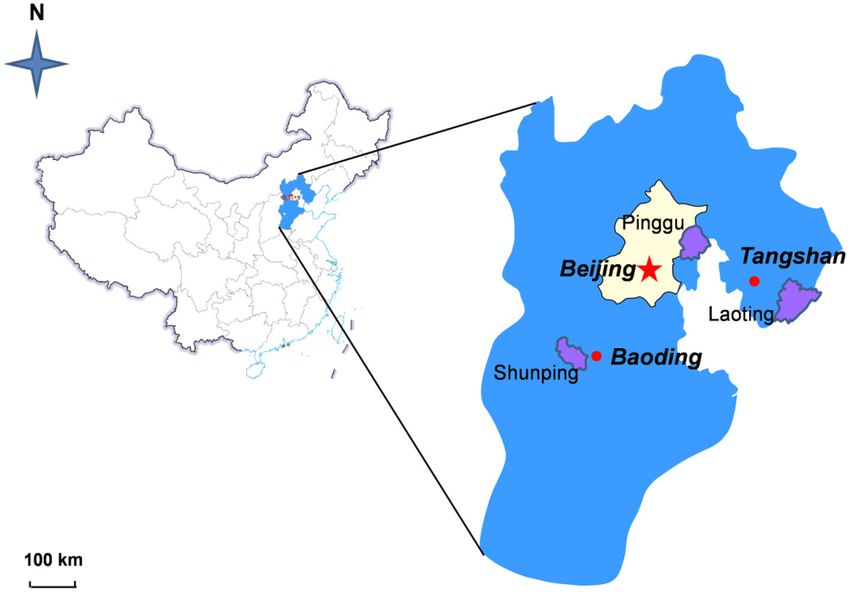
Zhao et al.                                                                                    Discriminate Geographical Origin of Agricultural Products

current graph overlapped well, indicating that the instrument             is shown in Supplementary Table S2. The largest number of
was stable (Supplementary Figure S1). As shown in Figure 2, the           organic acids and its derivatives was 11, including quinic acid,
distribution of QC samples was dense and close to the center              malic acid, and so forth. The next largest number of carbonyls
in the PCA score plot, and the QC samples were all within                 was 10, followed by prenol lipids and benzene and substituted
two standard deviations (Supplementary Figure S2), indicating             derivatives in the third place (the number was seven). The
good stability of the method and high quality of the data (28).           number of carboxylic acids and derivatives was five. A VIP value
Moreover, all the samples were within a 95% confidence interval,          higher than one indicated an important variable to the OPLS-
which also showed that the experimental data had no outlier in            DA model. If the same explanations existed between independent
the dataset.                                                              variables and y, the VIP values would be one. The higher the
                                                                          value, the greater the independent variable’s contribution to the
Qualitative and Quantitative Metabolites                                  model (37). Therefore, the relatively large number of VIP>1
In the present study, 174 peaks were detected and 159 peaks               (about 39%) also reflects the large similarity among metabolites
were left after using the relative standard deviation de-noising          in peach within a small geographical range, which, to some
and total ion current normalization method. The qualitative               extent, explains why it is difficult to differentiate the agricultural
and quantitative analyses of metabolites in samples were                  products from small-scale origins, so that many current analytical
performed based on the in-house MS2 database, KEGG database,              methods cannot accurately distinguish them.
HMDB database, and MRM. A total of 159 metabolites were
detected and quantified with the widely targeted metabolite               Screening of Differential Metabolites
technique, which included 26 carbonyls, 20 organic acids                  Compared with the traditional univariate analysis (UVA), such
and its derivatives, 18 amino acid and its derivatives, 14                as the Student t-test or analysis of variance, the multivariate
glucosides, 12 alcohols and polyols, 11 flavonoids, 5 nucleotide          data analysis pays more attention to the correlations between
and its derivatives, 5 glycerophospholipids and fatty acyls,              several variables simultaneously and analyzes the statistical rules
three vitamins, 13 benzene and substituted derivatives, and               of data sets under multiple objects and variables related to each
32 other metabolites including catechol derivatives, choline              other (38). Student t-test and OPLS-DA were simultaneously
and derivatives, pyridine derivatives, tetrapyrroles derivatives,         applied to find the differential metabolites between different
and others. The information and content of the identified                 groups. The metabolites with a P-value 1
metabolites is shown in Supplementary Table S1.                           were selected and regarded as significant differential metabolites.
                                                                          The volcano plot, HCA and Venn diagram were employed
Discrimination of Peach Origins                                           to further analyze and clearly show the characteristics of the
The orthogonal partial least squares-discriminant analysis                significant differential metabolites from different regions of peach
(OPLS-DA) decomposes the X matrix information into Y                      samples. The results are shown in Figure 5. The Venn diagram
correlation and irrelevance by orthogonal signal correction               (Figure 5E) showed 29 (PG vs SP) and 13 (PG vs LT) kinds of
and partial least squares-discriminant analysis (PLS-DA), which           significantly different metabolites, of which seven were common.
can filter out the variables not related to classification and            As shown in Figures 5A,B, most of the metabolites had no
can maximize group differentiation and help find differential             significant changes in the pairwise comparisons; for PG vs. SP,
metabolites (36). OPLS-DA was performed to determine whether              26 metabolites were upregulated while three metabolites were
the three regions of peach samples could be differentiated. The           downregulated; for PG vs. LT, 12 metabolites were upregulated
results of the OPLS-DA showed three distinctive groups: LT                while one metabolite was downregulated. As shown by HCA
group, PG group, and SP group. All samples were within 95%                results in Figures 5C,D, on the whole, different metabolites were
Hotelling’s T-squared ellipse (Figure 3). The three groups were           obvious between groups, and the variation pattern within groups
clearly separated, indicating differences in metabolic profiles.          was basically the same. Thus, the result further confirmed that
The permutation test was performed using 200 alignment                    the metabolic profiles were feasible to distinguish peach from
experiments to evaluate the statistical significance of the OPLS-         small-scale districts.
DA model. The permutation test result using an example of
group PG vs. SP is shown in Figure 4. The green and blue dots             KEGG Annotation and Enrichment Analysis
represented the R2 Y or Q2 after replacement, and the two dotted          of Differential Metabolites
lines represented the regression lines of R2 Y or Q2 . The value of       The KEGG pathway database is the most commonly used
R2 Y was very close to one, and the value of Q2 was closer to one,        database in the metabolic pathway and regulatory pathway
which showed the established modules corresponding to the real            studies in general. The analysis of metabolic pathways helps
situation of the samples. A relatively approximate distribution           systematically understand the impact of the habitat environment
would be obtained if a new sample was added to the model. The             on bionts, and provides some good references for further
result confirmed that the model was meaningful, and the original          exploring the adaptation of plants to the environment (39).
model could well explain the differences between the two groups           The pathways of differential metabolites mapping to KEGG
of samples.                                                               were determined through pairwise contrasts of significant
    The number of the variable important in the projection (VIP           differential metabolites among regions. Based on the metabolites
value) greater than one was up to 62 with further analysis of             annotated to the metabolic pathways, 14 (48.28%) and 6 (46.15%)
the metabolic profiles. The information of the 62 compounds               metabolites, respectively, coming from PG vs. SP and PG

Frontiers in Nutrition | www.frontiersin.org                          4                                           May 2022 | Volume 9 | Article 891302
Zhao et al.                                                                                                     Discriminate Geographical Origin of Agricultural Products

 FIGURE 2 | PCA score plot of test samples and quality control (QC) samples (     , QC sample;      test sample).

 FIGURE 3 | Orthogonal partial least squares-discriminant analysis (OPLS-DA) test for the identification of the three regions of peach samples. PG (Pinggu, Beijing

     ), SP (Shunping, Hebei       ), and LT (Laoting, Hebei   ).

vs. LT were successfully annotated to the KEGG pathways.                               The arginine and proline metabolism pathways possessed a
The results of the KEGG enrichment analysis are shown in                               greater impact factor. The two enriched metabolic pathways were
Figure 6. The bubble plots displayed the enriched metabolic                            glycerophospholipid metabolism and cysteine and methionine
pathway, while each bubble represented a metabolic pathway.                            metabolism compared with PG vs. SP. As shown in Figure 6B,
Figure 6A shows three significantly enriched pathways compared                         cysteine and methionine metabolism pathways had a greater
with PG vs. SP: ascorbate and aldarate metabolism, inositol                            impact factor. Hence, differences in amino acid metabolism
phosphate metabolism, and arginine and proline metabolism.                             were found between the samples from Pinggu District and

Frontiers in Nutrition | www.frontiersin.org                                       5                                               May 2022 | Volume 9 | Article 891302
Zhao et al.                                                                                         Discriminate Geographical Origin of Agricultural Products

 FIGURE 4 | Permutation test of OPLS-DA model for Pinggu group vs. Shunping group.

those from the other two habitats. Not only are amino acids                      and safety issues during their activities (45). The greenness
the main components of proteins, but also the variety and                        of methods is gradually being taken seriously by researchers.
contents of amino acids are important parameters to their                        The Analytical GREEnness metric approach (AGREE) is a
nutritional quality and sensory taste in fruits (40). Besides,                   novel, easily interpretable, and informative assessment approach
amino acids participate in many metabolic networks that control                  (46). In our study AGREE tools were applied to evaluate the
growth and adaptation to the environment; some amino acid                        greenness of the developed analytical method. The output of
metabolism pathways are the signals of plant response to the                     the GREEnness metric approach is a clock-like graph, with
environment (41). Furthermore, evidence showed that arginine                     the overall score and color representation in the middle. The
could promote the biosynthesis of proline, polyamines, and nitric                final assessment, as in Figure 7, showed the overall light green–
oxide to improve cold tolerance in plants (42). Meanwhile, a                     colored pictogram with a numerical value of 0.56, which
previous study showed that proline possessed many biological                     illustrated that the widely targeted metabolomics method was
functions, such as maintaining the osmotic balance, stabilizing                  relatively green. In the 12 AGREE segment, the value closer to
the protein structure, clearing of oxygen-derived free radicals,                 one and dark green color indicated that the assessed procedure
and restraining membrane lipid peroxidation; it also had certain                 was green, while the value of zero and yellow color indicated
effects in postharvest fruits to cope with chilling injury (43).                 that the corresponding procedure needed improvement and
Liao et al. assessed the roles of cysteine and methionine in the                 amelioration. For the Analytical GREEnness report sheet for this
response of poplar leaf to salt stress. They found that the salt-                study associated with Supporting Information, please refer to
triggered H2 S-cysteine cycle and methionine-associated ethylene                 Appendix 2.
synthesis induce the alternative oxidase pathway to scavenge
reactive oxygen species by cooperating with antioxidant enzyme
systems (44). Therefore, different habitats were associated with                 DISCUSSION
different agricultural product quality, which is the characteristic
of GI products. The results also showed that our widely targeted                 Food authenticity, including geographical origin, planting
metabolomics method was effective in discriminating peaches                      pattern (conventional and organic), or animal origin, has
from different regions.                                                          become increasingly important, directly influencing people’s
                                                                                 consumption willingness and happiness indices. In particular,
Evaluation of Method Greenness                                                   people have higher psychological expectations for high-end and
The greenness of the analytical methods was assessed using                       regional characteristic products, which have a higher price and
green analytical chemistry (GAC). GAC is the concept that                        often more serious counterfeiting. Ensuring food authenticity
makes analytical chemists consider the environmental, health,                    is an important challenge faced by researchers, regulatory

Frontiers in Nutrition | www.frontiersin.org                                 6                                         May 2022 | Volume 9 | Article 891302
Zhao et al.                                                                                                     Discriminate Geographical Origin of Agricultural Products

 FIGURE 5 | Volcano plot and hierarchical cluster analysis (HCA), and Venn diagram. (A,B) represent the volcano plot showing the differential expression of metabolites
 between PG and SP, and PG and LT, respectively. The red dots in the figure represent the differentially expressed metabolites that were increased, the blue dots
 represent the decreased differentially expressed metabolites, and the gray color indicates the differentially expressed metabolites that were not significant. (C,D)
 represent the heat map showing the differential expression of metabolites between PG and SP, and PG and LT, respectively. The red color indicates the increase in
 differentially expressed metabolites, while the blue color indicates the decrease in differentially expressed metabolites. (E) is the Venn diagram showing the specific
 and common differential metabolites between PG and SP, and PG and LT.

bodies, and industries. The accuracy of geographical origin is                         certainly increases the difficulty in popularization and application
an important part of food authenticity, which has always been                          to a certain extent. Furthermore, the distinction effect is
a hot research issue. At present, many researches are devoted                          still not very ideal for the regional products from small-
to this area, and the related technologies are also diverse.                           scale districts.
However, great challenges in distinguishing agricultural products                          In our study, peach samples were collected from Beijing
from adjacent origins remain. Researchers combined multiple                            Pinggu District, which is the major peach-producing area. The
techniques, such as stable isotopes, elements, and amino acids, to                     other two sampling sites were located in Hebei province, which
trace the origin of milk from different districts in Inner Mongolia                    are adjacent peach-producing areas to Pinggu District. The
(47). However, the combination application of technologies not                         straight line distance among Pinggu District and the other two
only requires more experimental equipment and complicated                              sampling sites was about 200 km. All the three sites belonged to
experimental operation but also increases error factors and test                       the same cumulative temperature zone, but with some climatic
costs. Besides, the simultaneous application of more technologies                      differences. The UHPLC-MS/MS was applied to determine

Frontiers in Nutrition | www.frontiersin.org                                       7                                               May 2022 | Volume 9 | Article 891302
Zhao et al.                                                                                                     Discriminate Geographical Origin of Agricultural Products

 FIGURE 6 | KEGG annotations and enrichment of differentially expressed metabolites of each pairwise comparison of peach. (A) PG vs. SP; (B) PG vs. LT. Bubbles
 represent metabolic pathways, and the size and horizontal coordinate of the bubble represent the influence factor in the pathway. The larger the bubble size, the
 greater the impact factor. The longitudinal coordinate and the color of the bubble represent the P-value of enrichment analysis. The deeper the color and the smaller
 the P-value represent more significant enrichment degree.

                                                                                       the agronomic measures or production management also
                                                                                       affects the physiological metabolism of plants to some extent.
                                                                                       Therefore, further studies specifically aimed at the effect of
                                                                                       the environmental factors on the metabolic expression profile
                                                                                       alone should be performed for ensuring the consistency of
                                                                                       agronomic measures to further clarify the reasons for the
                                                                                       differences in metabolite expression profiles. In addition, the
                                                                                       high-resolution mass spectrometry was first used to establish
                                                                                       the MRM mass spectrometry library, and then the high-
                                                                                       sensitivity mass spectrometry was applied to quantify metabolites
                                                                                       in this study. This technological process helped improve the
                                                                                       accuracy of metabolite characterization and quantification.
                                                                                       It also narrowed the number of metabolites obtained and
                                                                                       lost some metabolite information to a certain extent, leaving
                                                                                       some room for subsequent improvement to this method.
 FIGURE 7 | Greenness of the developed method was assessed with                        Anyway, the widely targeted metabolomics results showed
 Analytical GREEnness metric approach (AGREE); annotated result of a generic
                                                                                       that the kind and number of identified metabolites were
 assessment (above) and the corresponding color scale for reference (below).
                                                                                       also satisfactory for the differentiation of samples from
                                                                                       different origins.
                                                                                           At present, metabolomic techniques based on different
the geographical origin of peach samples from three adjacent
                                                                                       principles have been increasingly reported in the field of product
origins. This technology had not only super-sensitivity but
                                                                                       origin traceability and authenticity identification. The unique
also adequate repeatability, and the experimental results were
                                                                                       advantages of this technology definitely provide more room for
stable and reliable. Based on differential metabolite screening in
                                                                                       development in the future.
combination with multivariate statistical analysis, this method
achieved good performance in differentiating the peach samples
from small-scale districts. Also, the prediction model was stable                      CONCLUSIONS
and reliable, and could be used to classify the origins of samples
based on identified patterns.                                                          The results of this study confirmed that the metabolites
   However, this study also had some aspects for further                               based on widely targeted metabolomics could be used as
in-depth research and improvement. First, the differences in                           fingerprints to discriminate the geographical origin of peach
the metabolite expression profiles of peach samples from                               samples from small-scale districts. In addition, the representative
different geographical origins were confirmed by this study,                           metabolites with VIP value >1 made larger contributions to
but the reasons for the differences are still ambiguous. Besides,                      the distinguishing model with OPLS-DA. In conclusion, the

Frontiers in Nutrition | www.frontiersin.org                                       8                                               May 2022 | Volume 9 | Article 891302
Zhao et al. Discriminate Geographical Origin of Agricultural Products
proposed method was a more effective method to combine FUNDING
the widely targeted metabolomics and OPLS-DA for the
identification of the geographic origins of peach samples from The National Natural Science Foundation of China (32102057)
small-scale origins. The method could help further protect the and the Beijing Natural Science Foundation (6194038) supported
geographical indications, protected designation of origin, and the to the samples collection and metabonomics analysis. Besides,
regional characteristic products. the China’s Post-doctoral Science Fund (2019M650554) also
provided fund support. The publication fees will be provided by
DATA AVAILABILITY STATEMENT our institution.
The datasets presented in this study can be found in online ACKNOWLEDGMENTS
repositories. The names of the repository/repositories can be
found in the article/Supplementary Material. The authors would like to thank all those people who offered help
during manuscript preparation.
AUTHOR CONTRIBUTIONS
SUPPLEMENTARY MATERIAL
JZ: investigation, methodology, formal analysis, visualization,
and writing. AL, XJ, and GL: resources. LP: supervision and The Supplementary Material for this article can be found
project administration. All authors contributed to the article and online at: https://www.frontiersin.org/articles/10.3389/fnut.2022.
approved the submitted version. 891302/full#supplementary-material
REFERENCES 13. Ni K, Wang J, Zhang Q, Yi X, Ma L, Shi Y, et al. Multi-element composition
and isotopic signatures for the geographical origin discrimination of green
1. Danezis GP, Tsagkaris AS, Brusic V, Georgiou CA. Food authentication: tea in China: a case study of Xihu Longjing. J Food Compos Anal. (2018)
state of the art and prospects. Curr Opin Food Sci. (2016) 10:22– 67:104–9. doi: 10.1016/j.jfca.2018.01.005
31. doi: 10.1016/j.cofs.2016.07.003 14. Wang Z, Yan Y, Nisar T, Zou L, Yang X, Niu P, et al. Comparison
2. Kaiser M, Algers A. Trust in food and trust in science. Food Ethic. (2017) and multivariate statistical analysis of anthocyanin composition
1:93–5. doi: 10.1007/s41055-017-0021-5 in Lycium ruthenicum Murray from different regions to trace
3. Macready AL, Hieke S, Klimczuk-Kochańska M, Szumiał S, Vranken geographical origins: the case of China. Food Chem. (2018)
L, Grunert KG. Consumer trust in the food value chain and its 246:233–41. doi: 10.1016/j.foodchem.2017.11.030
impact on consumer confidence: a model for assessing consumer trust 15. El Sheikha AF, Bouvet JM, Montet D. Biological bar code for determining
and evidence from a 5-country study in Europe. Food Policy. (2020) the geographical origin of fruits using 285 rDNA fingerprinting of fungal
92:101880. doi: 10.1016/j.foodpol.2020.101880 communities by PCR-DGGE: an application to Shea tree fruits. Qual Assur
4. Amilien V, Moity-Maïzi P. Controversy and sustainability for geographical Saf Crop. (2011) 3:40–7. doi: 10.1111/j.1757-837X.2010.00090.x
indications and localized agro-food systems: thinking about a dynamic link. 16. El Sheikha AF, Condur A, Metayer I, Le Nguyen DD, Loiseau G, Montet
Brit Food J. (2019) 121:2981–94. doi: 10.1108/BFJ-12-2019-843 D. Determination of fruit origin by using 26S rDNA fingerprinting of yeast
5. Teuber R. Consumers’ and producers’ expectations towards geographical communities by PCR-DGGE: preliminary application to Physalis fruits from
indications empirical evidence for a German case study. Brit Food J. (2011) Egypt. Yeast. (2009) 26:567–73. doi: 10.1002/yea.1707
113:900–18. doi: 10.1108/00070701111148423 17. Farag E, Hu DM. How to trace the geographic origin of mushrooms? Trends
6. Li Yl, Zheng YJ, Tang L, Su ZY, Xiong C. Study on the identification Food Sci Technol. (2018) 78:292–303. doi: 10.1016/j.tifs.2018.06.008
of geographical indication Wuchang rice based on the content 18. Cubero-Leon E, De Rudder O, Maquet A. Metabolomics for organic food
of inorganic elements. Spectrosc Spect Anal. (2016) 36:834–837. authentication: results from a long-term field study in carrots. Food Chem.
doi: 10.3964/j.issn.1000-0593(2016)03-0834-04 (2018) 239:760–70. doi: 10.1016/j.foodchem.2017.06.161
7. Liu QY. “Just Peachy” in Pingu. China Today. (2011) 5:76–7. 19. Brigante FI, Lucini Mas A, Pigni NB, Wunderlin DA, Baroni
8. Camin F, Perini M, Bontempo L, Galeotti M, Tibaldi E, Piasentier E. Stable MV. Targeted metabolomics to assess the authenticity of bakery
isotope ratios of H, C, O, N and S for the geographical traceability of products containing chia, sesame and flax seeds. Food Chem. (2020)
Italian rainbow trout (Oncorhynchus mykiss). Food Chem. (2018) 267:288– 312:126059 doi: 10.1016/j.foodchem.2019.126059
95. doi: 10.1016/j.foodchem.2017.06.017 20. Diaz R, Pozo OJ, Sancho JV, Hernandez F. Metabolomic approaches
9. Zhao X, Liu Y, Li Y, Zhang X, Qi H. Authentication of the for orange origin discrimination by ultra-high performance liquid
sea cucumber (Apostichopus japonicus) using amino acids chromatography coupled to quadrupole time-of-flight mass spectrometry.
carbon stable isotope fingerprinting. Food Control. (2018) Food Chem. (2014) 157:84–93. doi: 10.1016/j.foodchem.2014.02.009
91:128–37. doi: 10.1016/j.foodcont.2018.03.041 21. Chatterjee NS, Chevallier OP, Wielogorska E, Black C, Elliott CT.
10. Kim JS, Hwang IM, Lee GH, Park YM, Choi JY, Jamila N, et al. Geographical Simultaneous authentication of species identity and geographical
origin authentication of pork using multi-element and multivariate data origin of shrimps: untargeted metabolomics to recurrent biomarker
analyses. Meat Sci. (2017) 123:13–20. doi: 10.1016/j.meatsci.2016.08.011 ions. J Chromatogr A. (2019) 1599:75–84. doi: 10.1016/j.chroma.2019.
11. Li L, Wen B, Zhang X, Zhao Y, Duan Y, Song X, et al. Geographical 04.001
origin traceability of tea based on multi-element spatial distribution and 22. Uttl L, Hurkova K, Kocourek V, Pulkrabova J, Tomaniova M, Hajslova
the relationship with soil in district scale. Food Control. (2018) 90:18– J. Metabolomics-based authentication of wines according to grape variety.
28. doi: 10.1016/j.foodcont.2018.02.031 Czech J Food Sci. (2019) 37:239–45. doi: 10.17221/82/2019-CJFS
12. Chung IM, Kim JK, Lee KJ, Park SK, Lee JH, Son NY, et al. Geographic 23. Kandasamy S, Yoo J, Yun J, Kang HB, Seol KH, Ham JS. Rapid
authentication of Asian rice (Oryza sativa L) using multi-elemental and discrimination and authentication of Korean farmstead mozzarella cheese
stable isotopic data combined with multivariate analysis. Food Chem. (2018) through MALDI-TOF and multivariate statistical analysis. Metabolites. (2021)
240:840–9. doi: 10.1016/j.foodchem.2017.08.023 11:333. doi: 10.3390/metabo11060333
Frontiers in Nutrition | www.frontiersin.org 9 May 2022 | Volume 9 | Article 891302Zhao et al. Discriminate Geographical Origin of Agricultural Products
24. Jandric Z, Islam M, Singh DK, Cannavan A. Authentication of Indian citrus 39. Ogata H, Goto S, Fujibuchi W, Kanehisa M. Computation
fruit/fruit juices by untargeted and targeted metabolomics. Food Control. with the KEGG pathway database. Biosystems. (1998) 47:119–
(2017) 72:181–8. doi: 10.1016/j.foodcont.2015.10.044 28. doi: 10.1016/S0303-2647(98)00017-3
25. Xu L, Xu ZZ, Kelly S, Liao XJ. Integrating untargeted metabolomics 40. Schiffman SS, Dackis C. Taste of Nutrients - amino-acids, vitamins,
and targeted analysis for not from concentrate and from concentrate and fatty-acids. Percept Psychophys. (1975) 17:140–6. doi: 10.3758/BF032
orange juices discrimination and authentication. Food Chem. (2020) 329 03878
:127130. doi: 10.1016/j.foodchem.2020.127130 41. Jia Z, Wang Y, Wang L, Zheng Y, Jin P. Amino acid
26. Feng Z, Gao Z, Jiao X, Shi J, Wang R. Widely targeted metabolomic analysis metabolomic analysis involved in flavor quality and cold
of active compounds at different maturity stages of ’Hupingzao’ jujube. J Food tolerance in peach fruit treated with exogenous glycine betaine.
Compos Anal. (2020) 88:103417. doi: 10.1016/j.jfca.2020.103417 Food Res Int. (2022) 157:111204. doi: 10.1016/j.foodres.2022.
27. Rychlik M, Schmitt-Kopplin P. Reading from the crystal ball: the laws of 111204
Moore and Kurzweil applied to mass spectrometry in food analysis. Front 42. Bokhary SUF, Wang L, Zheng Y. Jin P. Pre-storage hot water treatment
Nutr. (2020) 7:1–7. doi: 10.3389/fnut.2020.00009 enhances chilling tolerance of zucchini (Cucurbita pepo L) squash by
28. Li Q, Song J. Analysis of widely targeted metabolites of the Euhalophyte regulating arginine metabolism. Postharvest Biol Tec. (2020) 166:111229.
Suaeda salsa under saline conditions provides new insights into salt doi: 10.1016/j.postharvbio.2020.111229
tolerance and nutritional value in halophytic species. BMC Plant Biol. (2019) 43. Cao S, Song C, Shao J, Bian K, Chen W, Yang Z. Exogenous melatonin
19. doi: 10.1186/s12870-019-2006-5 treatment increases chilling tolerance and induces defense response in
29. Qin ZX, Liao DQ. Chen YL, Zhang CY, An RP, Zeng Q, et al. A harvested peach fruit during cold storage. J Agric Food Chem. (2016) 64:5215–
widely metabolomic analysis revealed metabolic alterations of Epimedium 22. doi: 10.1021/acs.jafc.6b01118
pubescens leaves at different growth stages. Molecules. (2019) 25:1– 44. Liao Y, Cui R, Yuan T, Xie Y, Gao Y. Cysteine and methionine contribute
14. doi: 10.3390/molecules25010137 differentially to regulate alternative oxidase in leaves of poplar (Populus
30. Sawada Y, Akiyama K, Sakata A, Kuwahara A, Otsuki H, Sakurai T, et al. deltoides x Populus euramericana ’Nanlin 895’) seedlings exposed to
Widely targeted metabolomics based on large-scale ms/ms data for elucidating different salinity. J Plant Physiol. (2019) 240:153017. doi: 10.1016/j.jplph.2019.
metabolite accumulation patterns in plants. Plant Cell Physiol. (2009) 50:37– 153017
47. doi: 10.1093/pcp/pcn183 45. Pena-Pereira F, Wojnowski W, Tobiszewski M. AGREE-analytical
31. Chen W, Gong L, Guo Z, Wang W, Zhang H, Liu X, et al. A Novel integrated GREEnness metric approach and software. Anal Chem. (2020)
method for large-scale detection, identification, and quantification of widely 92:10076–82. doi: 10.1021/acs.analchem.0c01887
targeted metabolites: application in the study of rice metabolomics. Mol Plant. 46. Abou-Taleb NH, El-Enany NM, El-Sherbiny DT, El-Subbagh HI. Spider
(2013) 6:1769–80. doi: 10.1093/mp/sst080 diagram and analytical GREEnness metric approach for assessing
32. Luo P, Yin P, Zhang W, Zhou L, Lu X, Lin X, et al. Optimization the greenness of quantitative 1H-NMR determination of lamotrigine:
of large-scale pseudotargeted metabolomics method based on liquid Taguchi method based optimization. Chemometr Intell Lab Syst. (2021)
chromatography-mass spectrometry. J Chromatogr A. (2016) 1437:127– 209:104198. doi: 10.1016/j.chemolab.2020.104198
36. doi: 10.1016/j.chroma.2016.01.078 47. Xie L, Zhao S, Rogers KM, Xia Y, Zhang B, Suo R, et al. A
33. Zha H, Cai Y, Yin Y, Wang Z, Li K, Zhu ZJ, et al. to MRM: case of milk traceability in small-scale districts-Inner Mongolia
Development of high-coverage targeted metabolomics method using of China by nutritional and geographical parameters. Food
SWATH technology for biomarker discovery. Anal Chem. (2018) 90:4062– Chem. (2020) 316:126332. doi: 10.1016/j.foodchem.2020.12
70. doi: 10.1021/acs.analchem.7b05318 6332
34. Smith CA, Want EJ, O’Maille G, Abagyan R, Siuzdak G, XCMS. Processing
mass spectrometry data for metabolite profiling using Nonlinear peak Conflict of Interest: The authors declare that the research was conducted in the
alignment, matching, and identification. Anal Chem. (2006) 78:779– absence of any commercial or financial relationships that could be construed as a
87. doi: 10.1021/ac051437y potential conflict of interest.
35. Brauer CJ, Unmack PJ, Beheregaray LB. Comparative ecological
transcriptomics and the contribution of gene expression to the Publisher’s Note: All claims expressed in this article are solely those of the authors
evolutionary potential of a threatened fish. Mol Ecol. (2017) and do not necessarily represent those of their affiliated organizations, or those of
26:6841–56. doi: 10.1111/mec.14432
the publisher, the editors and the reviewers. Any product that may be evaluated in
36. Bylesjo M, Rantalainen M, Cloarec O, Nicholson JK, Holmes E, Trygg J,
this article, or claim that may be made by its manufacturer, is not guaranteed or
et al. discriminant analysis: combining the strengths of PLS-DA and SIMCA
classification. J Chemom. (2006) 20:341–51. doi: 10.1002/cem.1006 endorsed by the publisher.
37. He P, Xu X, Zhang B, Li Z, Feng H, Yang G, et al. Estimation of leaf chlorophyll
content in winter wheat using variable importance for projection (VIP) Copyright © 2022 Zhao, Li, Jin, Liang and Pan. This is an open-access article
with hyperspectral data. in Conference on Remote Sensing for Agriculture, distributed under the terms of the Creative Commons Attribution License (CC BY).
Ecosystems, and Hydrology XVII part of the International Symposium on The use, distribution or reproduction in other forums is permitted, provided the
Remote Sensing; Sep 22-24 (Toulouse, France) (2015). original author(s) and the copyright owner(s) are credited and that the original
38. Kylefors K. Evaluation of leachate composition by multivariate publication in this journal is cited, in accordance with accepted academic practice.
data analysis (MVDA). J Environ Manage. (2003) 68:367– No use, distribution or reproduction is permitted which does not comply with these
76. doi: 10.1016/S0301-4797(03)00103-8 terms.
Frontiers in Nutrition | www.frontiersin.org 10 May 2022 | Volume 9 | Article 891302You can also read